
The XRP price today is trading around $2.22 after a failed attempt to sustain above $2.30 in the last 24 hours. While the token has reclaimed bullish momentum from last week’s lows near $2.05, a decisive breakout is still lacking. Technical indicators show XRP trapped within a large multi-month symmetrical triangle, with volatility compressing rapidly ahead of a possible price expansion.
What’s Happening With XRP’s Price?
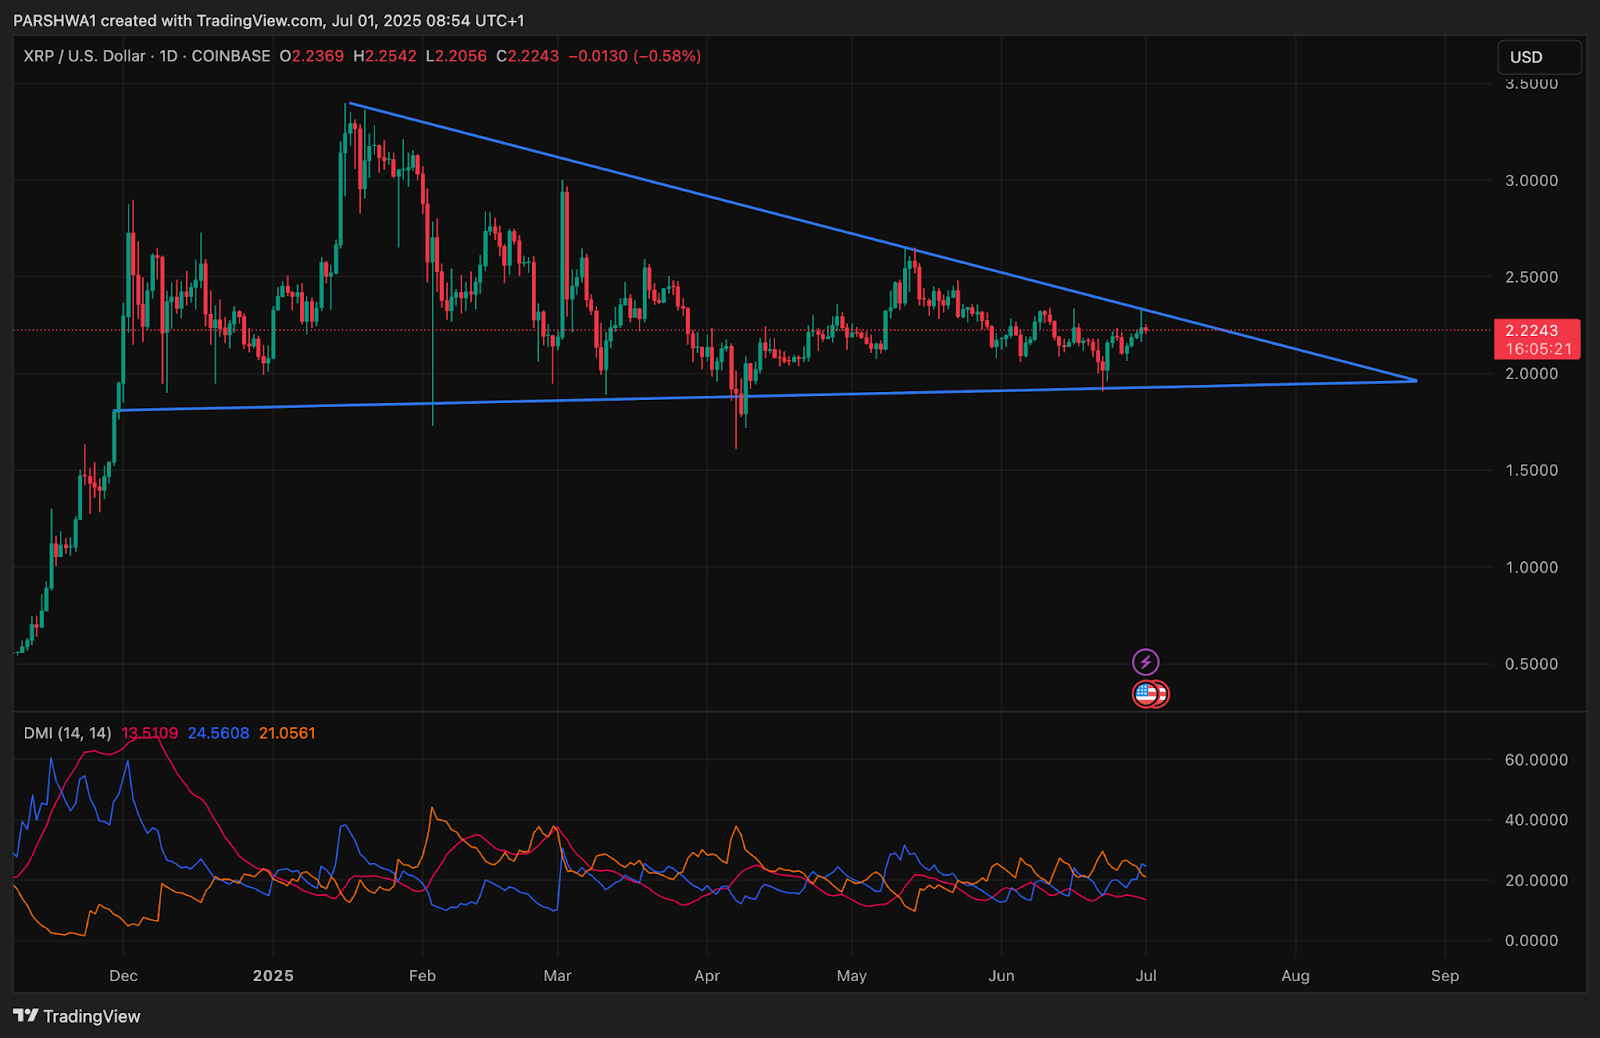
On the daily chart, XRP price is trading inside a well-defined triangle formation, with lower highs from March and consistent support just above $2.00. The range is getting tighter, and XRP is now pressing against the descending resistance trendline, hinting at a potential breakout attempt over the next few sessions.
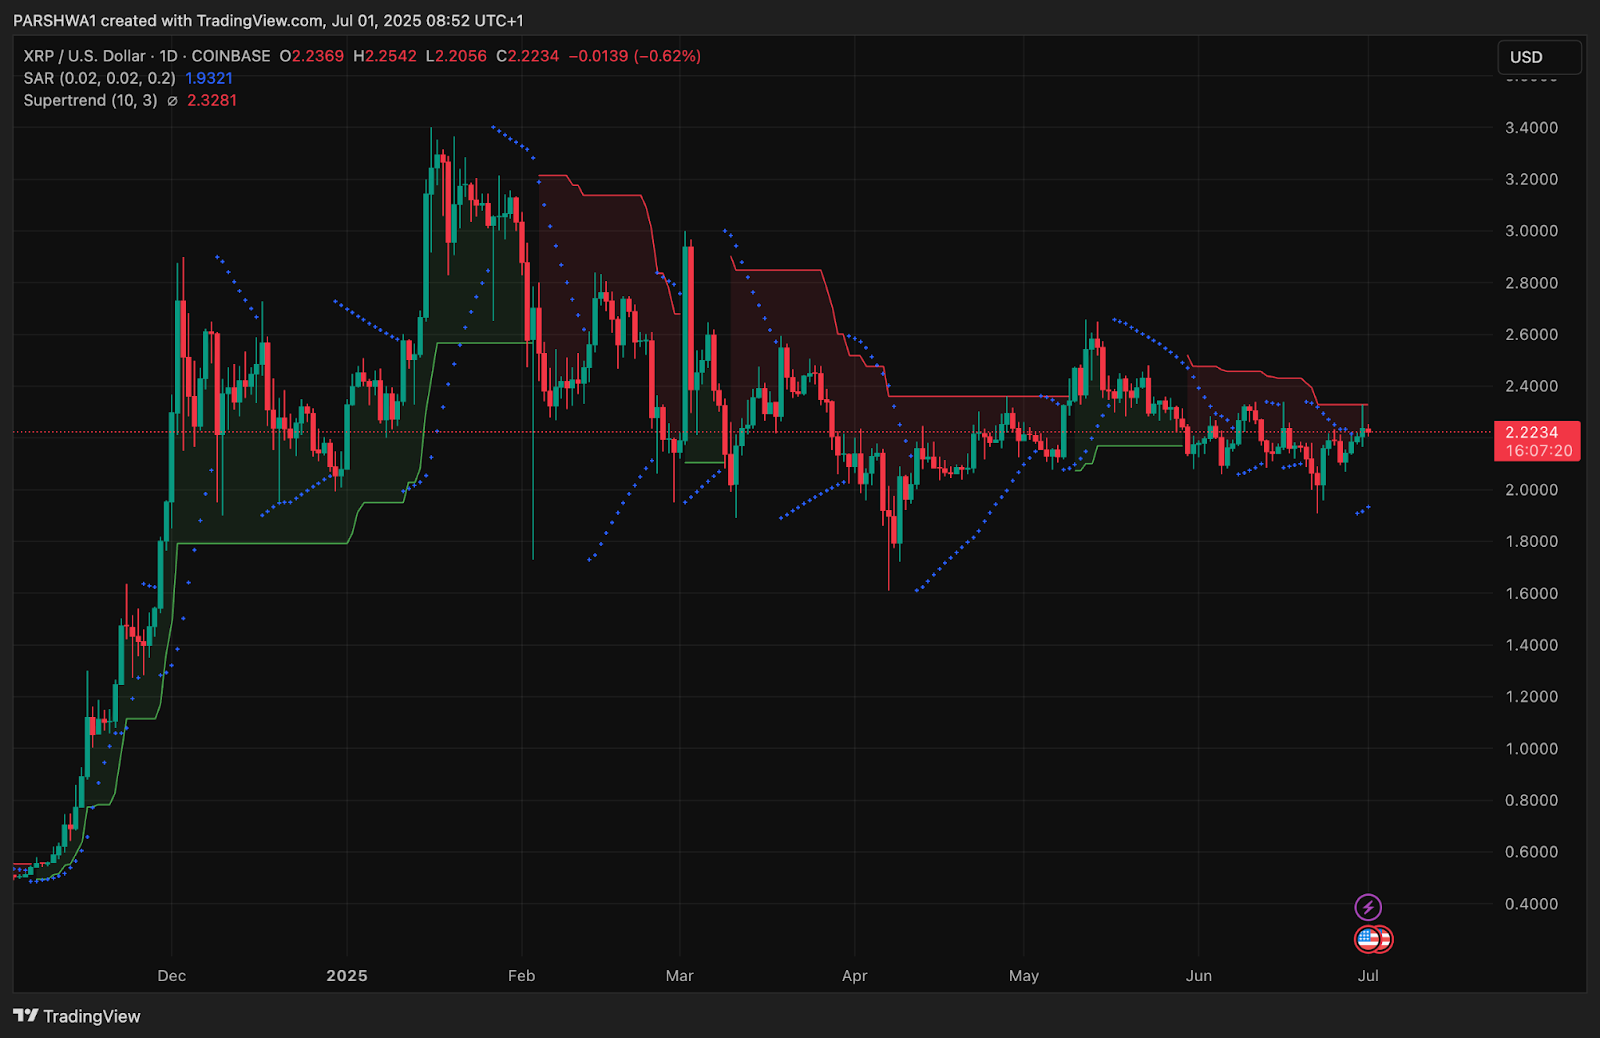
The Supertrend indicator flipped bearish again at $2.3281, capping upside momentum. Meanwhile, the Parabolic SAR dots have shifted above the current price, suggesting short-term pressure remains. Despite this, XRP continues to hold above the $2.20 support, a level defended aggressively since June.
Directional Movement Index (DMI) shows a moderate trend presence, with ADX at 21 and +DI just slightly below -DI. This reflects indecision, but the structure favors a volatile move once the triangle pattern resolves.
Why Is the XRP Price Going Down Today?
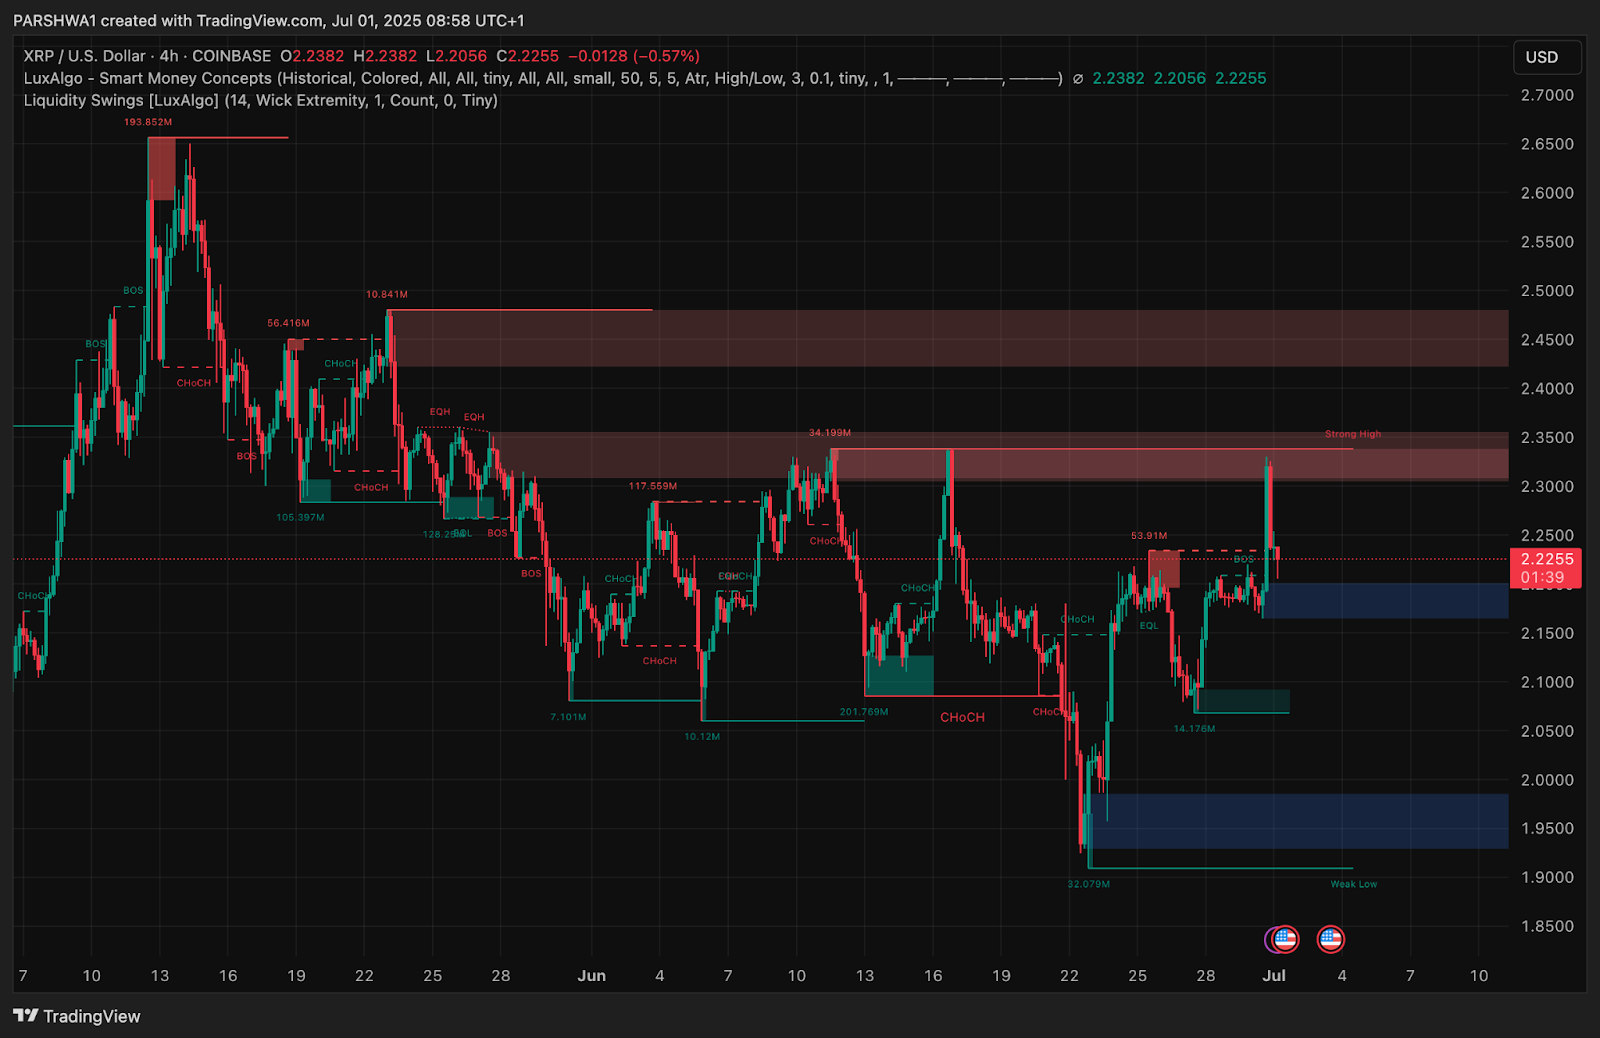
The short-term decline in XRP price is due to rejection from a key Smart Money resistance zone between $2.30 and $2.35. This area has previously marked multiple bearish CHoCHs (Change of Character), and yesterday’s spike failed to close above it with strength. Price was also rejected at the upper boundary of the symmetrical triangle, further adding to the pullback narrative.

On the 30-minute chart, the RSI dropped to 47.7 after a bearish divergence from the $2.30 peak. The MACD histogram also flipped negative, signaling weakening momentum. Despite earlier bullish divergence on June 28, momentum failed to carry through above the $2.30 handle.
The Smart Money chart shows a significant liquidity grab just above $2.30, followed by a drop back into the $2.22 zone. This suggests the recent rally may have been a stop-hunt targeting short-term breakout traders before price reverts toward equilibrium.
XRP Price: Bullish Setup Builds Despite Resistance Rejection
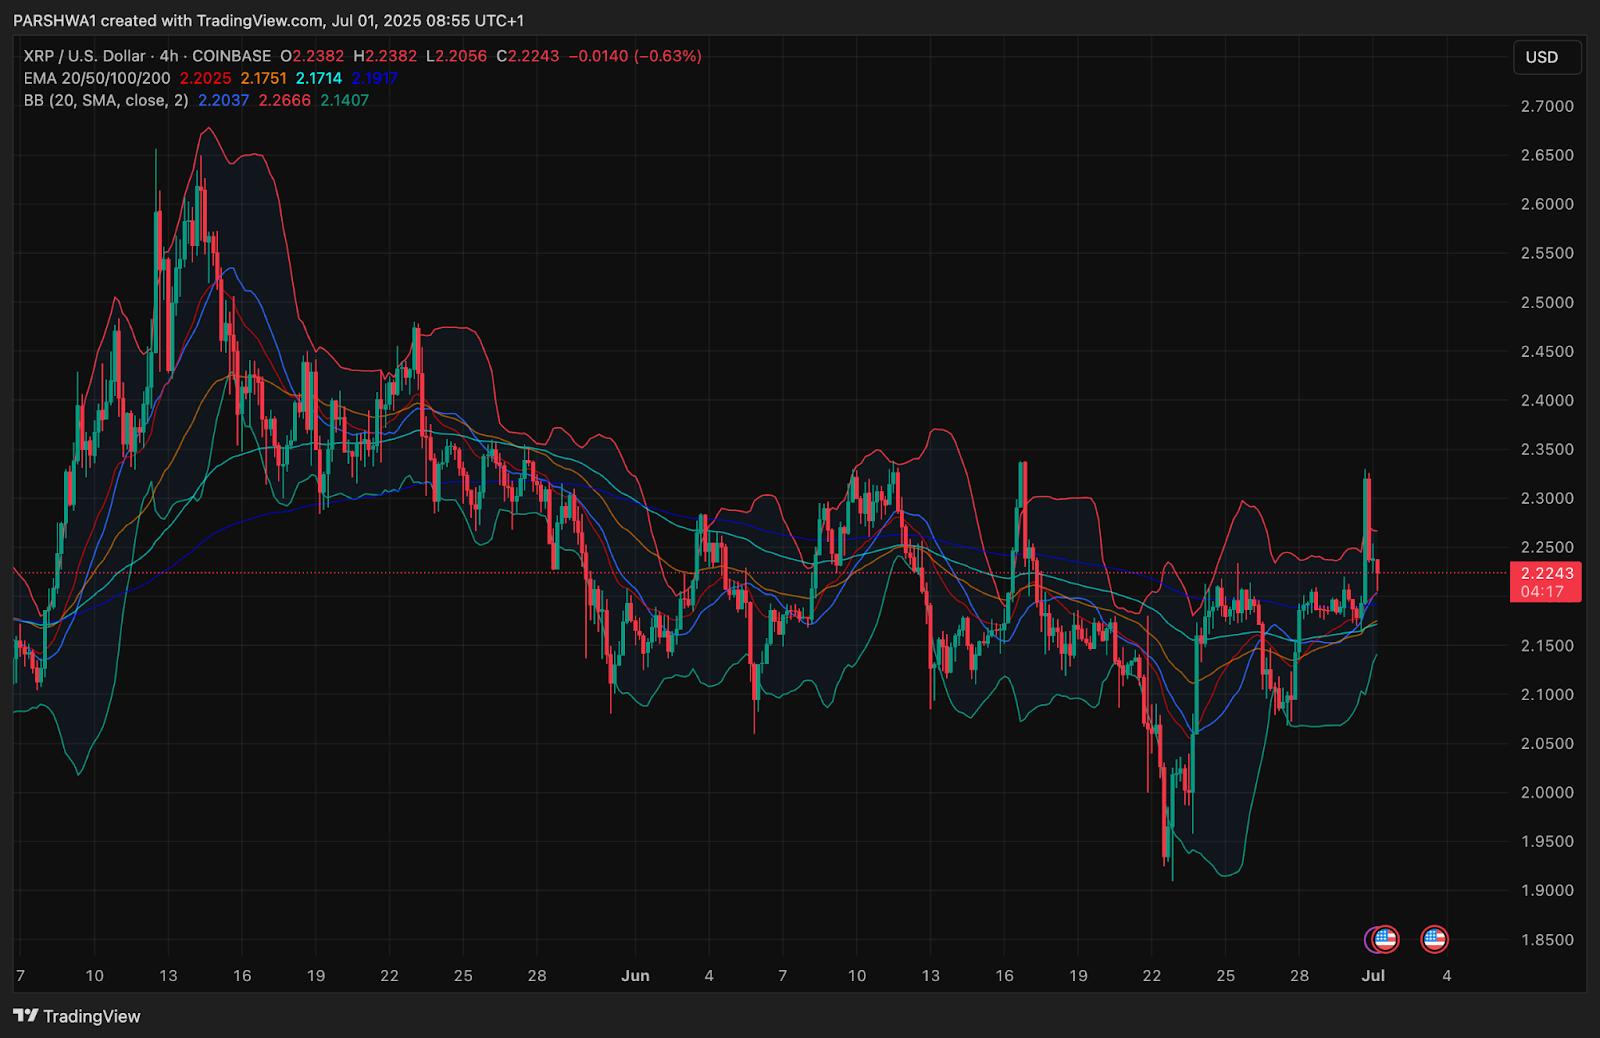
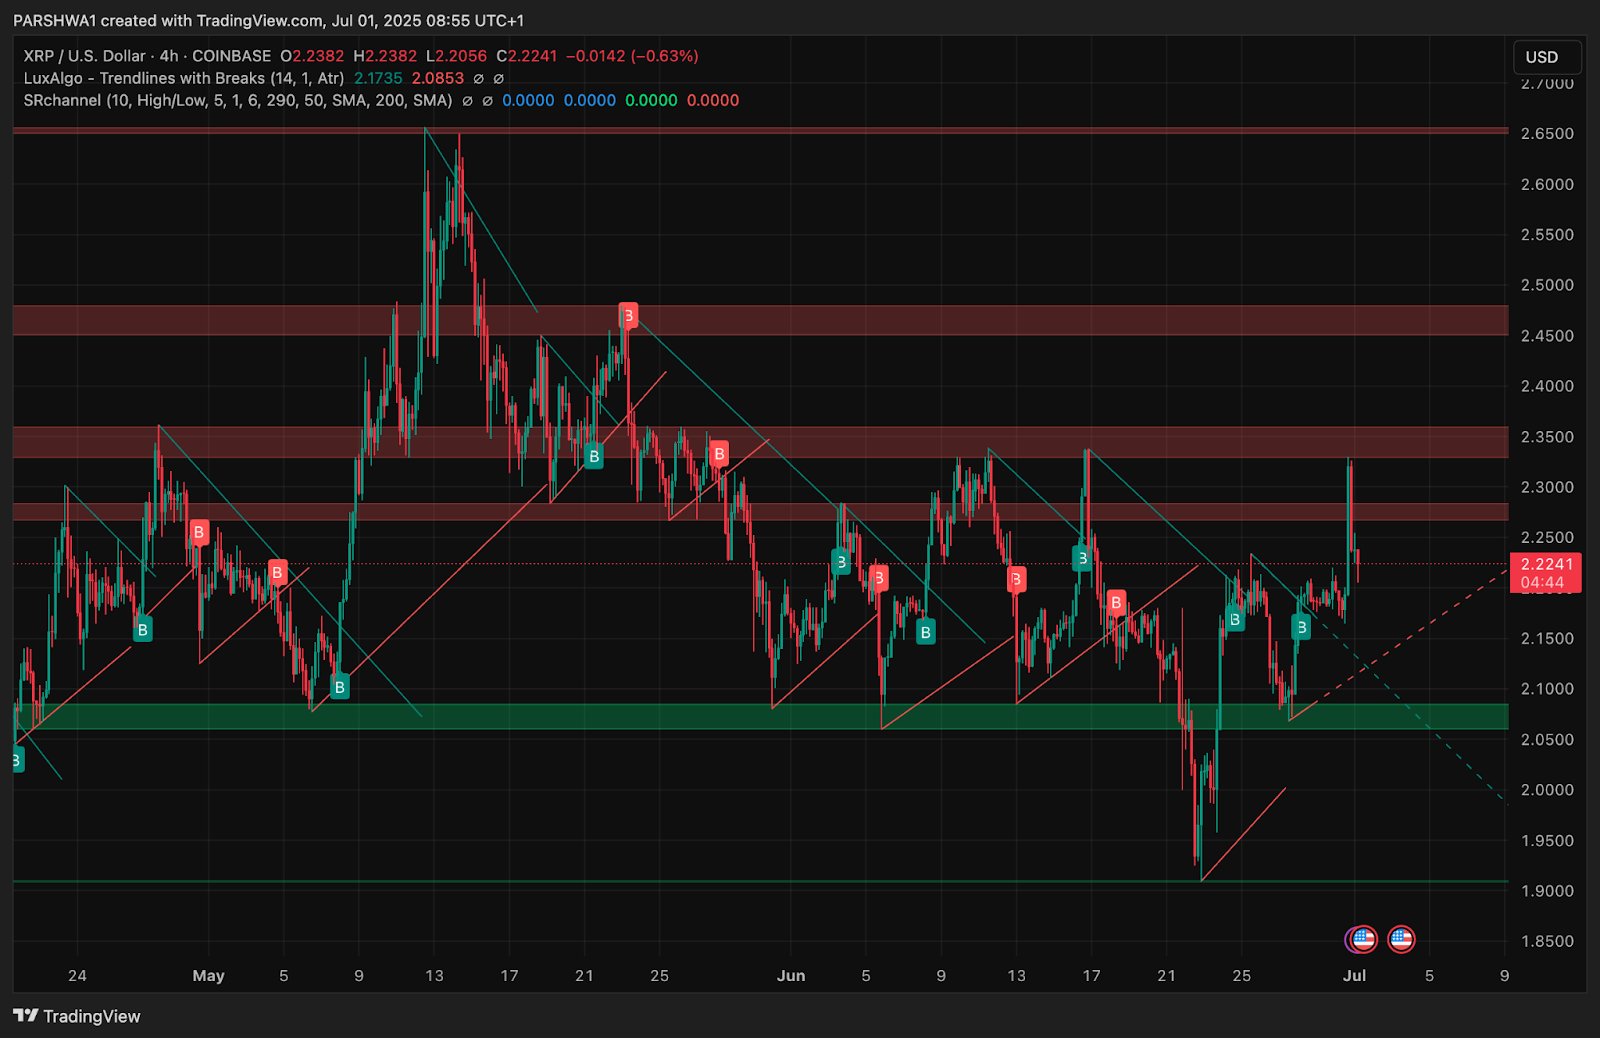
On the 4-hour chart, XRP remains above the EMA 20 and 50 zones, currently near $2.20 and $2.17, respectively. This offers near-term dynamic support. The Bollinger Bands have started to expand after a long contraction, hinting at rising XRP price volatility.
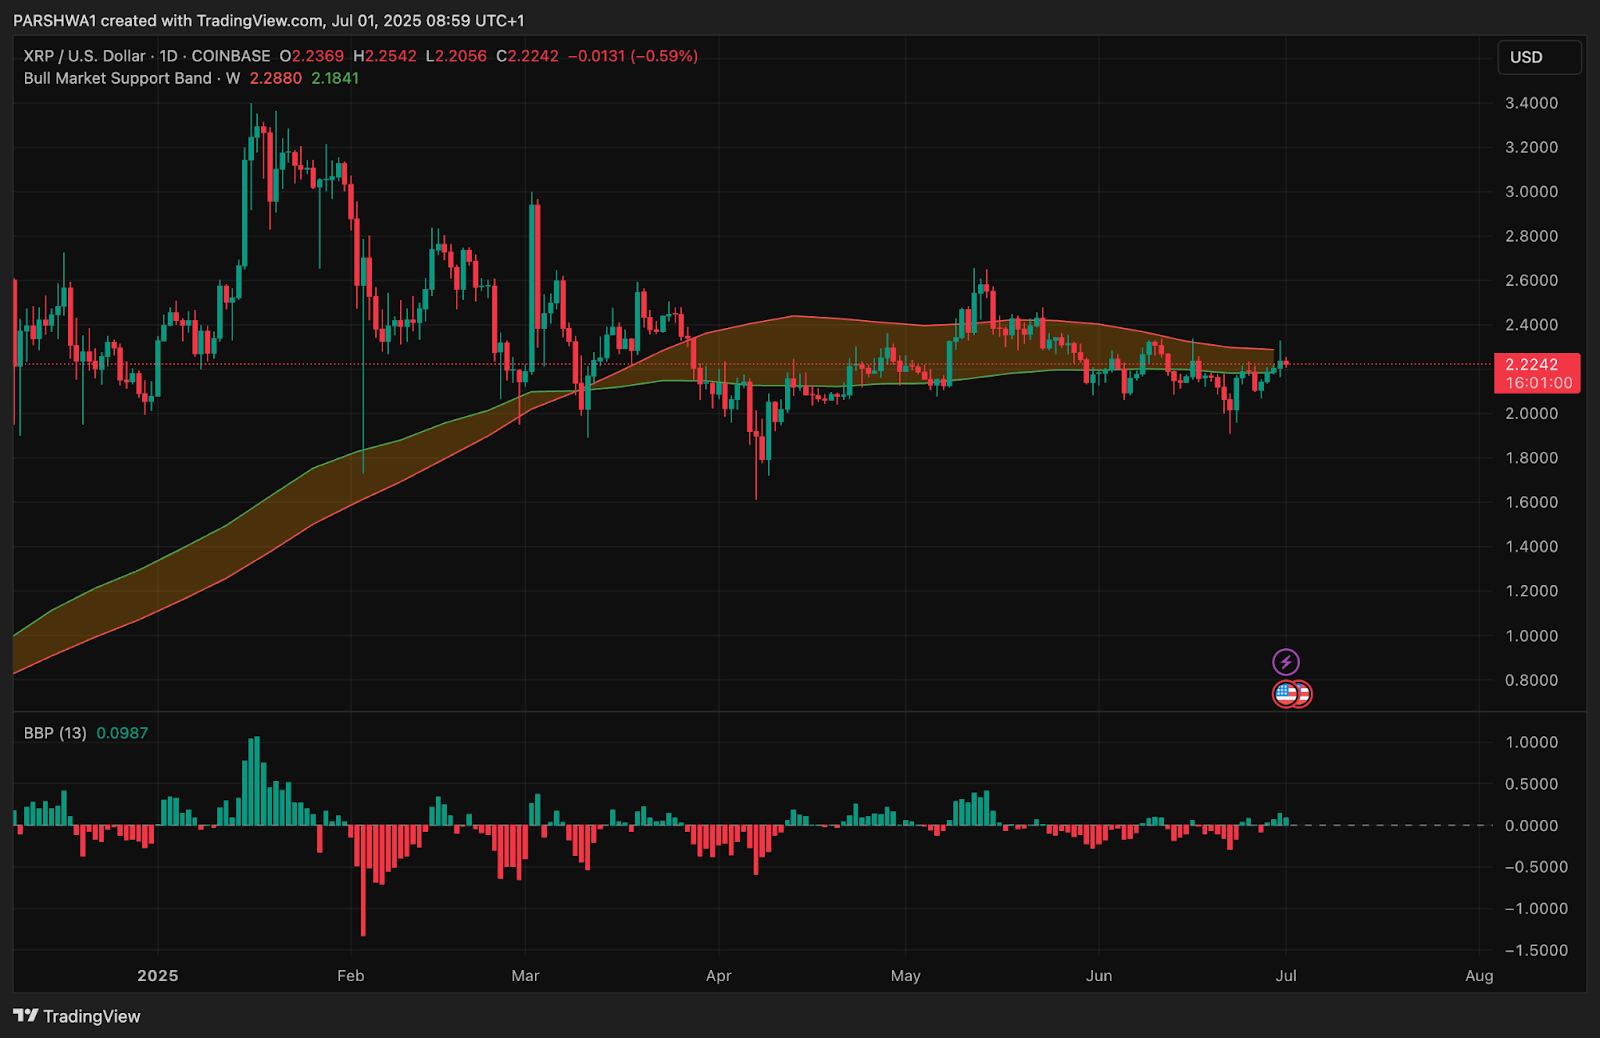
The Bull Market Support Band (daily) lies between $2.18 and $2.28. With price currently at $2.22, XRP is sandwiched within the band, and a clear close above $2.28 could confirm bullish continuation. However, failure to reclaim this zone may lead to another retest of the $2.10–$2.05 support range.
From a structural standpoint, XRP’s price action has been printing a series of equal lows and liquidity sweeps on the 4-hour Smart Money chart, with CHoCH forming near $2.06 and $2.14. If buyers hold $2.20 and reclaim $2.28 on volume, the door opens to challenge the upper resistance block again.
XRP Price Prediction: Short-Term Outlook (24h)
In the short term, the XRP price update depends on whether bulls can push above the multi-week resistance trendline near $2.26–$2.28. A successful breakout above this zone with high volume could extend the rally toward $2.34 and potentially $2.40.
On the downside, losing the $2.20 handle may expose the $2.10–$2.06 support block, a zone where buyers have previously shown strong interest. If this breaks, deeper downside toward $1.98 becomes likely.
Traders should watch for a reaction around the triangle apex and the $2.26 resistance. Breakout confirmation requires a daily candle close above $2.30 with volume exceeding the 10-day average.
XRP Price Forecast Table: July 2, 2025
| Indicator/Zone | Level (USD) | Signal |
| Resistance 1 | $2.26 | Triangle breakout level |
| Resistance 2 | $2.34 | Smart Money block rejection |
| Support 1 | $2.20 | Immediate holding zone |
| Support 2 | $2.06 | Smart Money demand block |
| EMA 20/50 (4H) | $2.20 / $2.17 | Near-term support cluster |
| RSI (30-min) | 47.7 | Bearish divergence confirmed |
| MACD (30-min) | Negative crossover | Weakening bullish momentum |
| Supertrend (Daily) | $2.3281 | Trend still bearish |
| Bollinger Band Width (4H) | Expanding | Volatility breakout approaching |
| DMI ADX (Daily) | 21 | Trend building, not confirmed |
| Bull Market Support Band | $2.18 – $2.28 | Compression zone to watch |
Disclaimer: The information presented in this article is for informational and educational purposes only. The article does not constitute financial advice or advice of any kind. Coin Edition is not responsible for any losses incurred as a result of the utilization of content, products, or services mentioned. Readers are advised to exercise caution before taking any action related to the company.
 Price Prediction: Can Bulls Sustain the $0.045 Push?")


