
- XRP trades near $2.20 as buyers defend the $1.88 support that has anchored the market since May.
- $39M in fresh outflows keeps the broader trend bearish despite the intraday rebound.
- Descending trendline and EMA cluster block upside, leaving $2.38 as the key breakout level.
XRP price today trades near $2.20 after rebounding from the $1.88 demand zone, a level that has acted as the market’s primary support floor since May. The recovery lifts short term momentum, but the broader structure remains under pressure as the descending trendline continues to cap every rally.
Price sits below the 20 day EMA at $2.20, the 50 day EMA at $2.38, the 100 day EMA at $2.52 and the 200 day EMA at $2.52. This alignment keeps the trend pointed lower even though buyers forced an aggressive intraday reversal from the mid $1.80 region on Monday.
Spot Outflows Rise As Buyers Stay Defensive
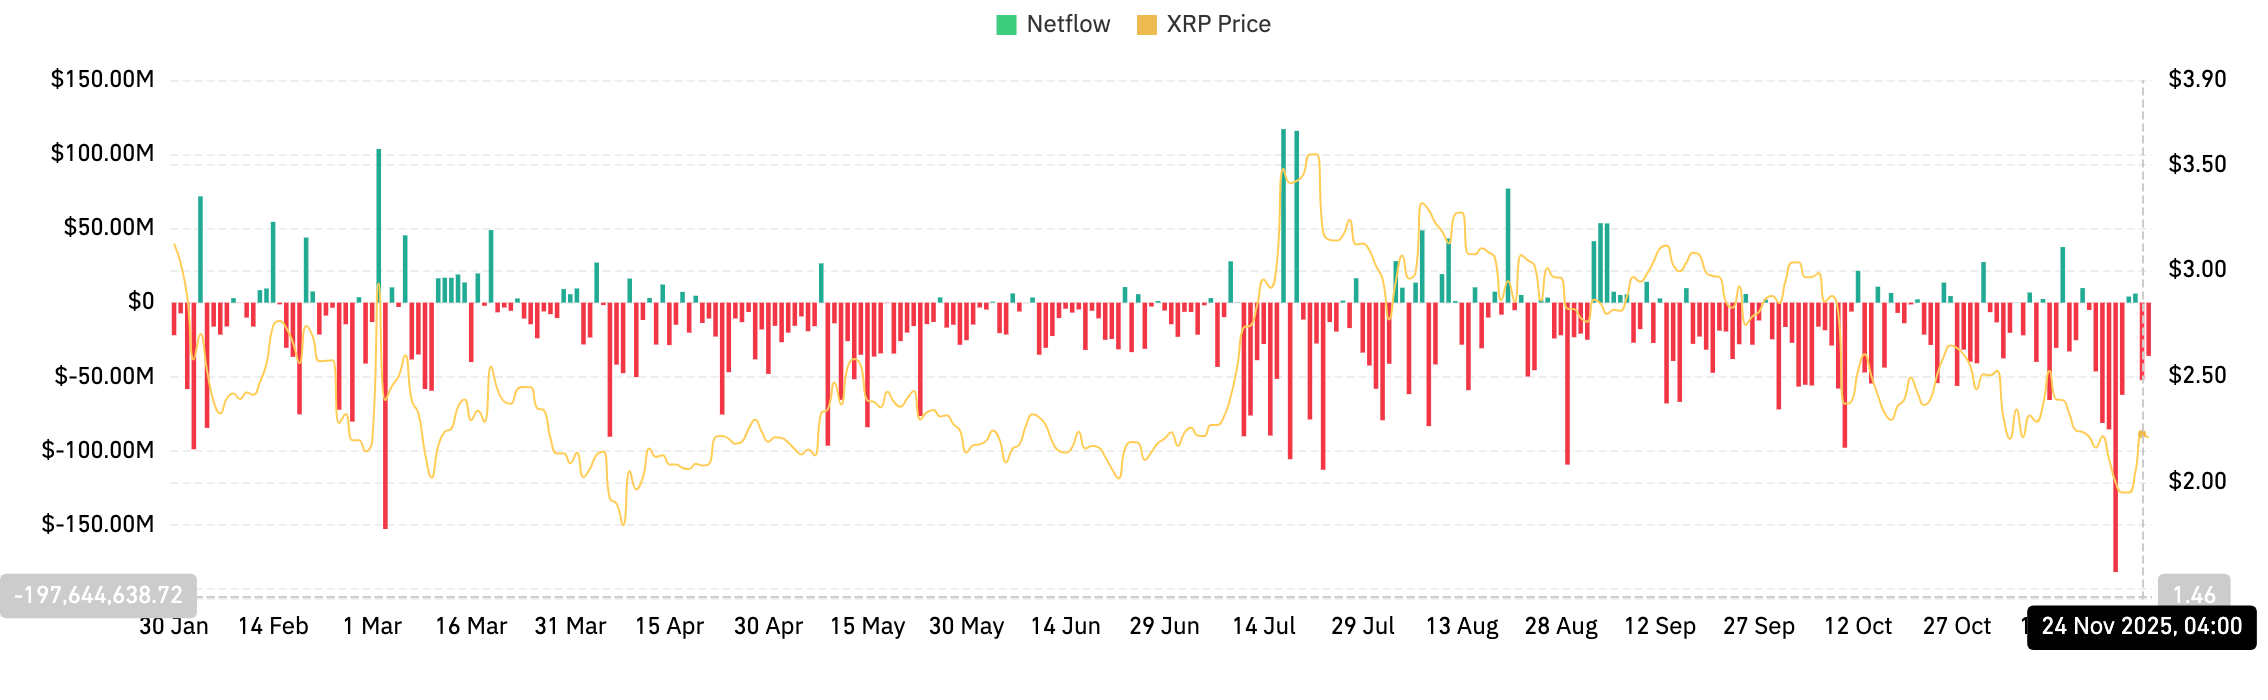
Coinglass data shows $39.57 million in net outflows on November 25. This continues a pattern of persistent red prints on the flow chart stretching back through most of October and November. The negative flow streak shows that traders are sending tokens back to exchanges rather than accumulating.
Spot flows have followed a consistent theme throughout the past two months. Downside pressure increases whenever XRP rallies toward the 20 day EMA, and outflows rise each time price approaches the descending trendline. This keeps sentiment weak and makes upside attempts fragile.
Related: Bitcoin Price Prediction: Buyers Defend Key Support as ETF Outflows Intensify
The rebound from $1.88 was supported by reduced selling at lower levels. Yet flows still show distribution rather than accumulation, which means intraday strength has not shifted the broader picture.
Trendline Rejection Keeps Structure Under Pressure
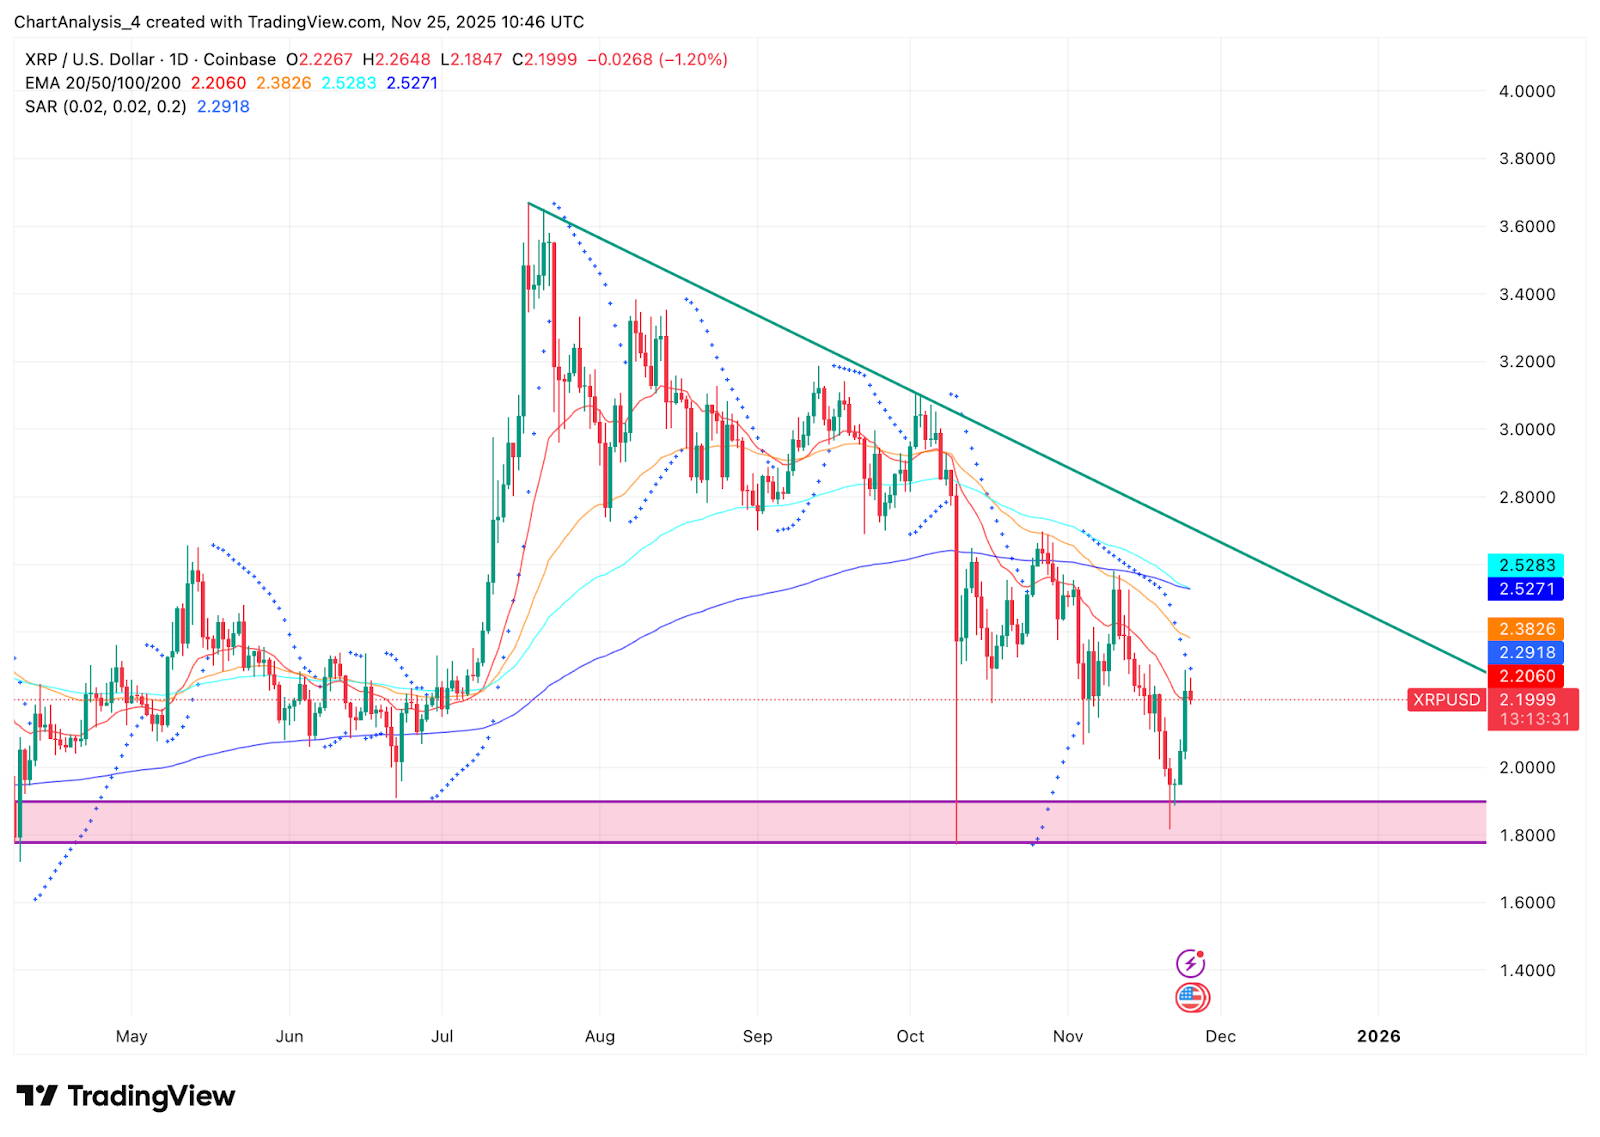
The daily chart shows the descending trendline stretching from the $3.80 peak in July. Each rally into the line has been rejected, and the most recent touch near $2.29 created another lower high inside the broader downtrend.
The Parabolic SAR remains above price, adding another layer of downside bias. Until the SAR flips and price closes above $2.38, XRP will struggle to build momentum.
The $1.88 to $1.95 zone remains the most important demand band. It has been tested multiple times and continues to hold, which gives buyers a structural foothold. A clean break below this zone would open the path toward deeper liquidity near $1.70.
Intraday Momentum Shows Stronger Attempts To Stabilize
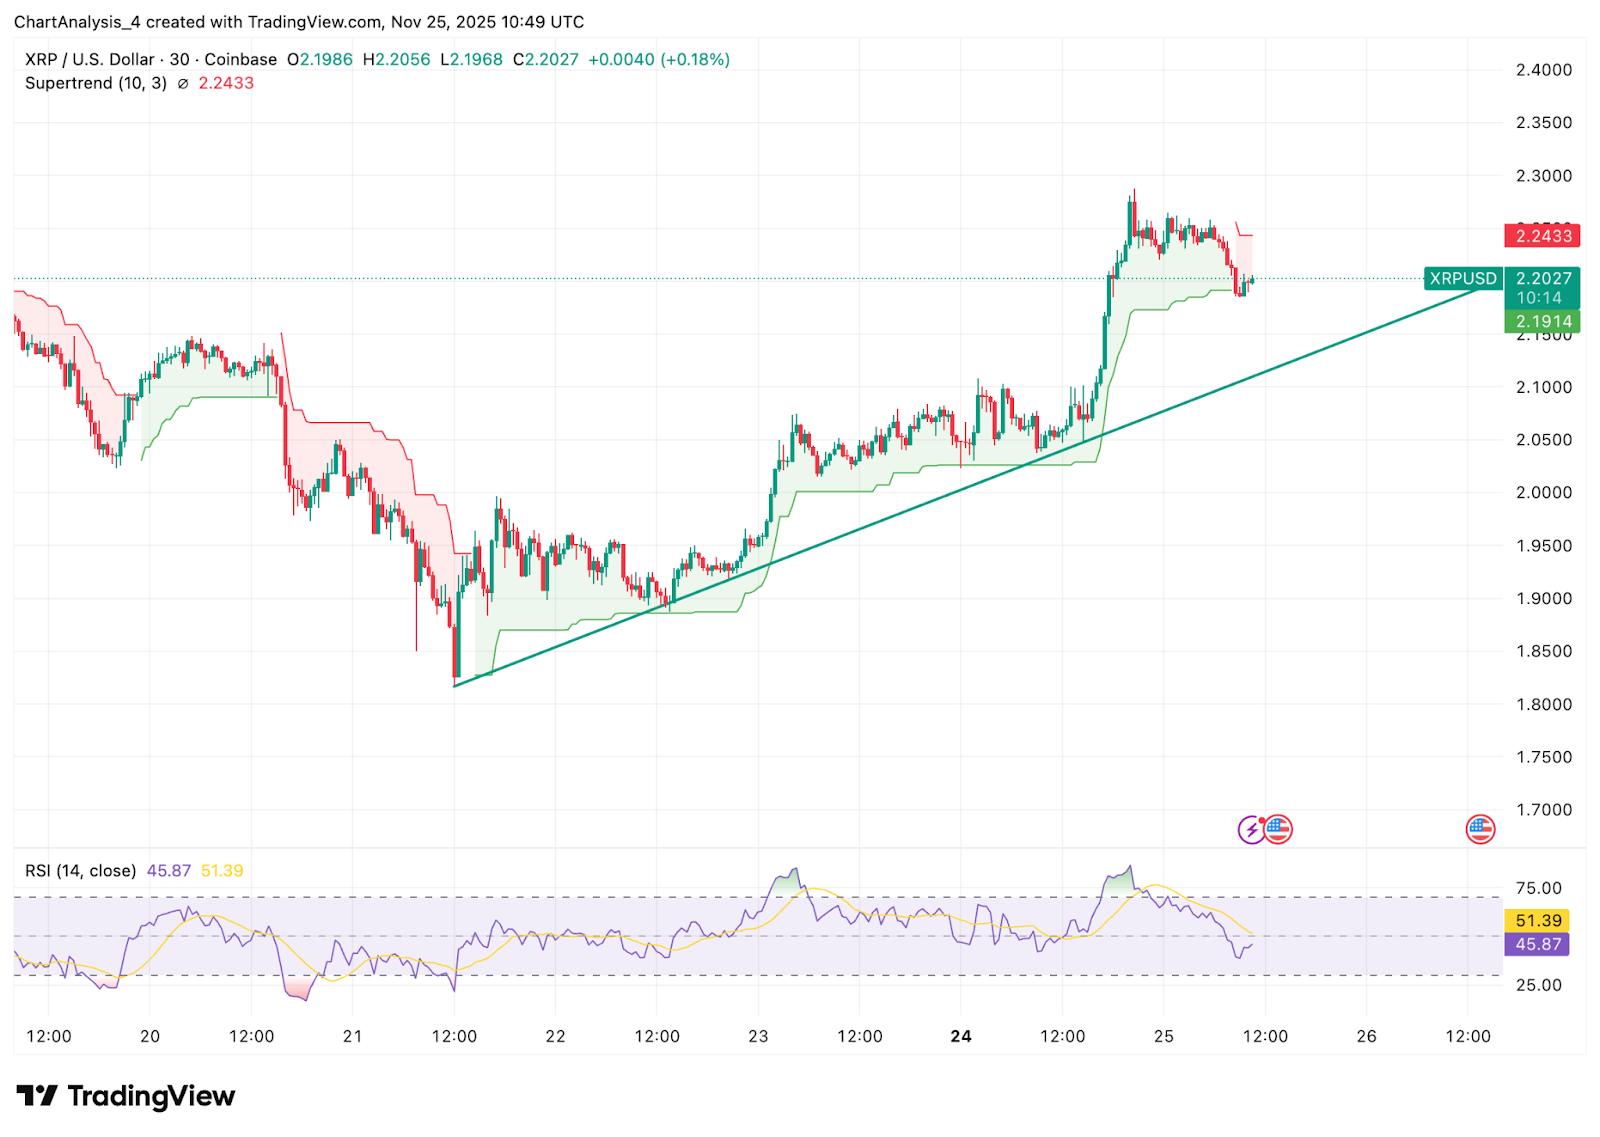
The 30 minute chart reveals the first signs of intraday strength after several days of heavy pressure. Price is riding an ascending trendline that began near $1.90 and has formed a series of higher lows.
Supertrend support sits at $2.19, and price is holding just above it. This creates a short term bullish structure even though higher timeframes remain bearish. The RSI has cooled from overbought readings and now sits near 51, showing balanced momentum as traders position for the next move.
Related: Ethereum Price Prediction: ETH Struggles in Downtrend While BitMine Grows to 3% Supply Share
A break above $2.24 would confirm continuation from the intraday trendline. Failure to hold the Supertrend could pull price back toward $2.10 before buyers attempt another rebound.
Open Interest Surge Shows Increased Positioning
Derivatives activity expanded sharply. Open interest jumped 12.54 percent to $4.05 billion, while trading volume rose 54.51 percent. Options activity more than doubled, with options open interest climbing 26.21 percent.
Top trader positioning remains skewed toward longs. Binance long to short ratios across accounts sit near 2.80, showing aggressive attempts to capture upside after the bounce from $1.88. This imbalance can amplify volatility if price moves against crowded long exposure.
The rise in open interest suggests new positions rather than position reduction. When OI expands during a rebound inside a downtrend, the market often faces sharp reactions near resistance. The descending trendline near $2.29 to $2.38 becomes the key area where this positioning will be tested.
Outlook. Will XRP Go Up?
XRP sits at a critical pivot where short term momentum is improving but higher timeframes are still controlled by sellers.
- Bullish case: A strong close above $2.38 breaks the trendline and sends price toward $2.70. Clearing $2.52 strengthens the reversal and shifts the structure back toward a broader uptrend.
- Bearish case: A daily close below $1.88 exposes the $1.70 region and confirms continuation of the current downtrend. A failure to reclaim $2.38 keeps every bounce contained beneath resistance.
Related: Solana Price Prediction: SOL Attempts Rebound While ETF Expansion Signals Market Interest
Disclaimer: The information presented in this article is for informational and educational purposes only. The article does not constitute financial advice or advice of any kind. Coin Edition is not responsible for any losses incurred as a result of the utilization of content, products, or services mentioned. Readers are advised to exercise caution before taking any action related to the company.


