
- XRP price today trades near $2.50, rallying more than 5 percent after nine XRP spot ETFs appeared on DTCC listings.
- Despite the surge, XRP remains capped by resistance at the descending trendline and EMA cluster between $2.56 and $2.65.
- A daily close above $2.65 confirms trend reversal toward $2.91–$3.20, while failure risks retrace back to $2.20 support.
XRP price today trades near $2.50, up more than 5 percent, as investors react to reports that nine XRP spot ETFs have now appeared in DTCC listings, signaling readiness ahead of possible launch approvals.
Buyers Attempt Reversal As ETF Listings Hit DTCC
ETF-related excitement gave buyers a reason to step back in. A post showing nine XRP spot ETF listings on DTCC circulated widely on social platforms, including names tied to Bitwise, CoinShares, Franklin Templeton, Volatility Shares, and Amplify.
While listing on the DTCC does not confirm launch approval, it does signal operational readiness. Historically, this type of listing has preceded ETF activations in other assets.
Buyers responded immediately on the charts. XRP jumped more than 5% but ut key resistance still lies ahead.
Trendline And EMA Cluster Still Block Reversal
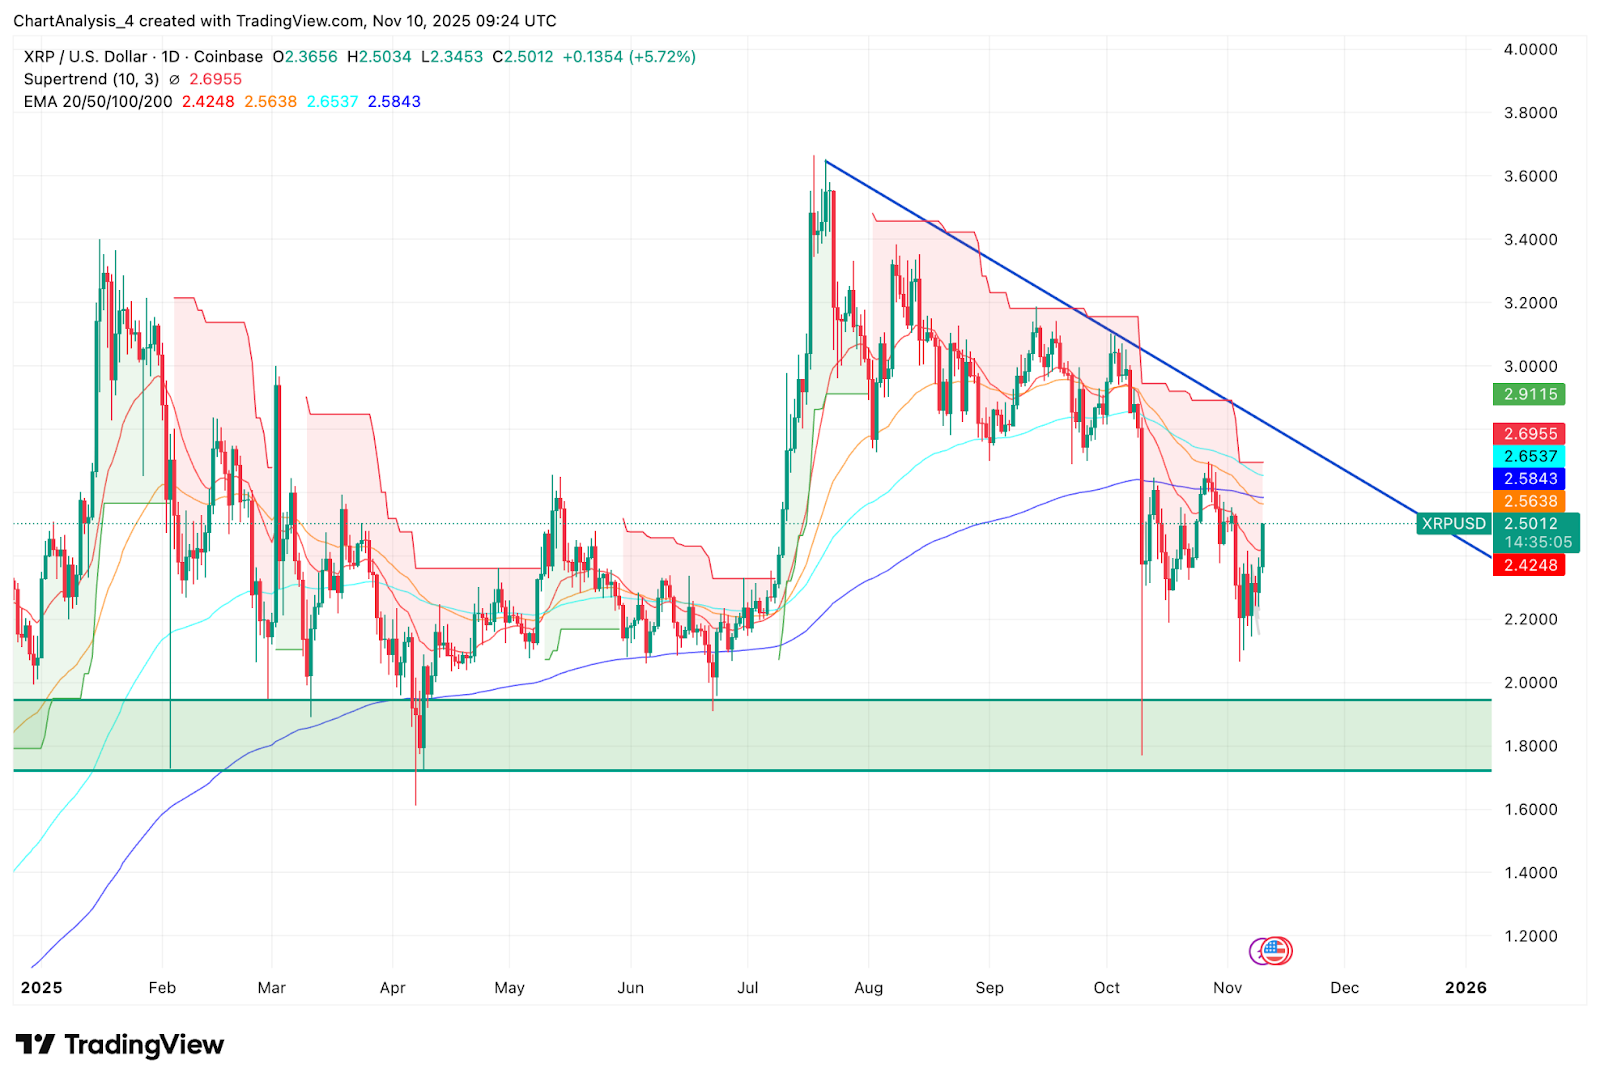
Despite the bounce, XRP remains capped by the descending trendline from the October peak.
Daily chart resistance levels:
- 20 day EMA: $2.42
- 50 day EMA: $2.56
- 100 day EMA: $2.65
- 200 day EMA: $2.58
The EMA cluster between $2.56 and $2.65 has rejected every breakout attempt since early October. Price will need a close above this band to confirm a trend reversal.
The Supertrend indicator remains red, reinforcing seller control until a breakout occurs. The trendline and EMAs converge around $2.65, making that level the key barrier. Above $2.65, the structure shifts decisively bullish.
Spot Flows Still Show Net Distribution
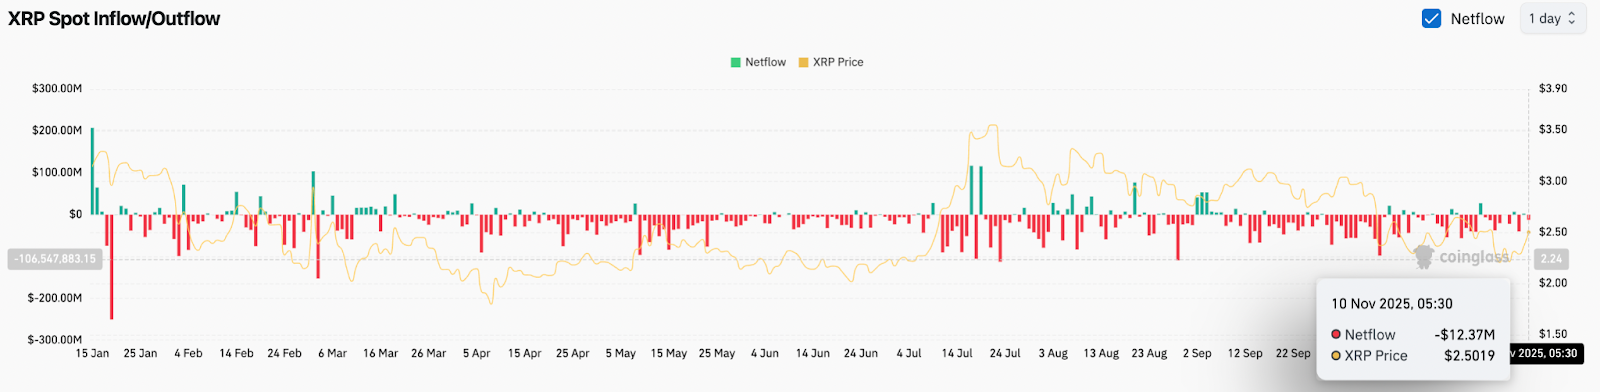
Despite today’s price jump, exchange flows tell a cautious story.
CoinGlass data shows:
- Net flows today: -$12.37 million
This means more XRP is entering exchanges than leaving, which generally supports selling pressure. Spot flows have shown persistent distribution throughout October and early November, matching the corrective trend on the chart.
Until net flows flip positive, rallies are more likely to face profit taking near resistance.
Bulls Need A Break Above $2.65 For Trend Shift
The breakout checklist is clear:
- Break descending trendline
- Close above the EMA cluster between $2.56 and $2.65
- Supertrend flips to green on daily timeframe
If those conditions trigger, XRP opens the door to $2.91, which represents the prior swing high and first major target after trend confirmation.
Outlook. Will XRP Go Up?
XRP is setting up for a decisive move. The ETF catalyst has given bulls fresh momentum, but technical barriers still determine the outcome.
- Bullish case: A daily close above $2.65 confirms the breakout and opens a move toward $2.91, then $3.20 if ETF flows push sustained demand.
- Bearish case: Failure at the trendline sends price back to $2.20, with deeper retracement toward $2.00 to $1.90 if sellers return.
Disclaimer: The information presented in this article is for informational and educational purposes only. The article does not constitute financial advice or advice of any kind. Coin Edition is not responsible for any losses incurred as a result of the utilization of content, products, or services mentioned. Readers are advised to exercise caution before taking any action related to the company.


