
- XRP tests descending channel resistance at $1.40 as open interest drops 1.64% to $2.33 billion amid consolidation.
- $6.15M in ETF outflows on March 5 break multi-day inflow streak, with cumulative flows remaining at $1.25 billion.
- Volume collapses 28.30% to $3.62 billion while RSI at 47 shows neutral momentum as price attempts breakout.
XRP price today trades near $1.3985, down 0.37% after testing the upper boundary of a descending channel (purple shaded area) that has guided price lower since July 2025. The move places buyers at a critical decision point as ETF flows reverse and derivatives positioning consolidates.
Open Interest Drops 1.64% As ETF Outflows Hit $6.15M
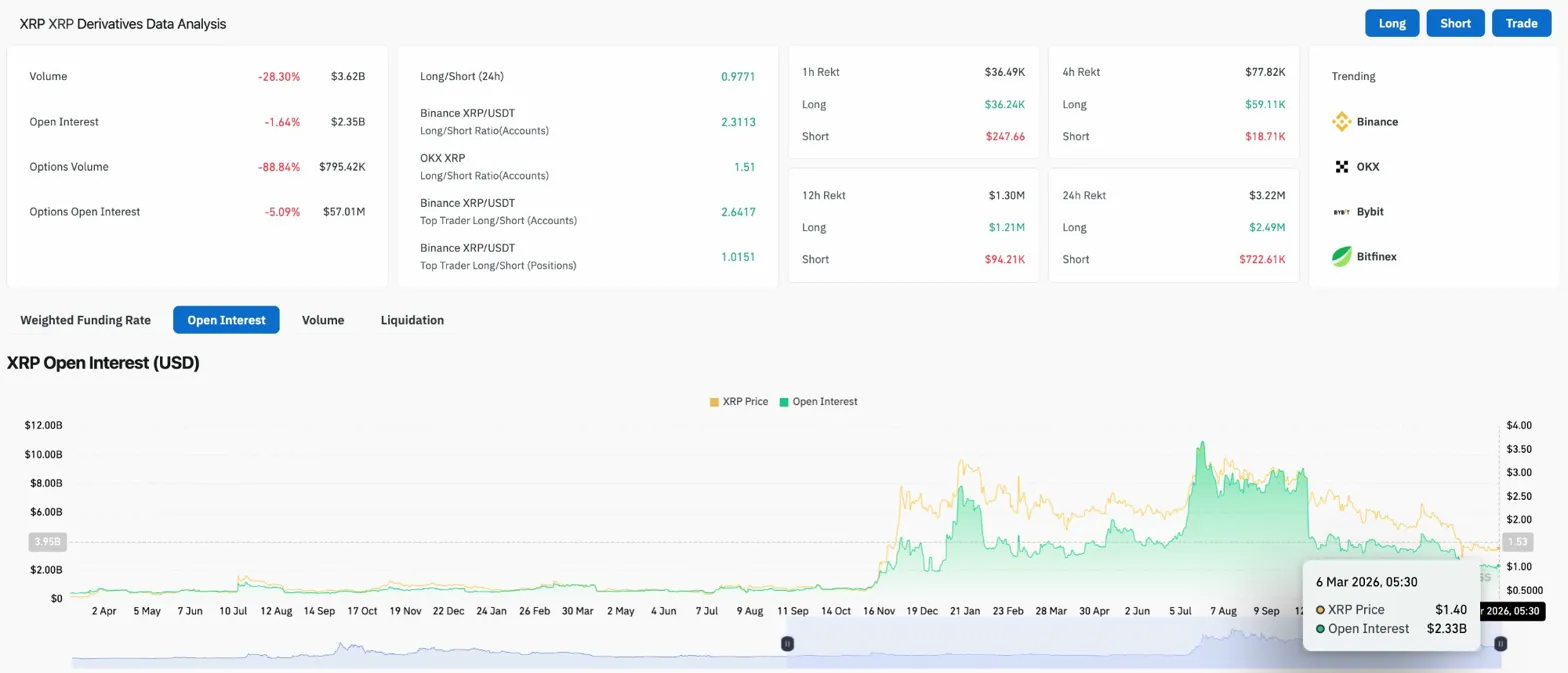
Open interest declined 1.64% to $2.33 billion while volume collapsed 28.30% to $3.62 billion, signaling reduced participation as price consolidates. The long/short ratio on Binance sits at 2.31 for accounts and 2.64 for top traders, showing leverage remains tilted bullish despite the flush.
XRP spot ETFs recorded $6.15 million in net outflows on March 5, breaking a multi-day inflow streak. The session marks the first significant institutional selling since late February, with cumulative flows holding at $1.25 billion representing 1.20% of XRP’s market cap.
Related: Ethereum Price Prediction: ETH Stabilizes After February Drop but Bears Still Control the Trend
Total liquidations hit $77.82K, with longs accounting for $59.11K. Options volume dropped 88.84% to $795.42K while options OI fell 5.09% to $57.01 million, reflecting minimal hedging activity as traders await direction.
Daily Chart Shows Multi-Month Descending Channel
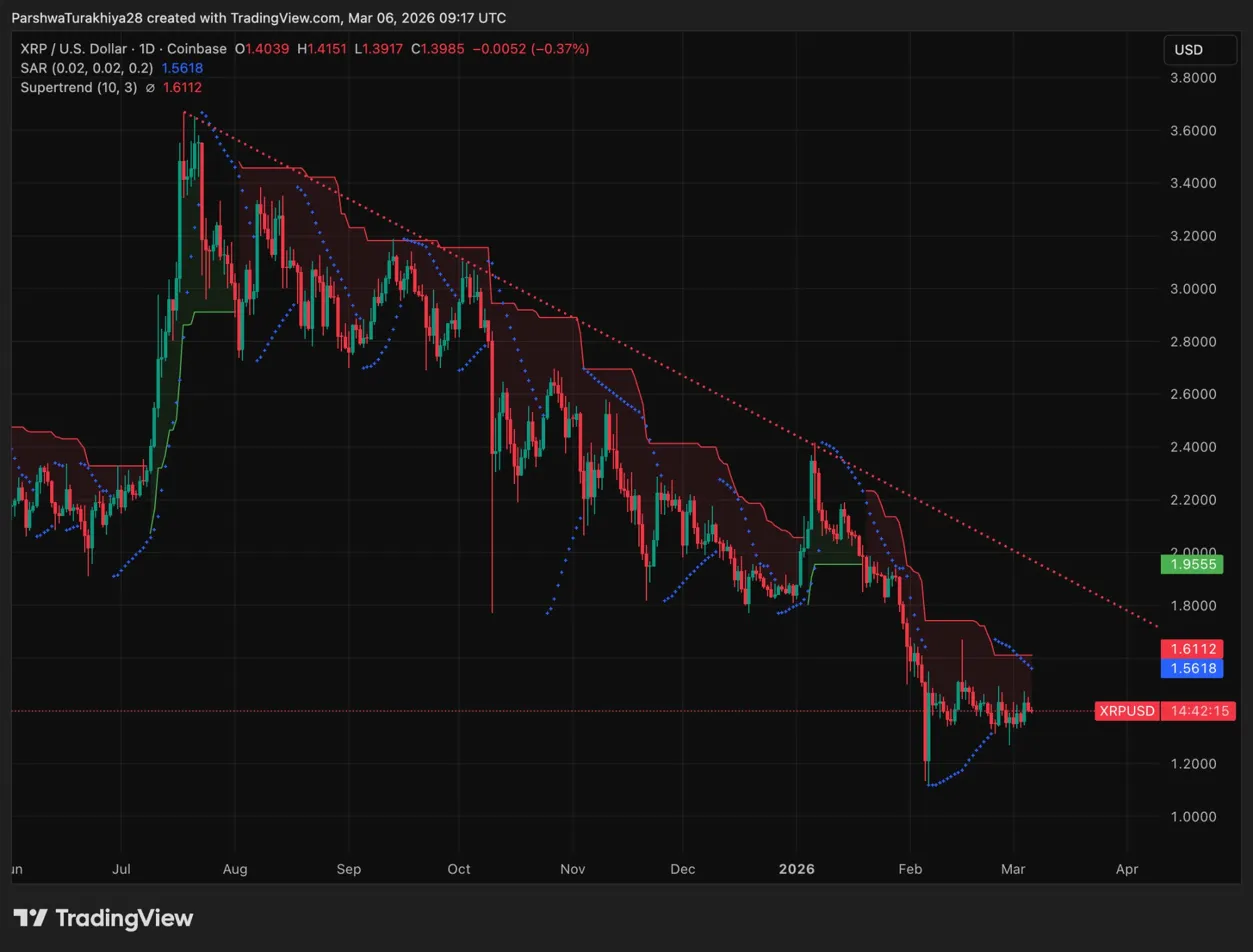
The daily chart shows XRP trapped in a descending channel since July 2025 highs near $3.70. The Supertrend at $1.6112 sits above current price, confirming bearish momentum. The Parabolic SAR at $1.5618 provides additional resistance below the Supertrend.
Price spiked to $1.1555 in late February before bouncing back toward the channel resistance. The move created a long lower wick suggesting buyers stepped in aggressively at those levels.
Key levels:
- Descending channel resistance: $1.40 to $1.45
- Supertrend resistance: $1.6112
- Parabolic SAR: $1.5618
- Critical support: $1.30 to $1.20
2-Hour Chart Shows Descending Broadening Wedge
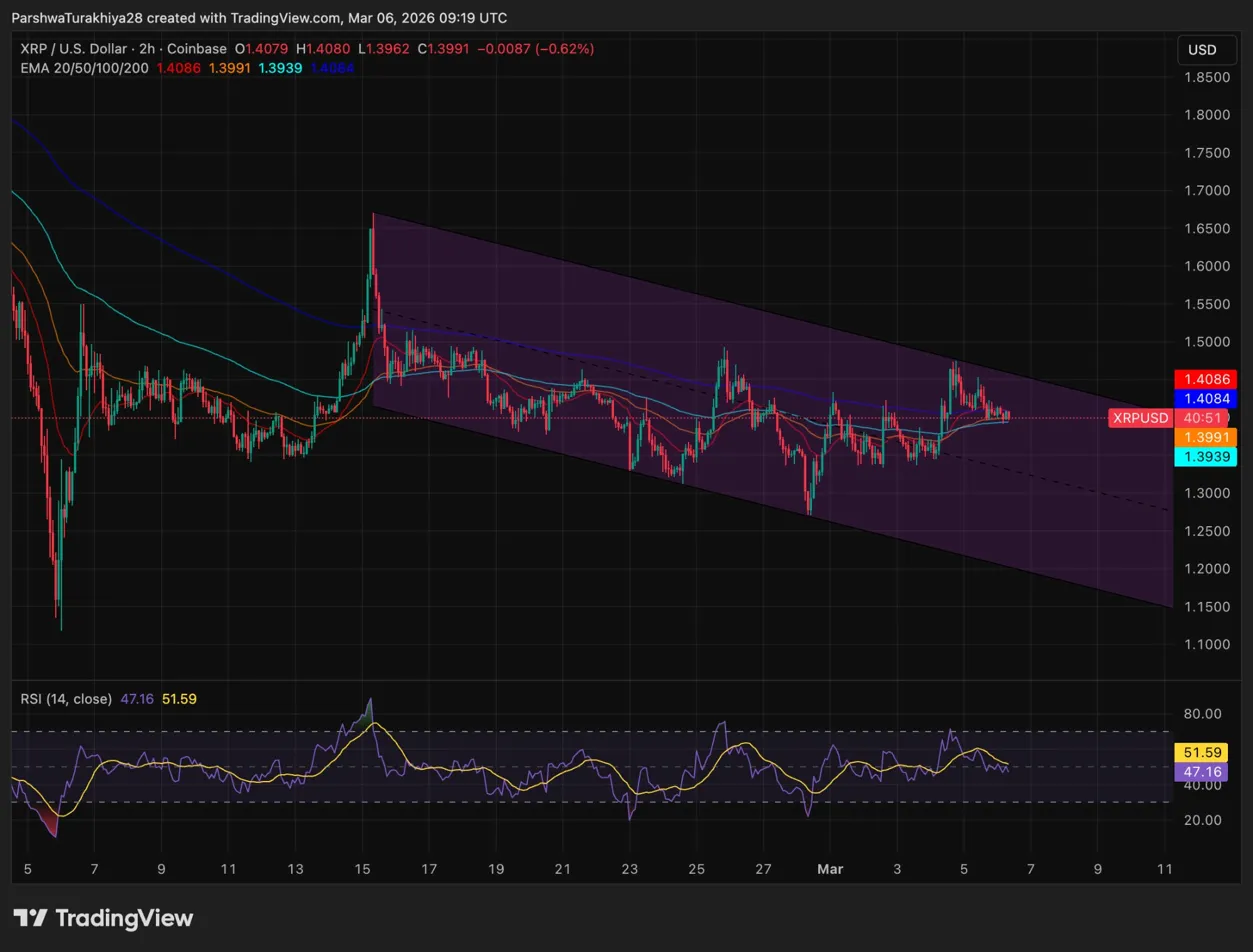
The 2-hour chart shows XRP forming a descending broadening wedge (purple shaded area) within the larger descending channel. All four EMAs are converging between $1.3939 and $1.4086, creating a resistance cluster that buyers must clear.
Related: OKB Price Prediction: OKB Eyes $128 Rally After Strong Bounce from February Bottom
The RSI sits at 47, hovering in neutral territory with room to extend higher. A break above the EMA cluster would signal momentum is shifting bullish and open the door to test the upper channel boundary.
Institutional And Supply Dynamics Show Mixed Signals
XRP has struggled to regain momentum since its July 2025 peak near $3.70, trading roughly 60% below that high as market participants debate whether current consolidation represents accumulation or downtrend continuation.
Spot XRP ETFs have accumulated approximately $1.24 billion in inflows over the past four months, while on-chain data shows large wallets adding to positions during recent dips. However, the $6.15 million outflow on March 5 suggests institutional appetite may be waning.
Derivatives activity has cooled significantly, with open interest declining sharply since late 2025 as leverage unwinds across crypto markets. Ripple re-locked 700 million XRP into escrow on March 1 as part of its routine supply management cycle, maintaining steady supply dynamics.
Outlook: Will XRP Go Up?
The next move depends on whether XRP can break above the descending channel resistance and convert the EMA cluster into support.
- Bullish case: XRP breaks above $1.4086 and the descending channel with rising volume. That opens the door to the Parabolic SAR at $1.5618 and potentially the Supertrend at $1.6112.
- Bearish case: A rejection at the channel resistance followed by a close below $1.30 exposes the $1.20 to $1.15 support zone for a retest.
Related: Solana Price Prediction: Bulls Eye $90 Breakout as ETFs Hold $1.5B Inflows
Disclaimer: The information presented in this article is for informational and educational purposes only. The article does not constitute financial advice or advice of any kind. Coin Edition is not responsible for any losses incurred as a result of the utilization of content, products, or services mentioned. Readers are advised to exercise caution before taking any action related to the company.


 Price Prediction: Canton Eyes Key Break After Market Activity Spike")

