 Price Prediction for July 10, 2025")
After months of coiling within a narrowing structure, XRP price today is once again approaching the critical resistance zone near $2.34. This area represents the upper boundary of a symmetrical triangle visible on the daily chart. Bulls are attempting to force a breakout as momentum indicators align, though volume and confirmation remain key.
What’s Happening With XRP’s Price?
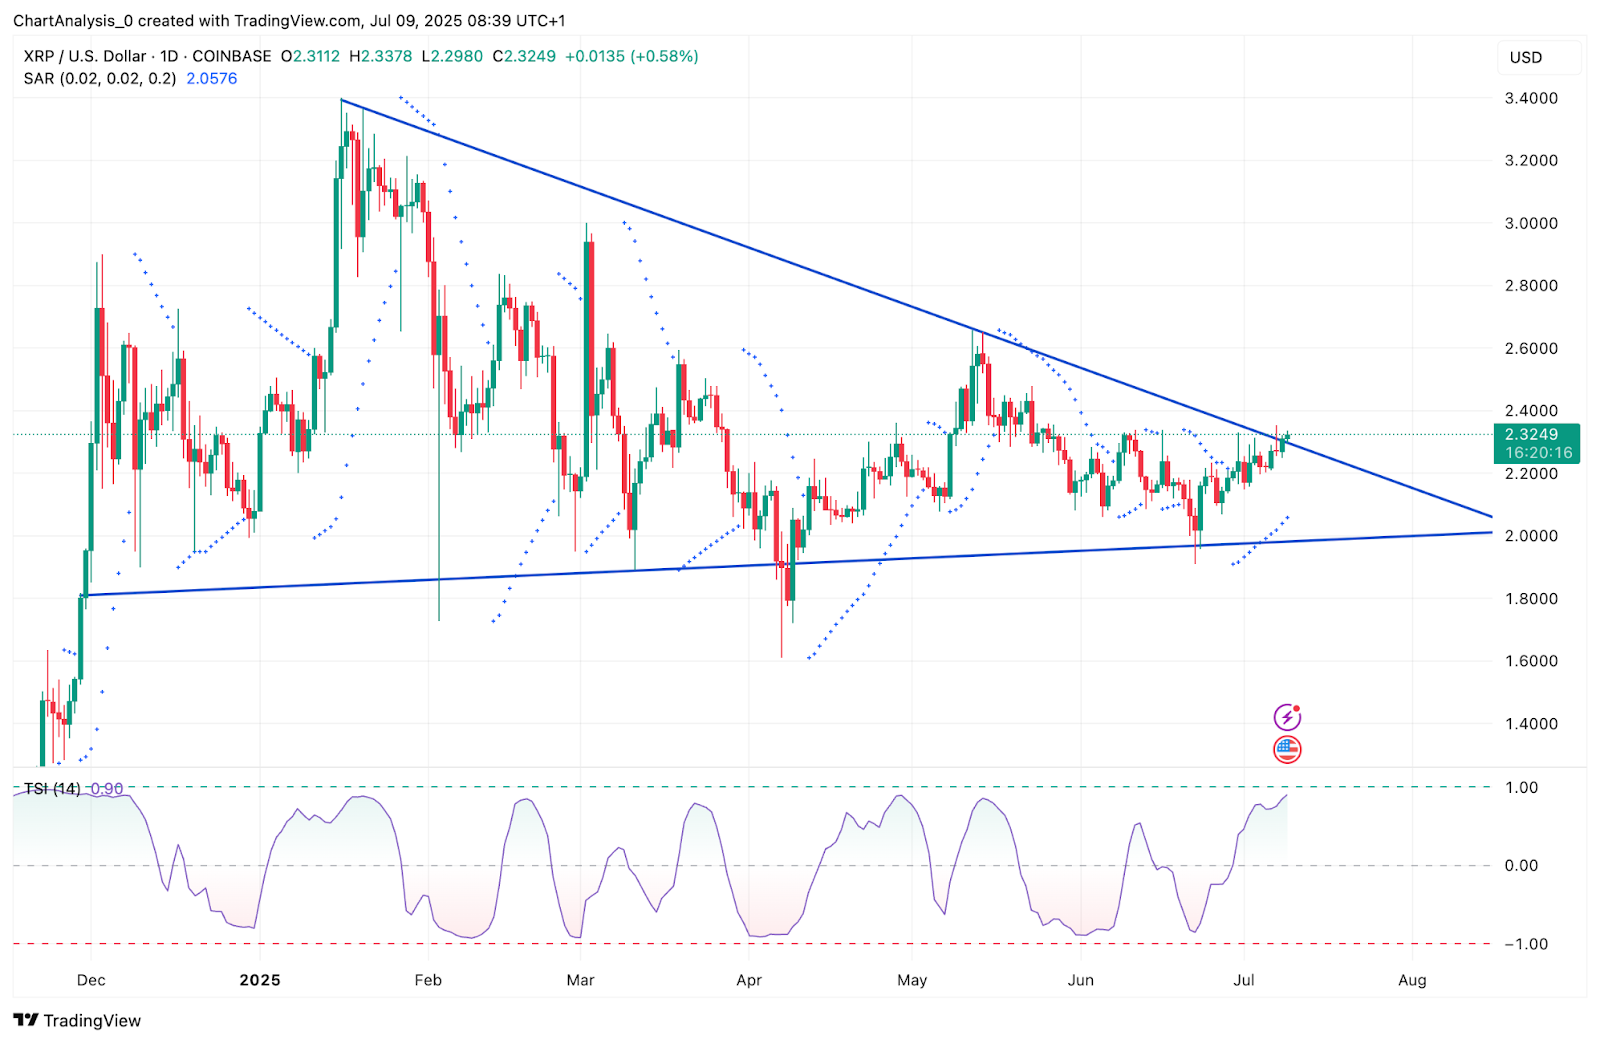
The broader XRP price action has formed a textbook symmetrical triangle since its December 2024 high. On July 9, the price hit $2.3378 and is now hovering around $2.3249. This places XRP just below the triangle’s resistance, with its ascending base still holding firm near $2.05.
The daily Parabolic SAR dots have flipped below the candles — signaling a short-term bullish shift. Meanwhile, the True Strength Index (TSI) on the daily chart is pushing higher, currently reading 0.90, suggesting building upside pressure. Traders are closely watching for a decisive candle close above the triangle edge to confirm breakout.
Why XRP Price Going Up Today?
The primary reason why XRP price going up today lies in bullish structure alignment across multiple timeframes and improving sentiment in derivatives markets.
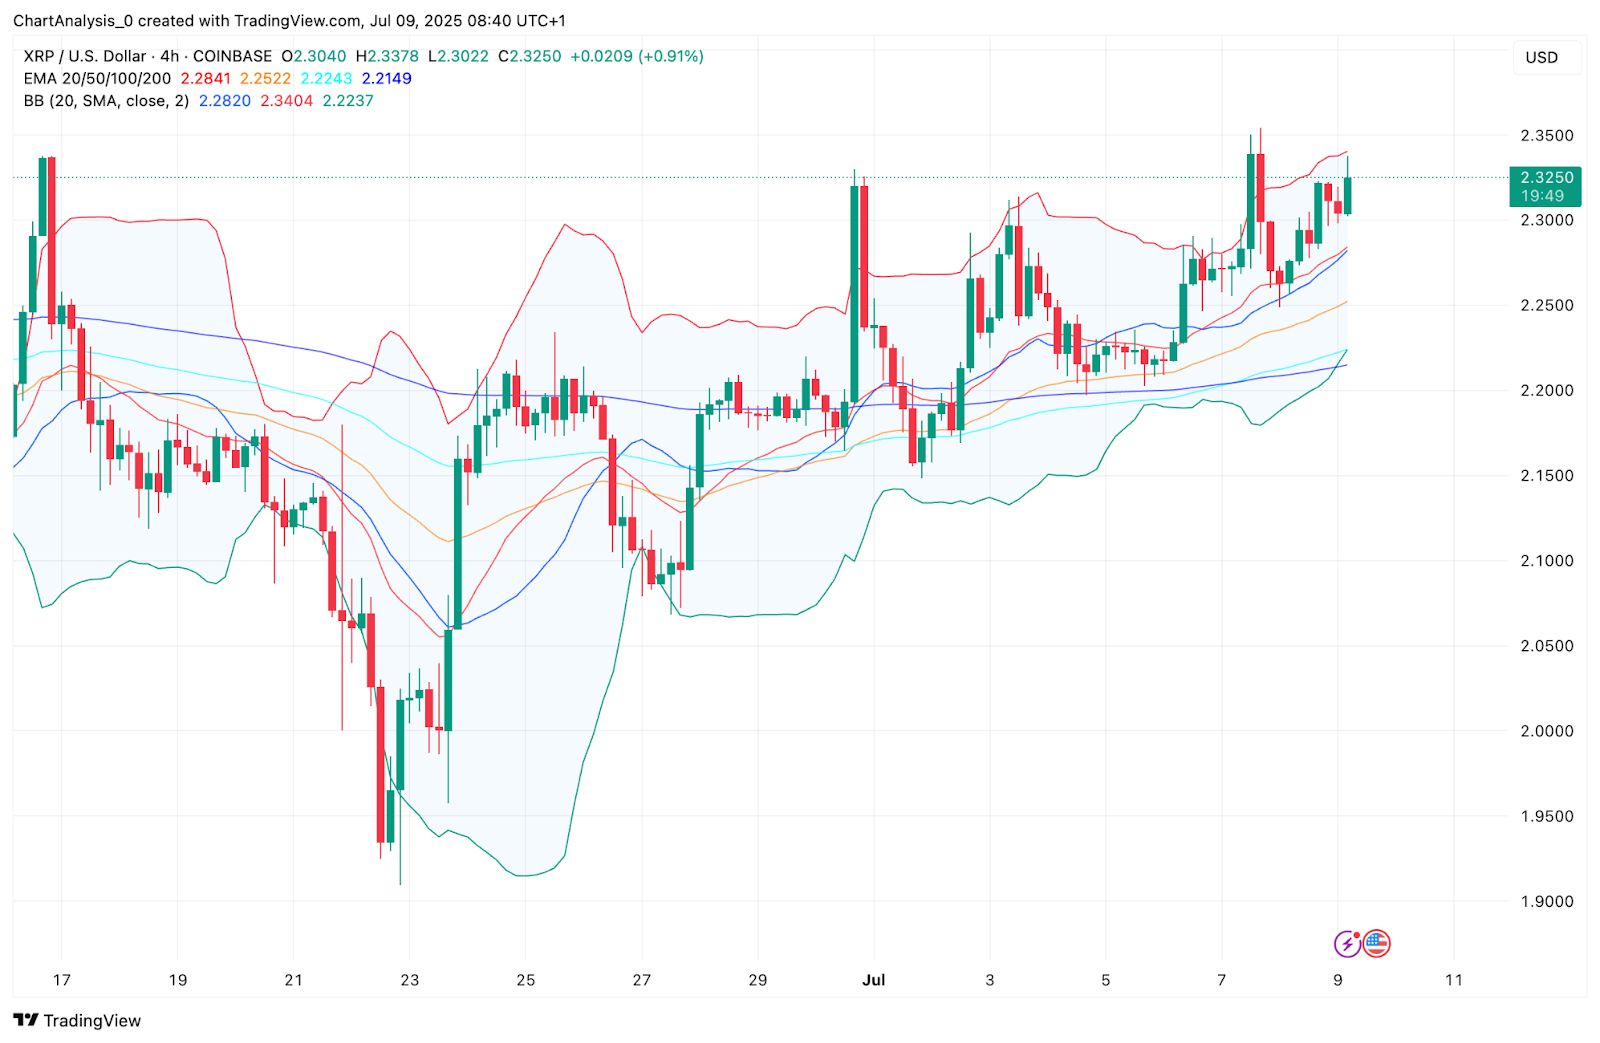
On the 4-hour chart, XRP is trading above the 20/50/100/200 EMAs, with the EMA20 near $2.28 providing dynamic support. Bollinger Bands are expanding with price currently testing the upper band near $2.34, a signal often associated with volatility breakout attempts.
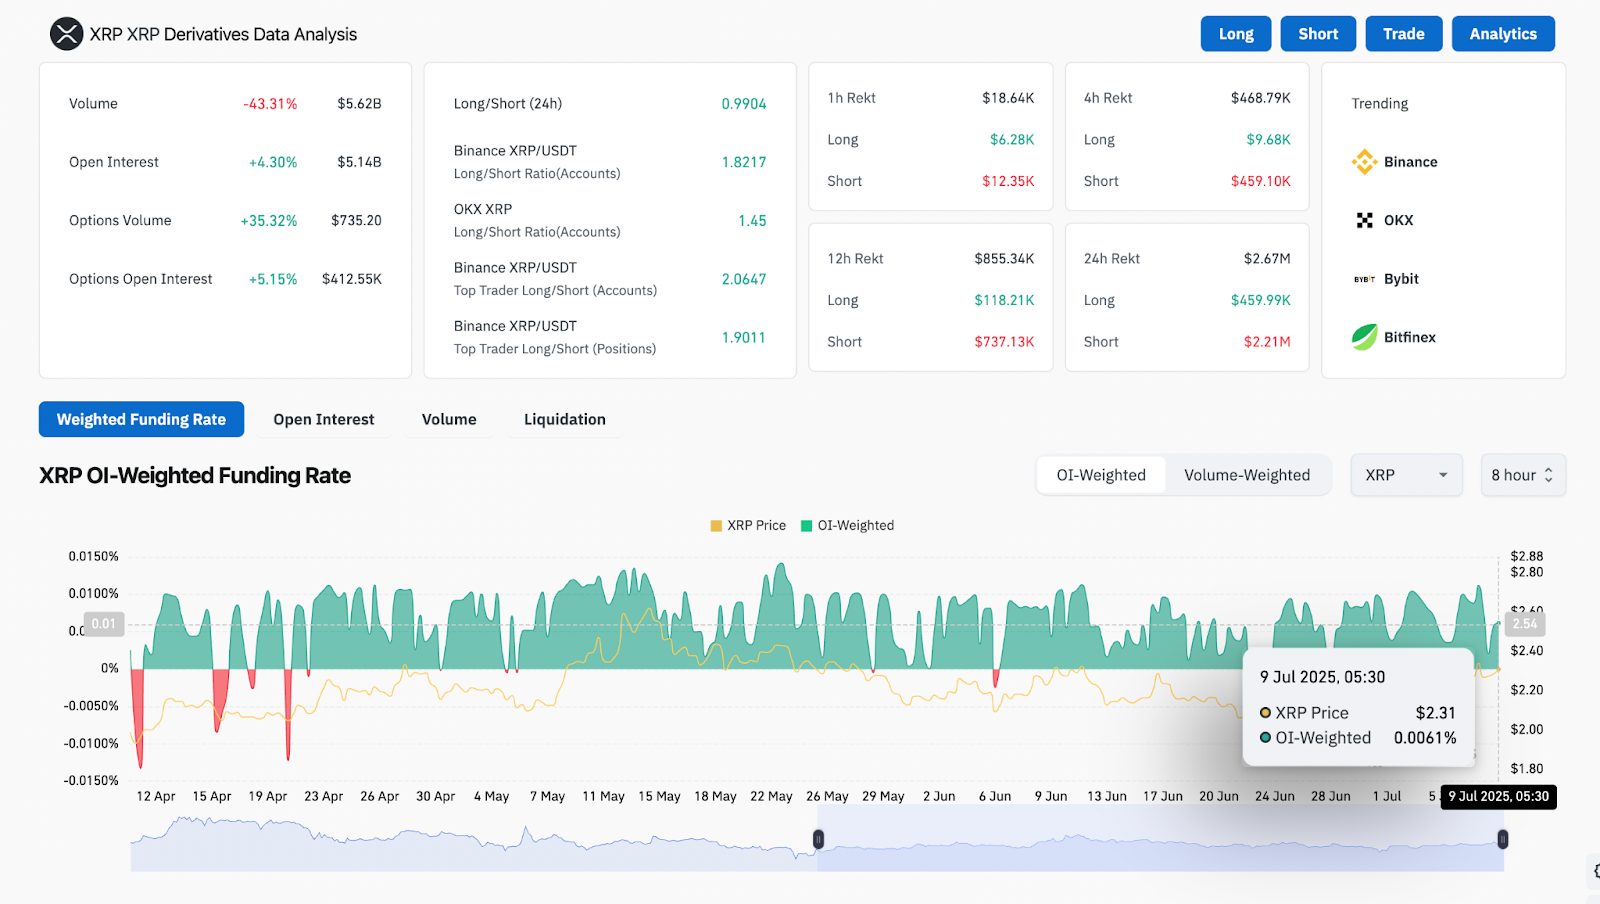
Derivatives data confirms increasing long-side appetite. Open interest has climbed by 4.3% to $5.14B while funding rates are moderately positive, showing continued demand. Long/short ratios on Binance (2.06 for top traders) further underline bullish dominance despite a 43% drop in daily volume.
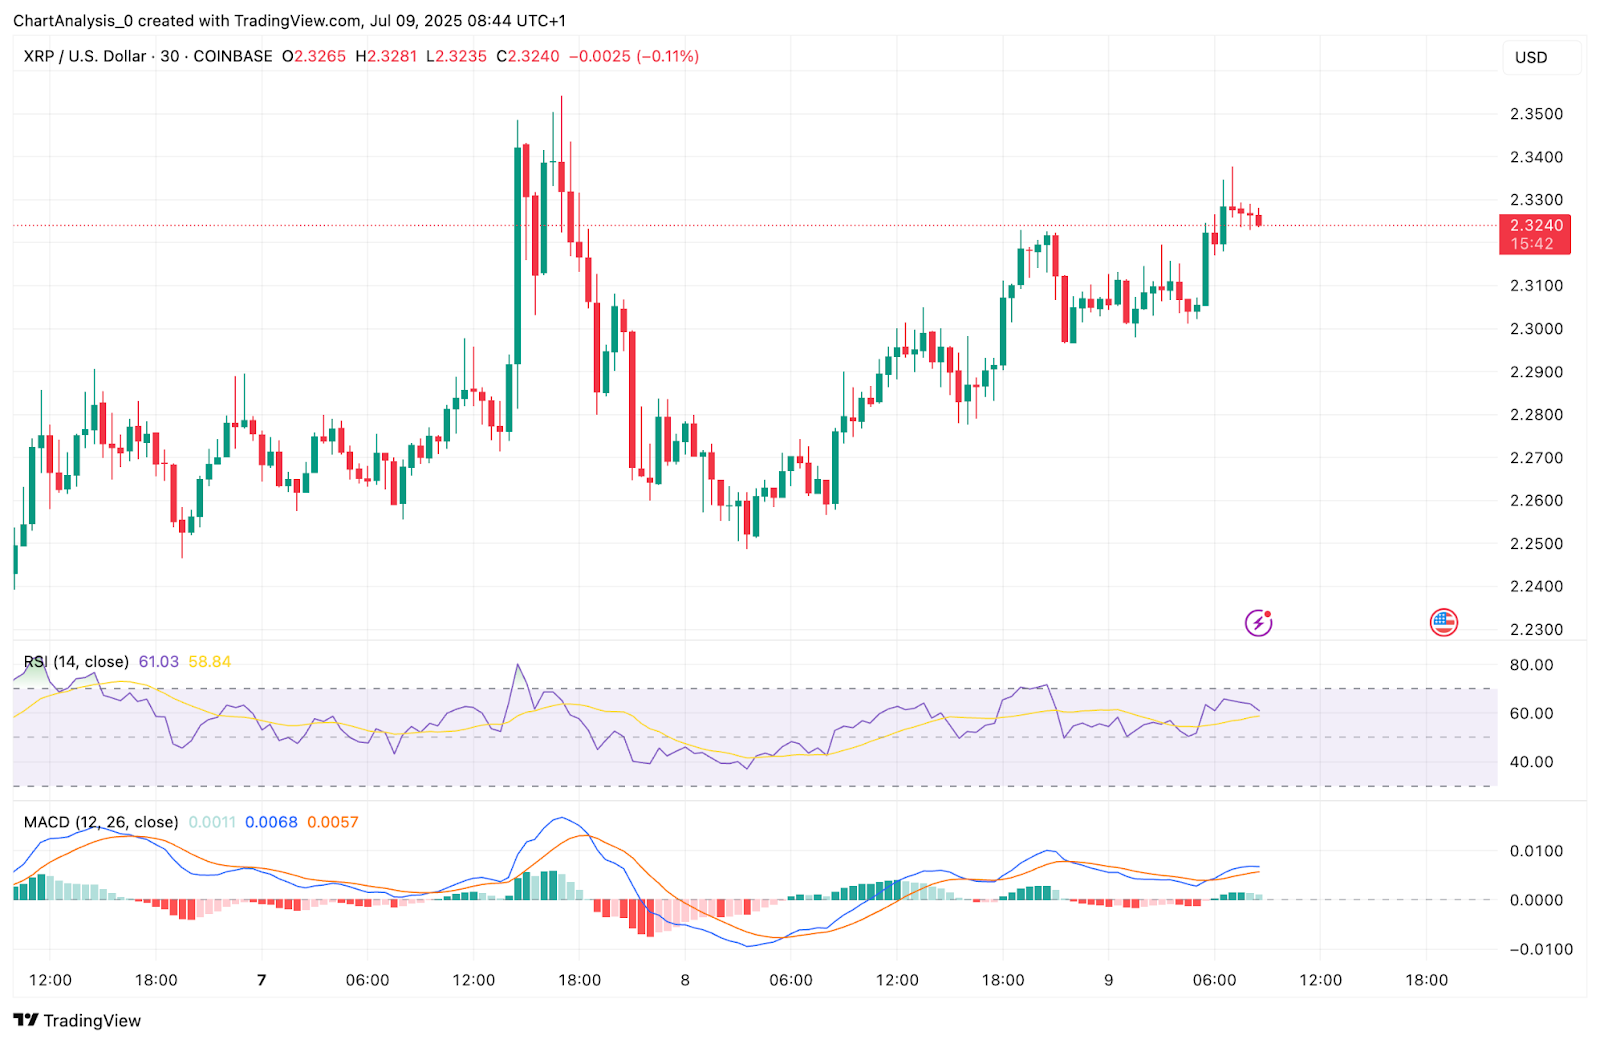
Short-term oscillators support the move. RSI on the 30-minute chart is at 61.03 and climbing, while MACD has crossed bullish with histogram bars expanding. These indicators confirm growing momentum behind the current push.
XRP Price Indicators Show Strength As Bulls Control Structure
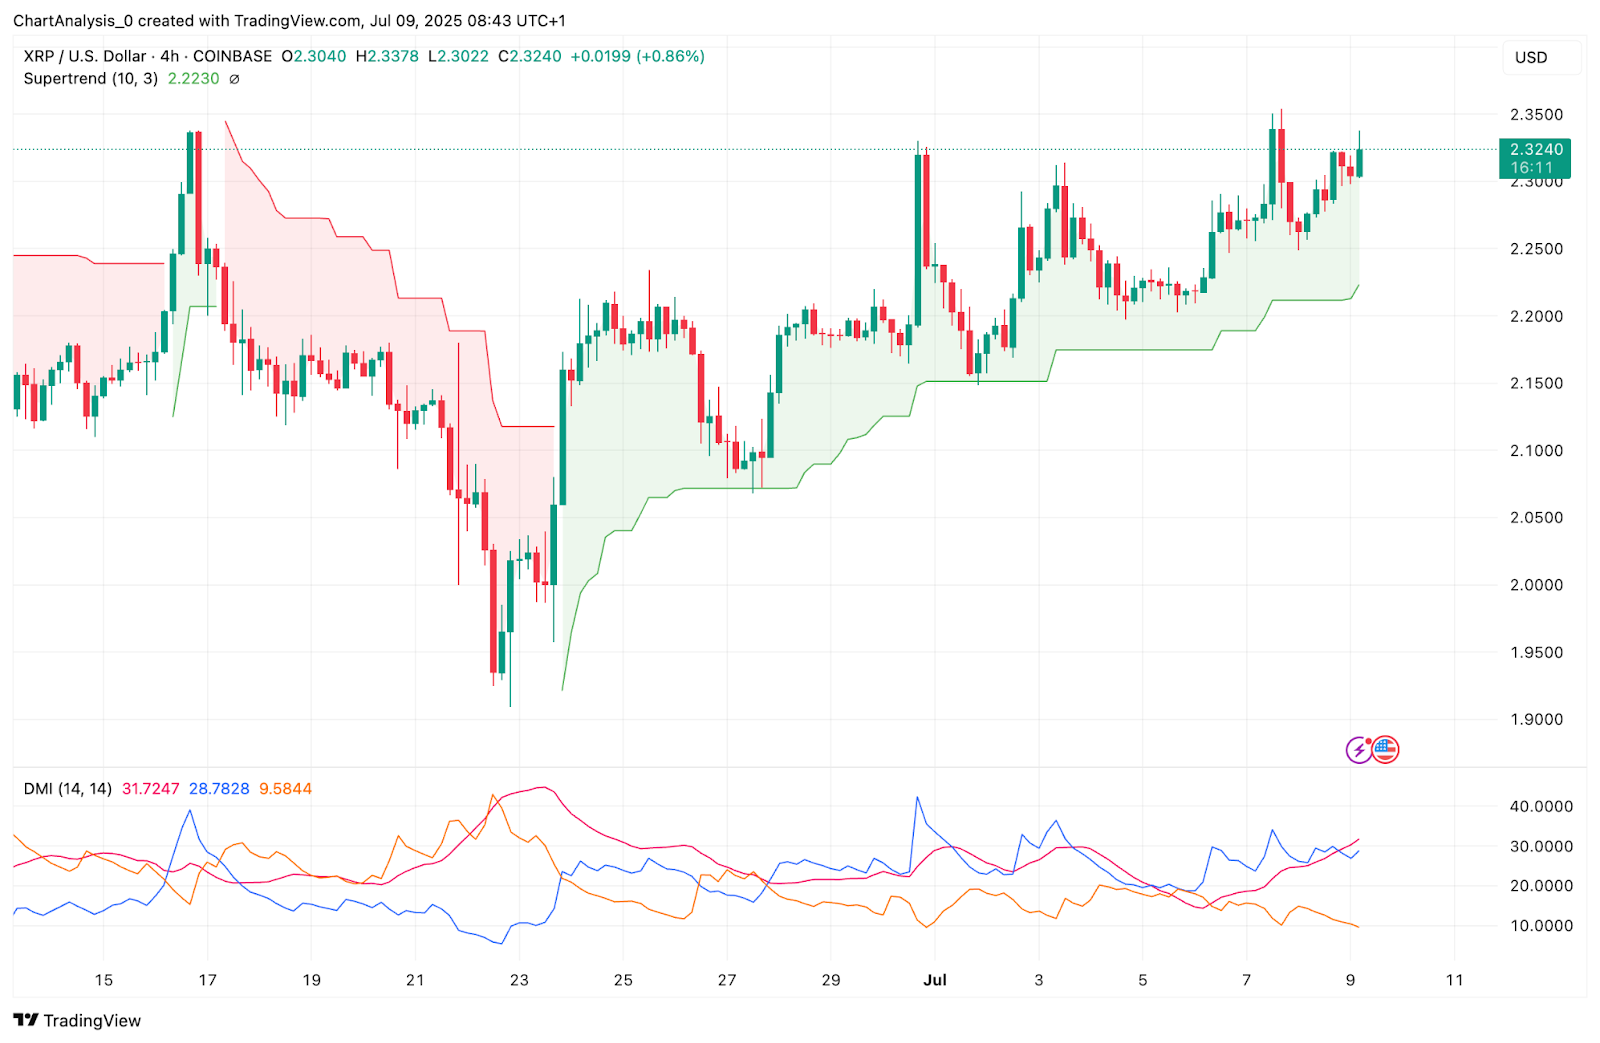
On the 4-hour Supertrend chart, XRP remains in a bullish state, with the trend flip level now at $2.22. The Directional Movement Index (DMI) supports the breakout case: +DI is leading at 31.72 while ADX reads 28.78, indicating a strengthening trend.
From a liquidity standpoint, XRP reclaimed the Point of Control near $2.22 earlier this week and has since respected it as support. This flips previous resistance into a fresh demand zone.
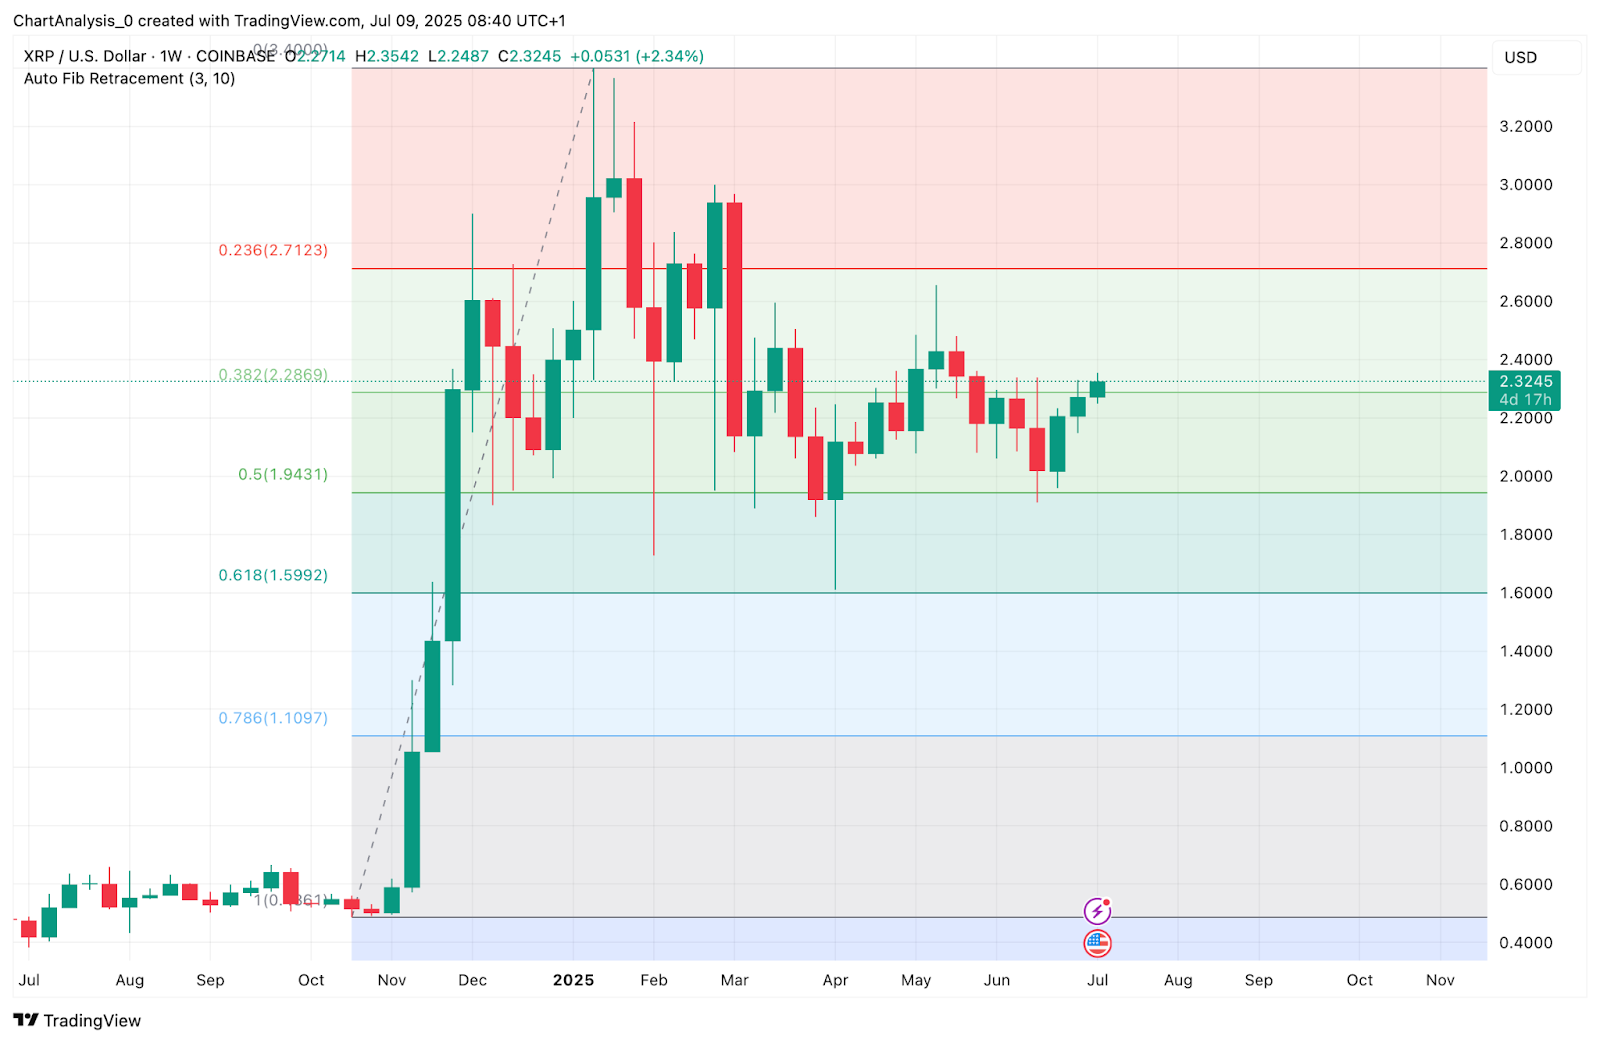
Weekly Fibonacci retracement levels add further context. XRP is currently trading above the 0.5 Fib ($1.94) and is approaching the 0.382 zone near $2.286. A close above $2.34 would open the door toward the 0.236 Fib level at $2.712.
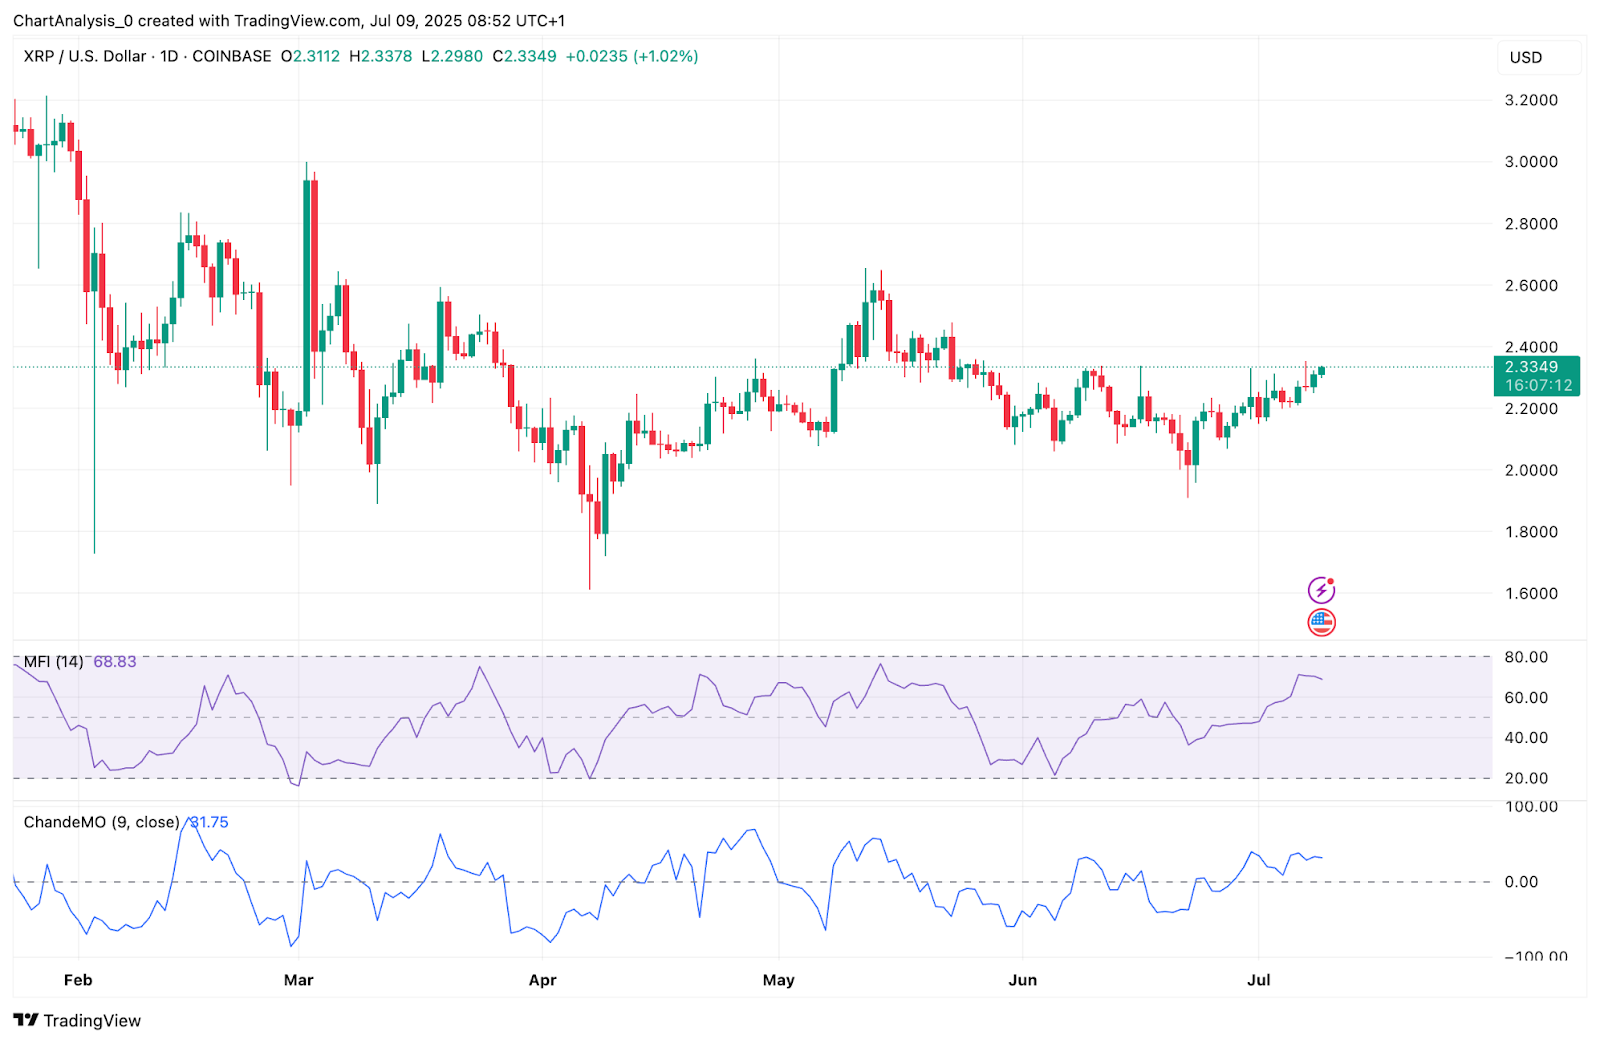
Money Flow Index (MFI) on the daily is reading 68.83, just shy of overbought while the Chande Momentum Oscillator has surged above 80. Both reflect elevated capital inflow and high short-term momentum, validating the recent price spikes.
XRP Price Prediction: Short-Term Outlook (24h)
If XRP price successfully closes above $2.34 with volume support, the next immediate target lies at $2.55, followed by a key supply zone near $2.71. This would confirm the triangle breakout and likely attract new buyers.
On the flip side, failure to break above $2.34 could result in another pullback toward $2.22, the EMA confluence and former resistance-turned-support. A breakdown below that could expose XRP to a revisit of $2.05 — the base of the triangle.
Given the bullish stacking of EMAs, rising derivatives interest, and supportive momentum indicators, the probability of a sustained upward move is increasing. However, volume remains the final arbiter for breakout validation.
XRP Price Forecast Table: July 10, 2025
| Indicator/Zone | Level / Signal |
| XRP price today | $2.3249 |
| Resistance 1 | $2.34 (triangle resistance) |
| Resistance 2 | $2.55 |
| Support 1 | $2.22 (EMA cluster + PoC) |
| Support 2 | $2.05 (triangle base) |
| Parabolic SAR (1D) | Bullish (dots below price) |
| TSI (1D) | 0.90 (rising) |
| Bollinger Bands (4H) | Expanding, upper band near $2.34 |
| RSI (30-min) | 61.03 (bullish) |
| MACD (30-min) | Bullish crossover, expanding bars |
| Supertrend (4H) | Bullish above $2.22 |
| DMI (4H) | +DI leads, ADX rising |
| MFI (1D) | 68.83 (strong inflow) |
| ChandeMO (1D) | 81.75 (high bullish momentum) |
| Derivatives OI | $5.14B (+4.3%) |
| Binance Top Traders Ratio | 2.06 (long-heavy) |
Disclaimer: The information presented in this article is for informational and educational purposes only. The article does not constitute financial advice or advice of any kind. Coin Edition is not responsible for any losses incurred as a result of the utilization of content, products, or services mentioned. Readers are advised to exercise caution before taking any action related to the company.
 Price Prediction: Weak Momentum Signals Possible Drop to $62K")

 Price Prediction for April 2026: Will Chainlink Move Higher?")
 Price Prediction: Can Bulls Sustain the $0.045 Push?")
