 Price Prediction for July 12")
XRP price today is holding above $2.55 after breaking out from a major symmetrical triangle pattern that had capped price action since March. The breakout, confirmed by volume and structure, marks a critical shift in market sentiment and places bulls in firm control ahead of the weekend.
With volume profile gaps overhead and on-chain strength showing up in derivatives flow, traders are watching closely for a continuation toward $2.70 and above.
What’s Happening With XRP’s Price?
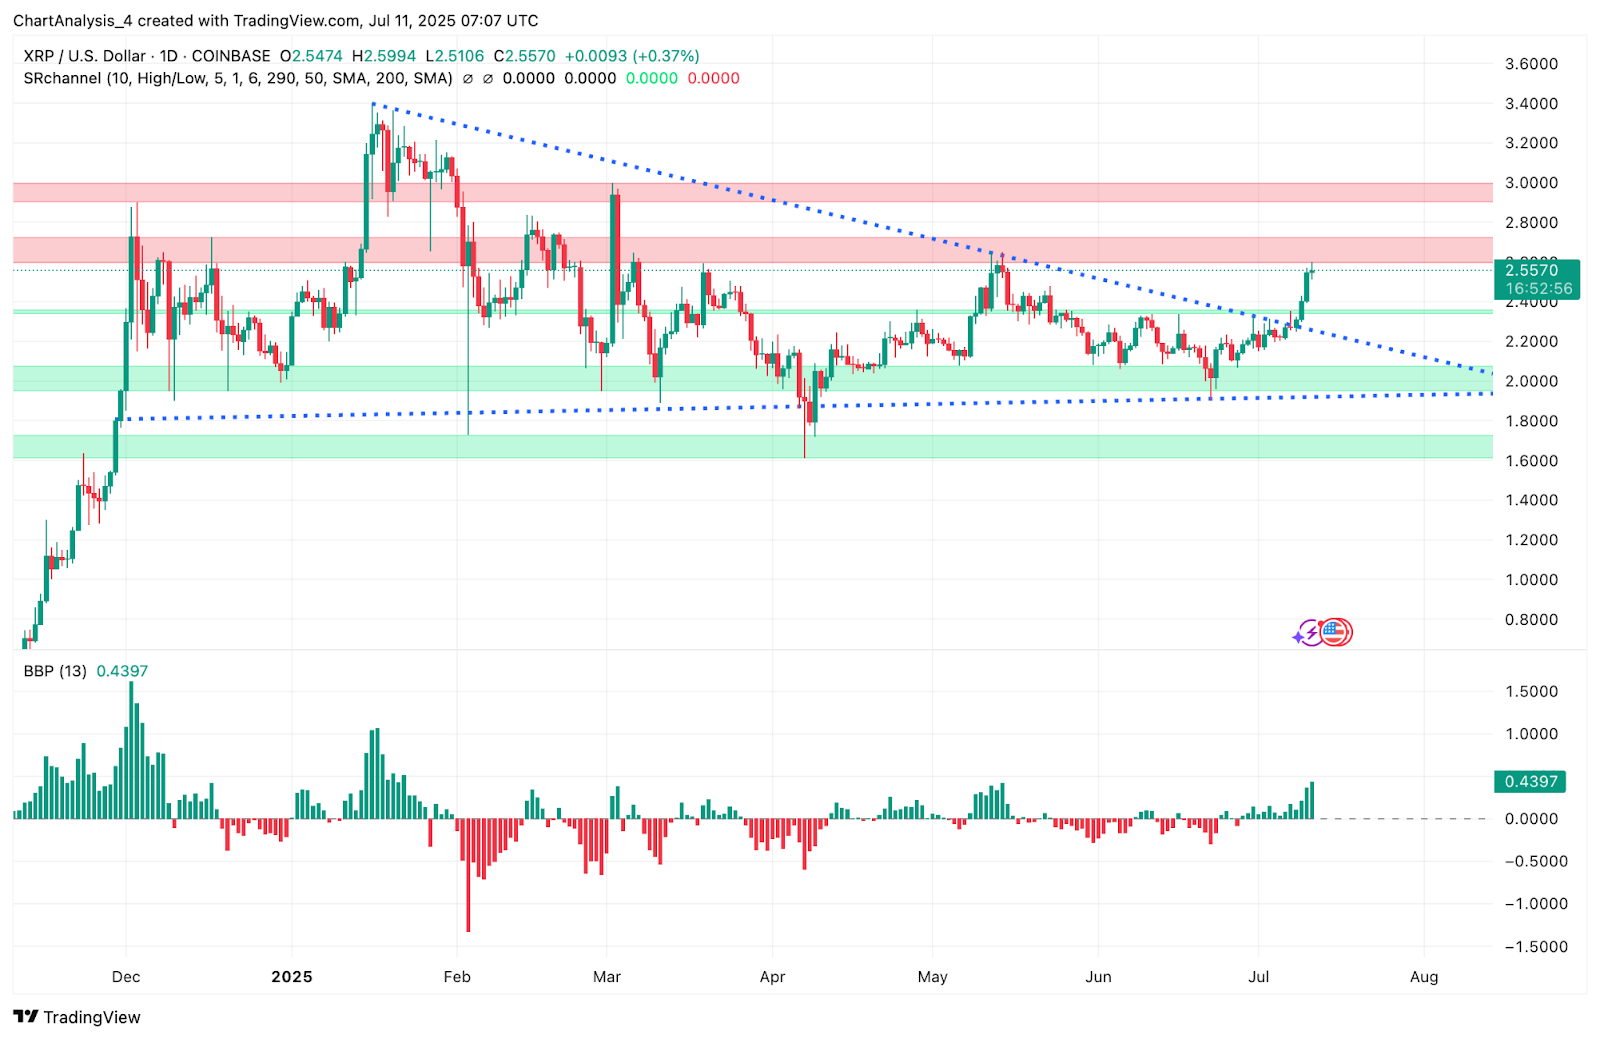
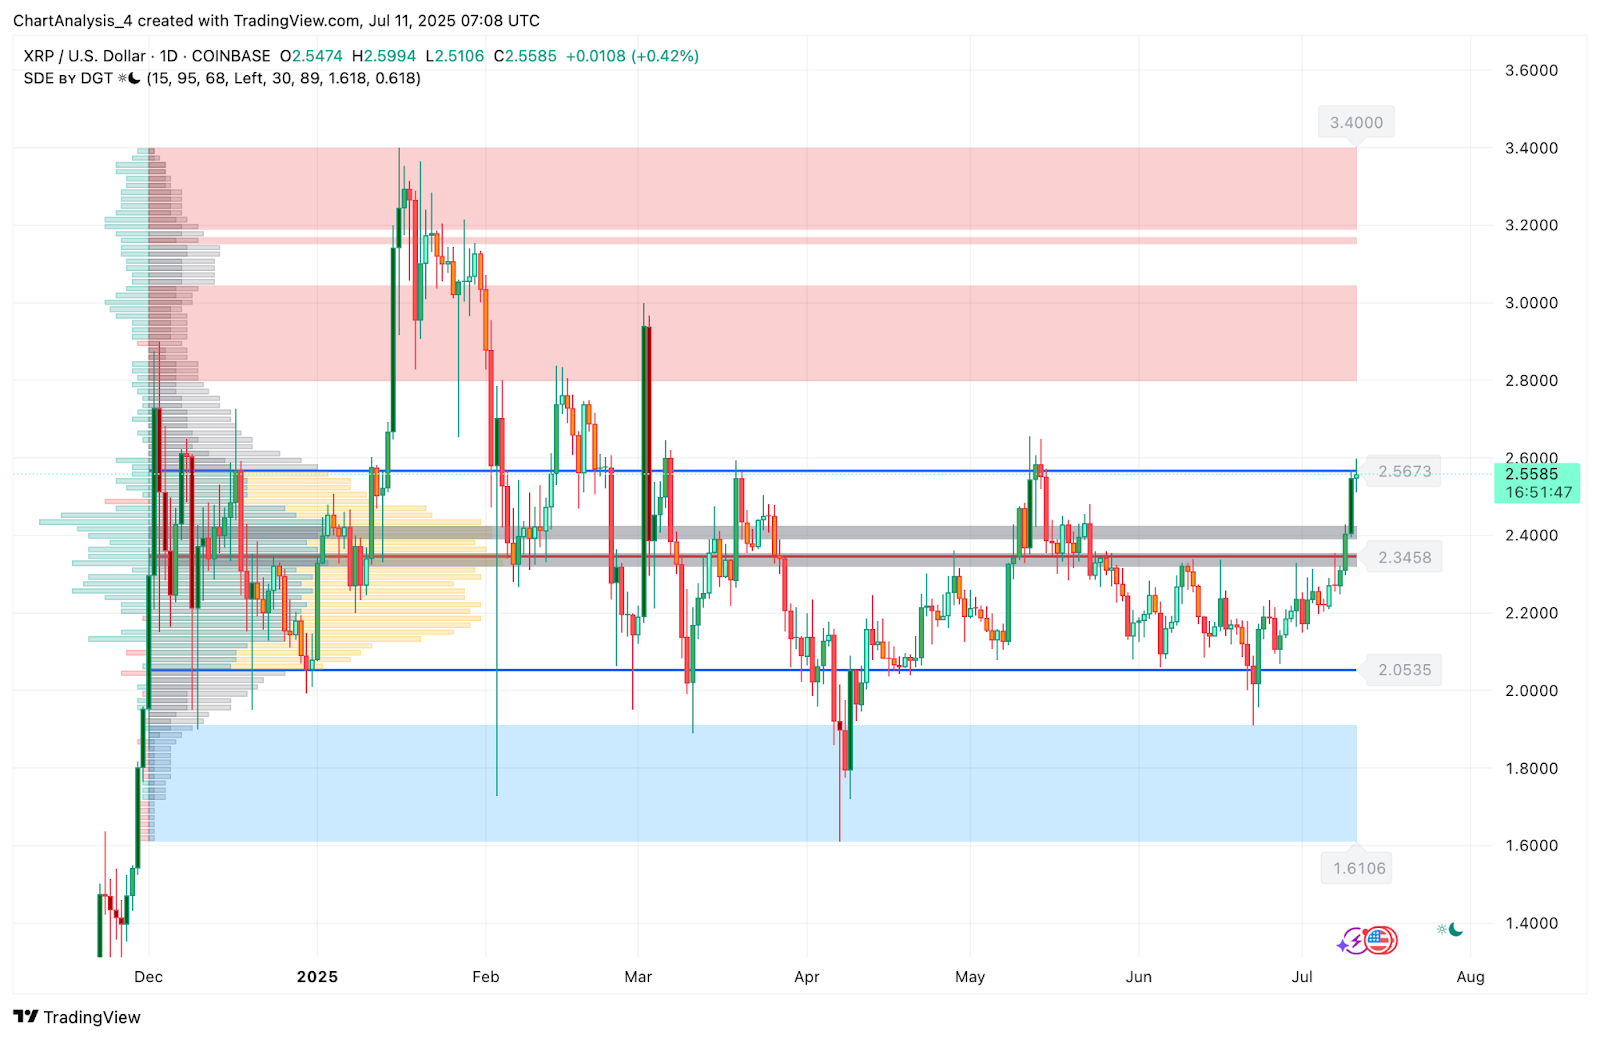
On the daily chart, XRP price has broken above a long-term descending trendline near $2.47 that acted as dynamic resistance for months. The breakout occurred on July 10 with a strong bullish candle that closed well into the $2.55 zone. Price has now cleared the midpoint of the triangle pattern that dominated most of Q2.
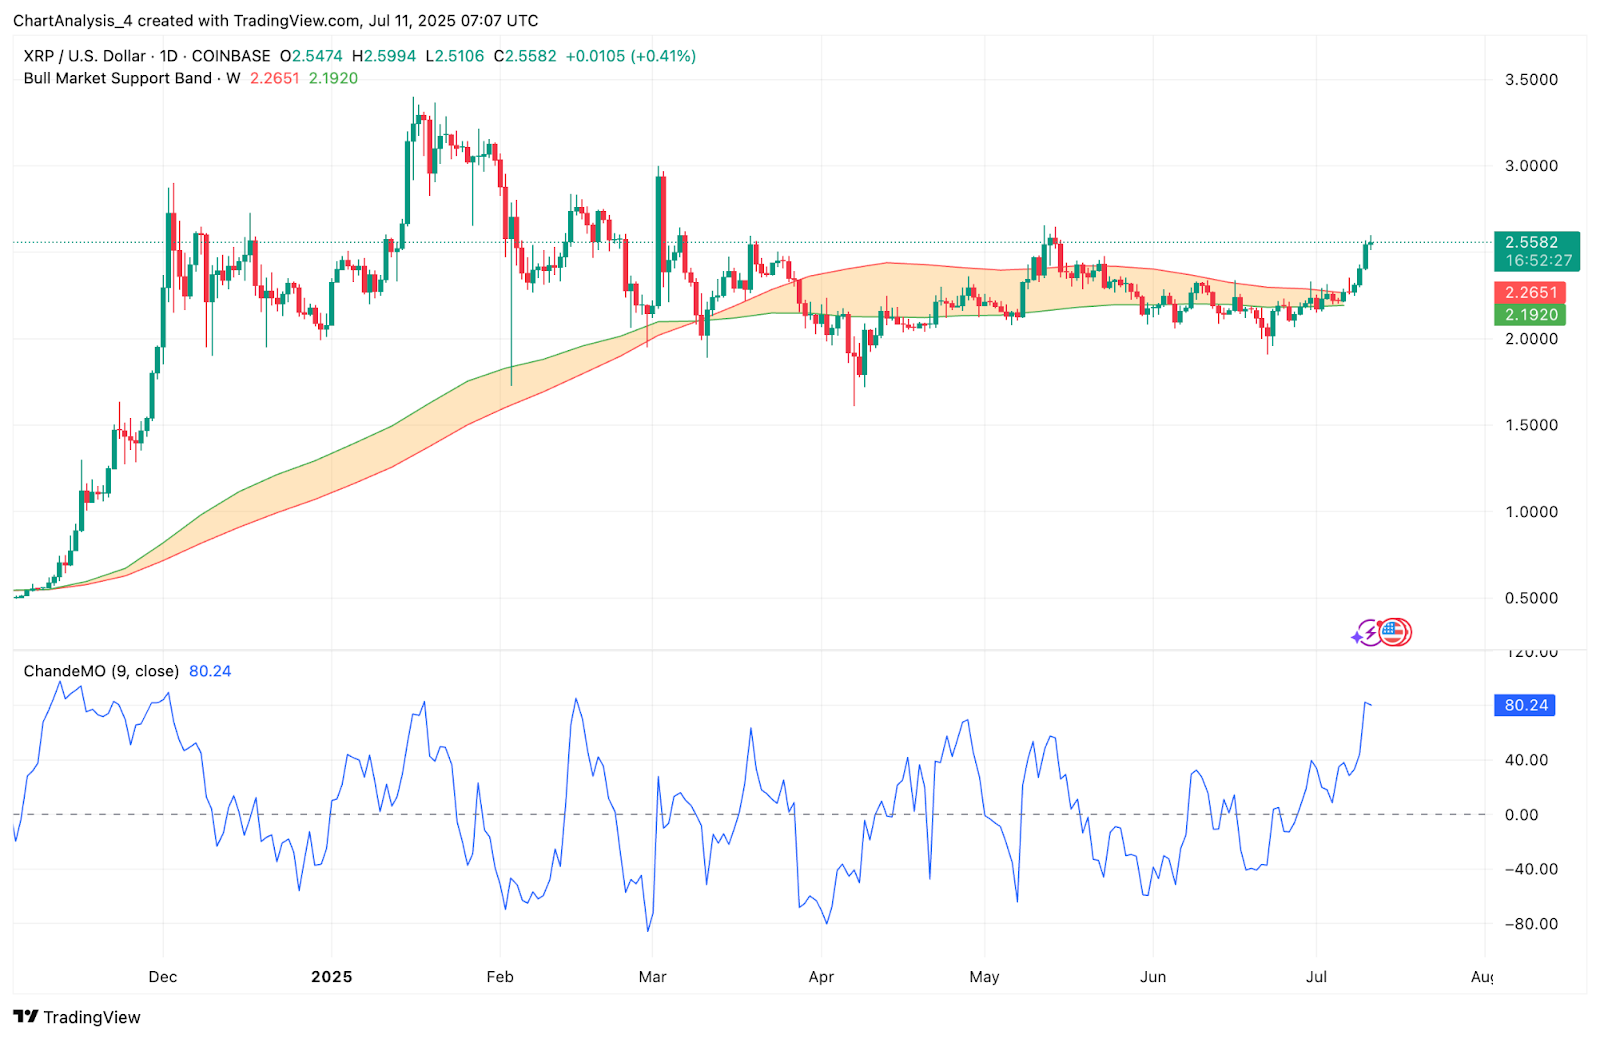
The 1D chart also shows a clean flip above the Bull Market Support Band ($2.19–$2.26), confirming broader trend reversal. Structure-wise, this move invalidates the prior series of lower highs and opens the door to target the major supply cluster between $2.71 and $2.85.
The breakout is further supported by the Chande Momentum Oscillator, which is rising strongly and currently reads 80.24, reinforcing bullish directional bias.
Why Is The XRP Price Going Up Today?
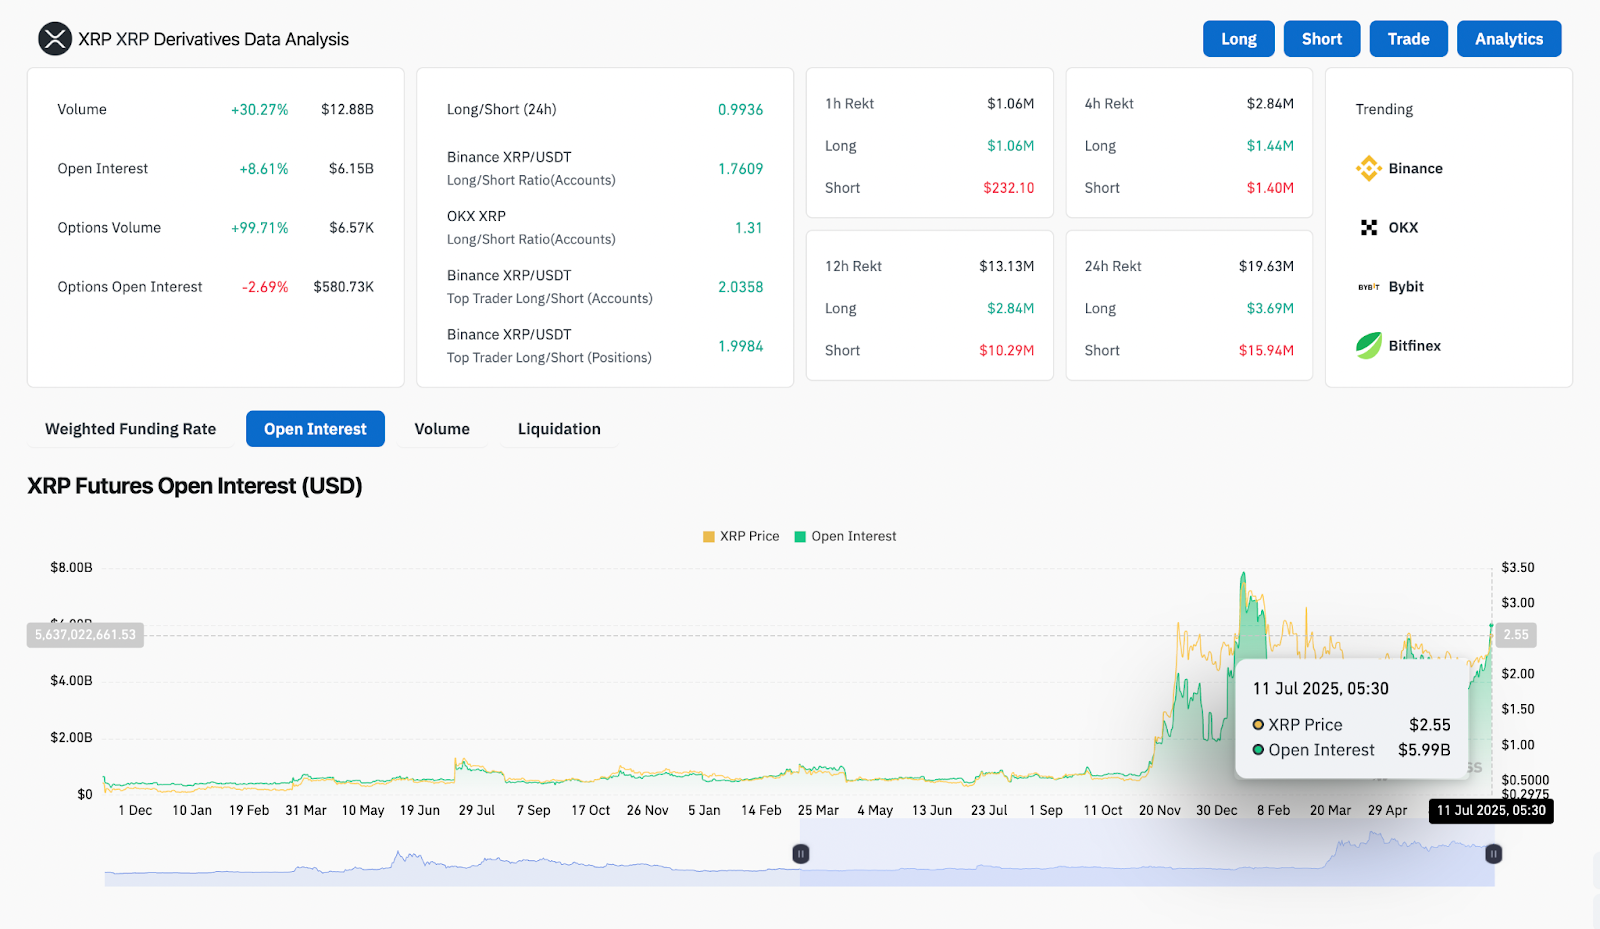
The sharp rally in XRP price is being driven by strong derivative flow and renewed institutional activity. Data from Coinglass shows:
- Open interest up by 8.61% to $6.15B
- Volume surged 30.27% to $12.88B
- Options volume exploded 99.71% to $6.57M
Meanwhile, Binance and OKX long/short ratios remain skewed in favor of bulls. Notably, top traders on Binance are holding a 2.03 long/short ratio, indicating conviction among high-volume accounts.
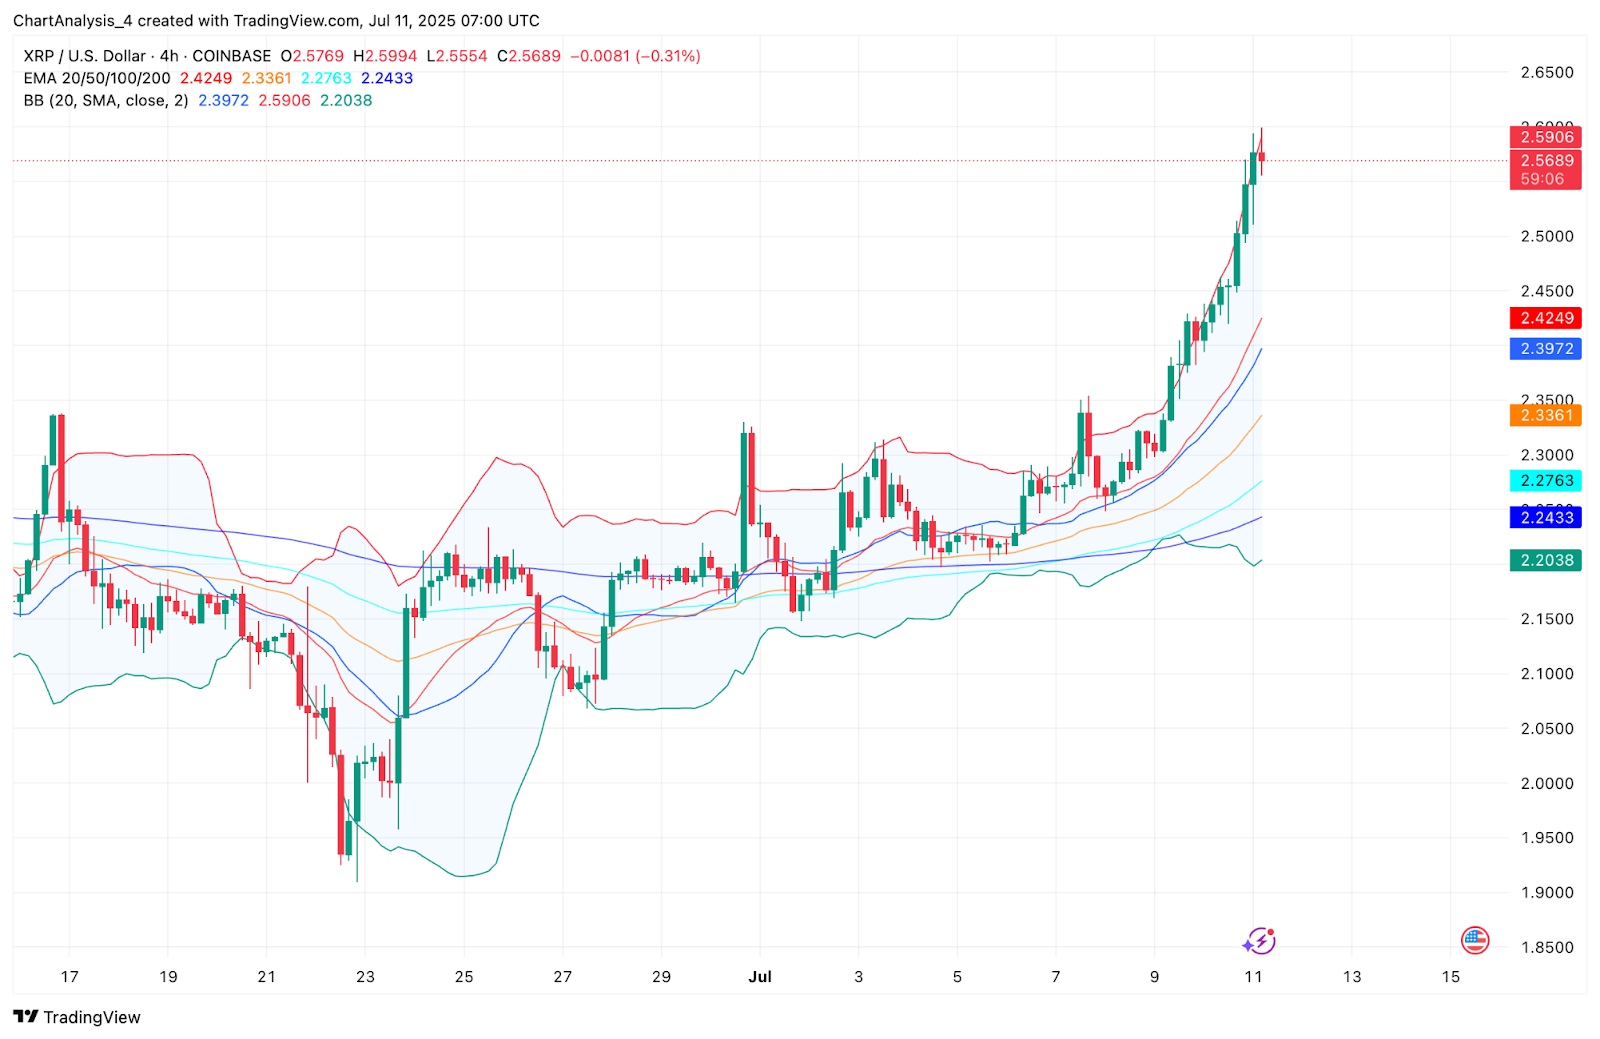
On the 4-hour timeframe, XRP price action shows acceleration through the $2.45–$2.50 resistance band, flipping it into intraday support. Bollinger Bands are expanding with price now riding the upper band at $2.59, while the EMA cluster (20/50/100/200) is stacked bullishly beneath the current price. Also the 200 EMA sits at $2.24.
Volume profile analysis also reveals a low-liquidity gap between $2.57 and $2.72, increasing the likelihood of continued upward momentum as buyers face limited resistance within that range.
XRP Price Indicators And Signals Show Strong Momentum
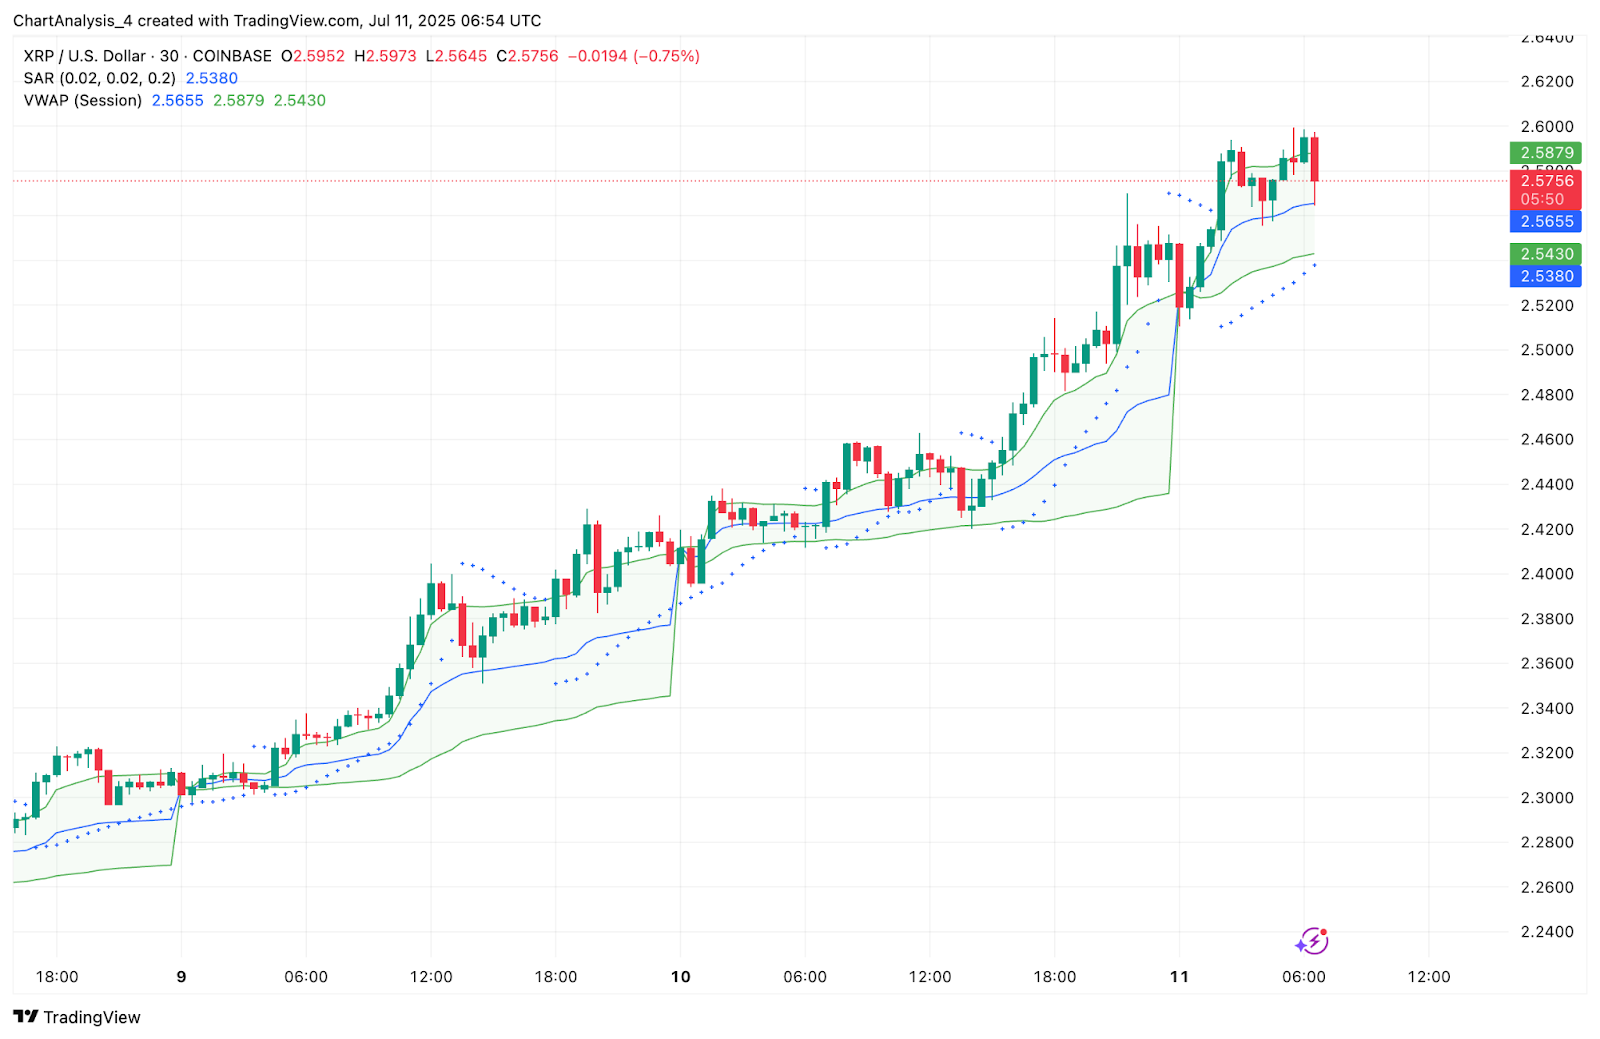
On the 30-minute chart, XRP price has been consistently trading above the VWAP at $2.56, and the Parabolic SAR dots are holding below price, confirming trend strength. The short-term structure remains bullish despite minor profit-taking candles at the $2.59 peak.
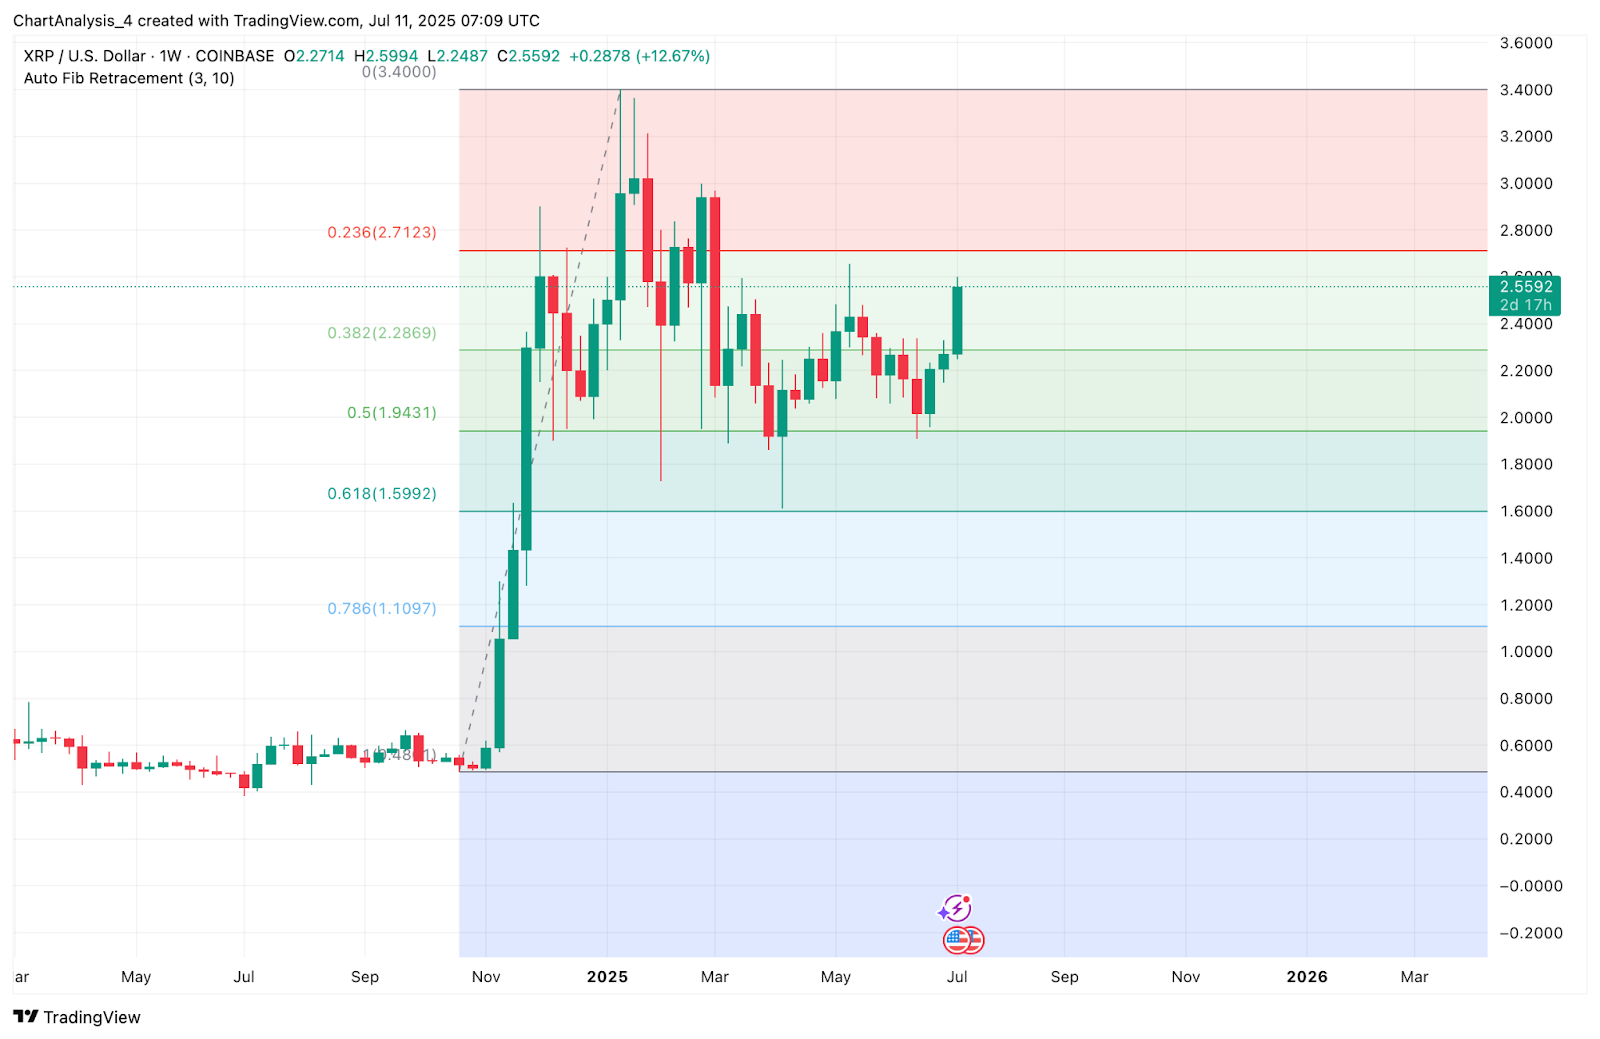
The weekly Fibonacci retracement places the current price above the 0.382 level ($2.28), with the next key level being the 0.236 retracement at $2.71. Weekly structure suggests a potential breakout continuation if bulls can hold above $2.55 heading into the weekend.
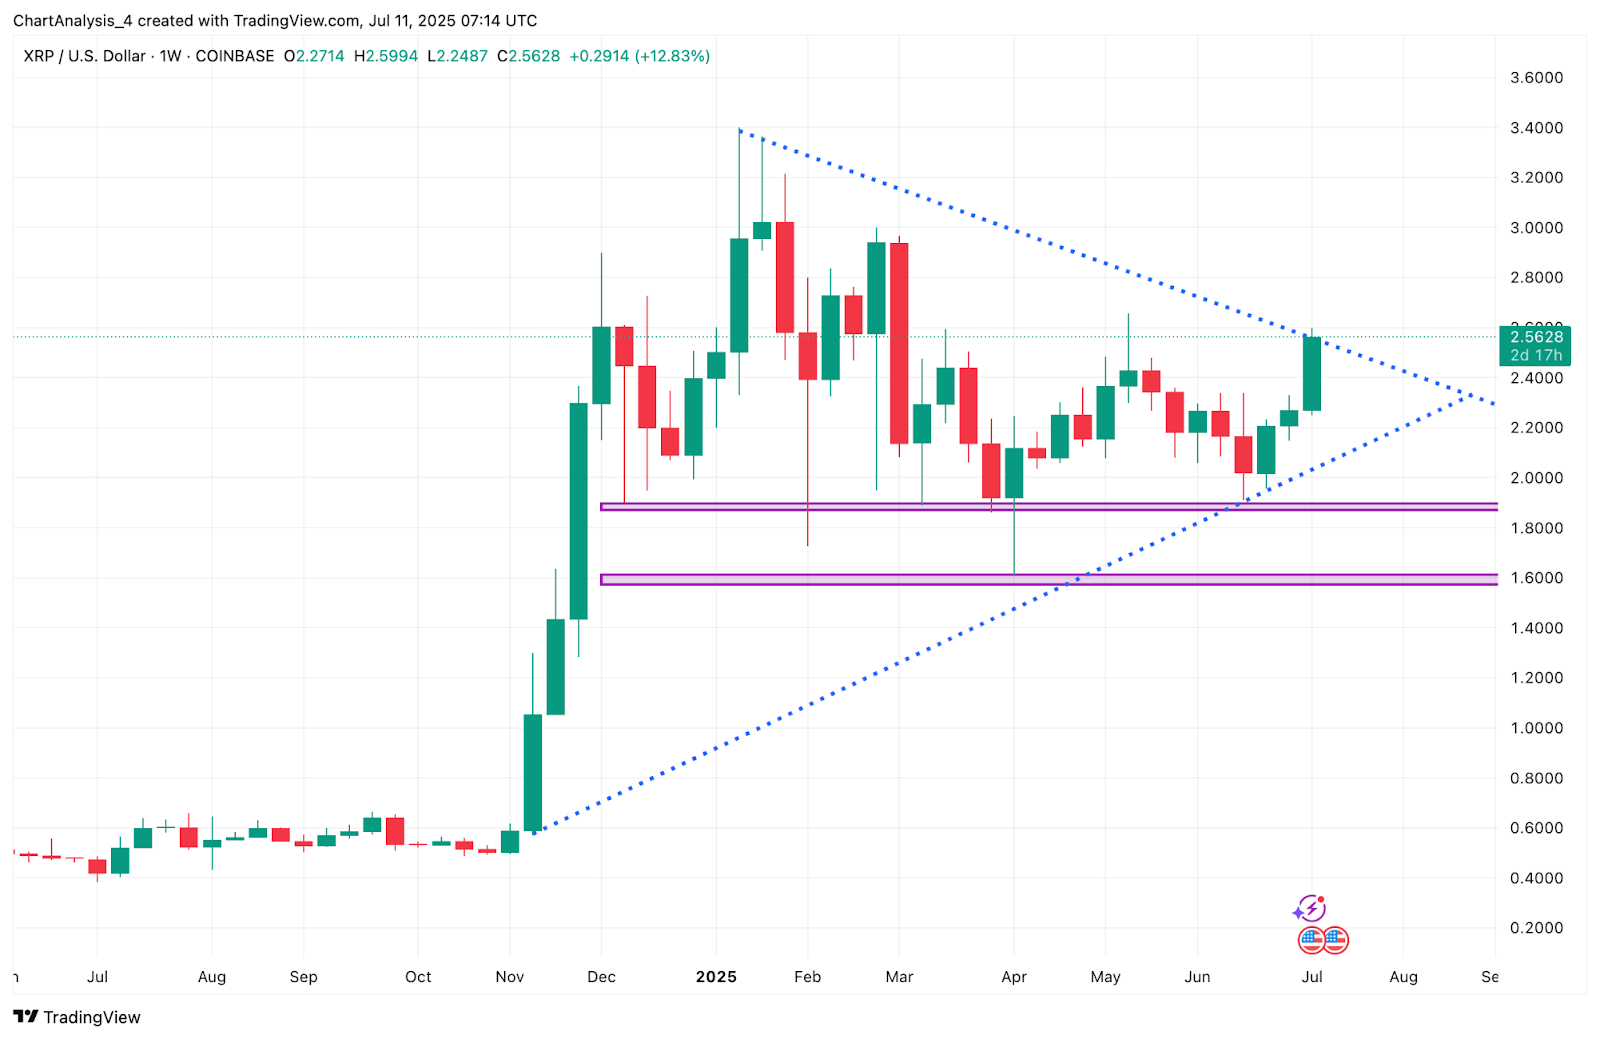
Meanwhile, volume-backed triangle resolution on the weekly chart confirms that XRP has reclaimed trend dominance. The symmetrical triangle breakout now targets the upper bound at $2.85, and potentially the psychological $3.00 mark.
XRP Price Prediction: Short-Term Outlook (24H)
As long as XRP price remains above $2.53, bulls are in control. A clean close above $2.5673 (last horizontal resistance) could extend the rally toward the $2.71–$2.74 zone, where both Fib and volume clusters converge. Beyond that, $2.85 becomes the final target before the macro resistance wall near $3.00.
If profit-taking intensifies, look for initial support at $2.48, followed by stronger demand zones at $2.35 and $2.20. These levels coincide with the previous consolidation base and EMA support on lower timeframes.
Given the trendline break, bullish order flow, and momentum confirmation, traders should continue to monitor for volume-backed moves above $2.60 to confirm upside extension.
XRP Price Forecast Table: July 12, 2025
| Indicator/Zone | Level / Signal |
| XRP price today | $2.56 |
| Resistance 1 | $2.5673 |
| Resistance 2 | $2.71–$2.74 |
| Resistance 3 | $2.85 |
| Support 1 | $2.48 |
| Support 2 | $2.35 |
| Support 3 | $2.20 |
| EMA Cluster (4H) | Bullish stack from $2.24–$2.42 |
| VWAP (30-min) | Holding above $2.56 |
| Bollinger Bands (4H) | Expanded, upper band at $2.59 |
| Parabolic SAR | Bullish, dots below price |
| Chande Momentum Oscillator | 80.24 (Strong bullish impulse) |
| Fib Levels (Weekly) | 0.236 at $2.7123 |
| Derivatives Volume | +30.27%, bullish positioning |
| Binance Top Trader Ratio | 2.03 (Long-heavy bias) |
| Weekly Structure | Symmetrical triangle breakout |
Disclaimer: The information presented in this article is for informational and educational purposes only. The article does not constitute financial advice or advice of any kind. Coin Edition is not responsible for any losses incurred as a result of the utilization of content, products, or services mentioned. Readers are advised to exercise caution before taking any action related to the company.


 Price Prediction: Can Bulls Reclaim the 0.236 Level?")