 Price Prediction for July 15")
XRP price has extended its breakout momentum, reaching $2.95 after clearing multiple resistance levels. The move comes as broader crypto market sentiment remains bullish following Bitcoin’s surge past $122K and renewed risk appetite across digital assets. XRP is now trading near the upper limit of a key supply zone from late 2024, with traders eyeing the $3.10 level as the next inflection point.
XRP Price Forecast Table: July 15, 2025
| Indicator/Zone | Level / Signal |
| XRP price today | $2.95 |
| Resistance 1 | $3.10 |
| Resistance 2 | $3.28 |
| Support 1 | $2.77 |
| Support 2 | $2.57 |
| RSI (30-min) | 68.98 (bullish bias) |
| MACD (30-min) | Bullish crossover, rising histogram |
| Bollinger Bands (4H) | Expanding, price at upper band |
| EMA Cluster (4H) | Full bullish alignment |
| Parabolic SAR (1D) | Bullish, dots below price |
| Bull Market Band (1W) | Price above band, trend confirmation |
| Derivatives Open Interest | $8.06B (+7.92%) |
| Binance Long/Short Ratio | 2.83 (strong long dominance) |
| Options Volume (24H) | $21.29M (+31.41%) |
What’s Happening With XRP’s Price?
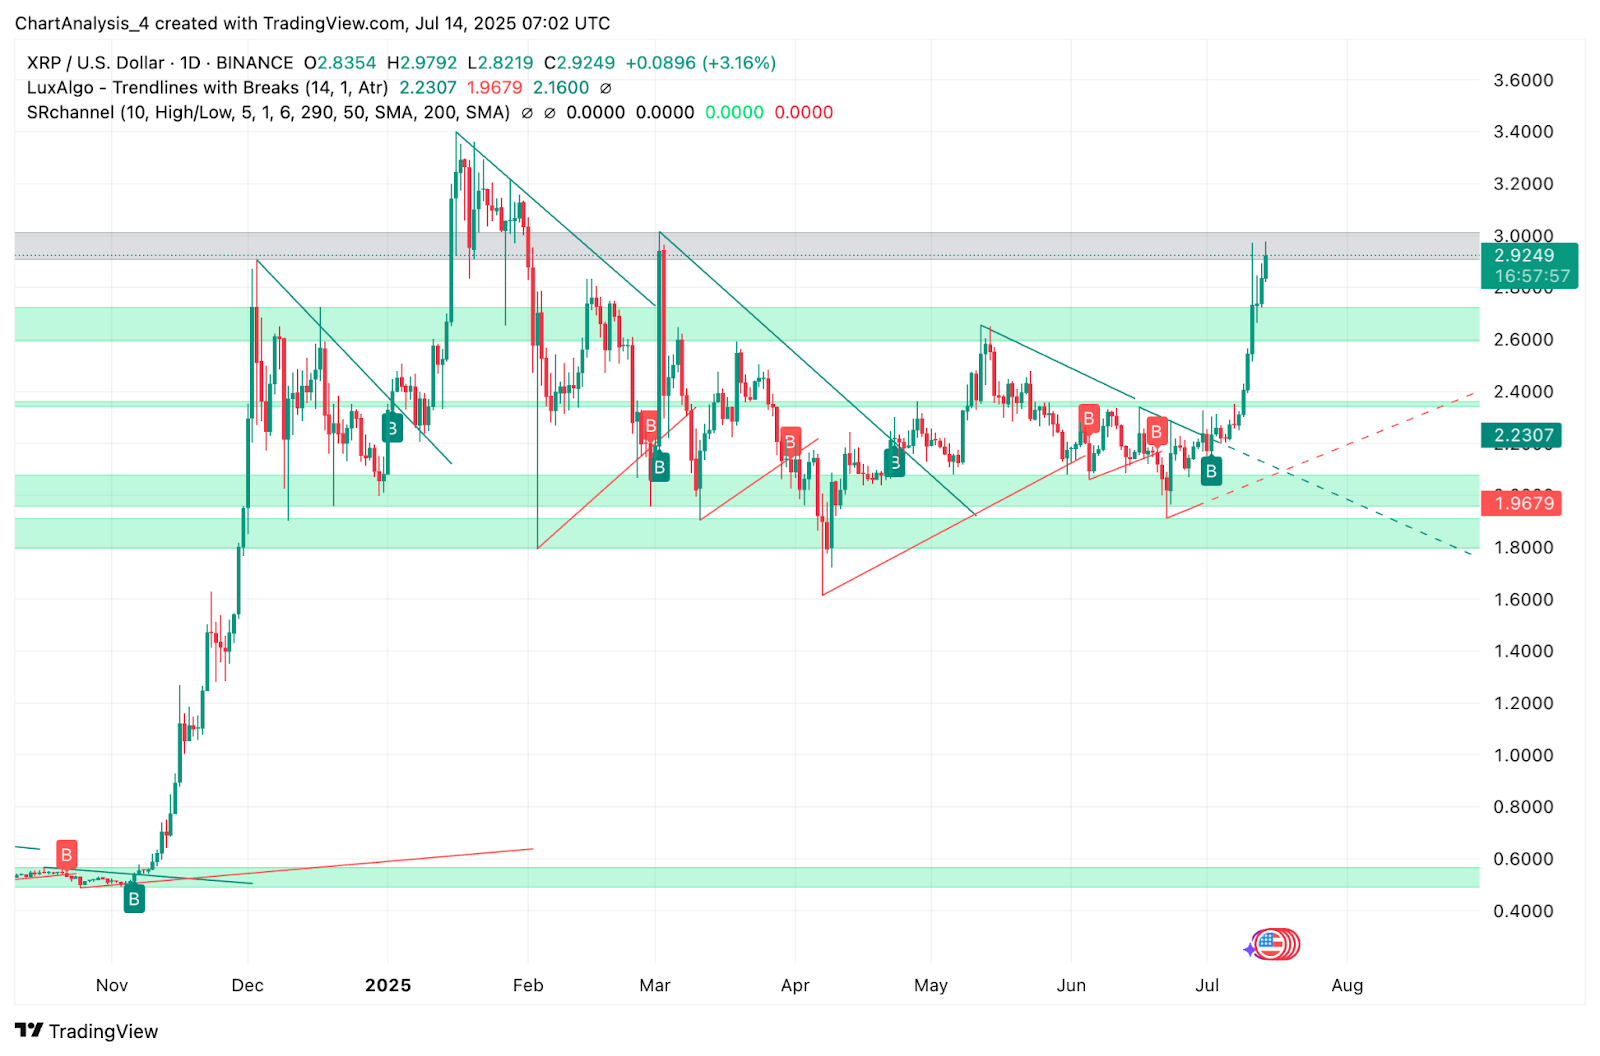
The daily structure shows a sharp reversal from the $2.20–$2.30 support zone, with XRP rallying more than 30% over the past week. The breakout from the long-term descending wedge has activated a double-bottom pattern, now in full expansion. Price action is now well above the 20/50/100/200 EMA cluster on the 4-hour chart, with the 200 EMA resting near $2.33.
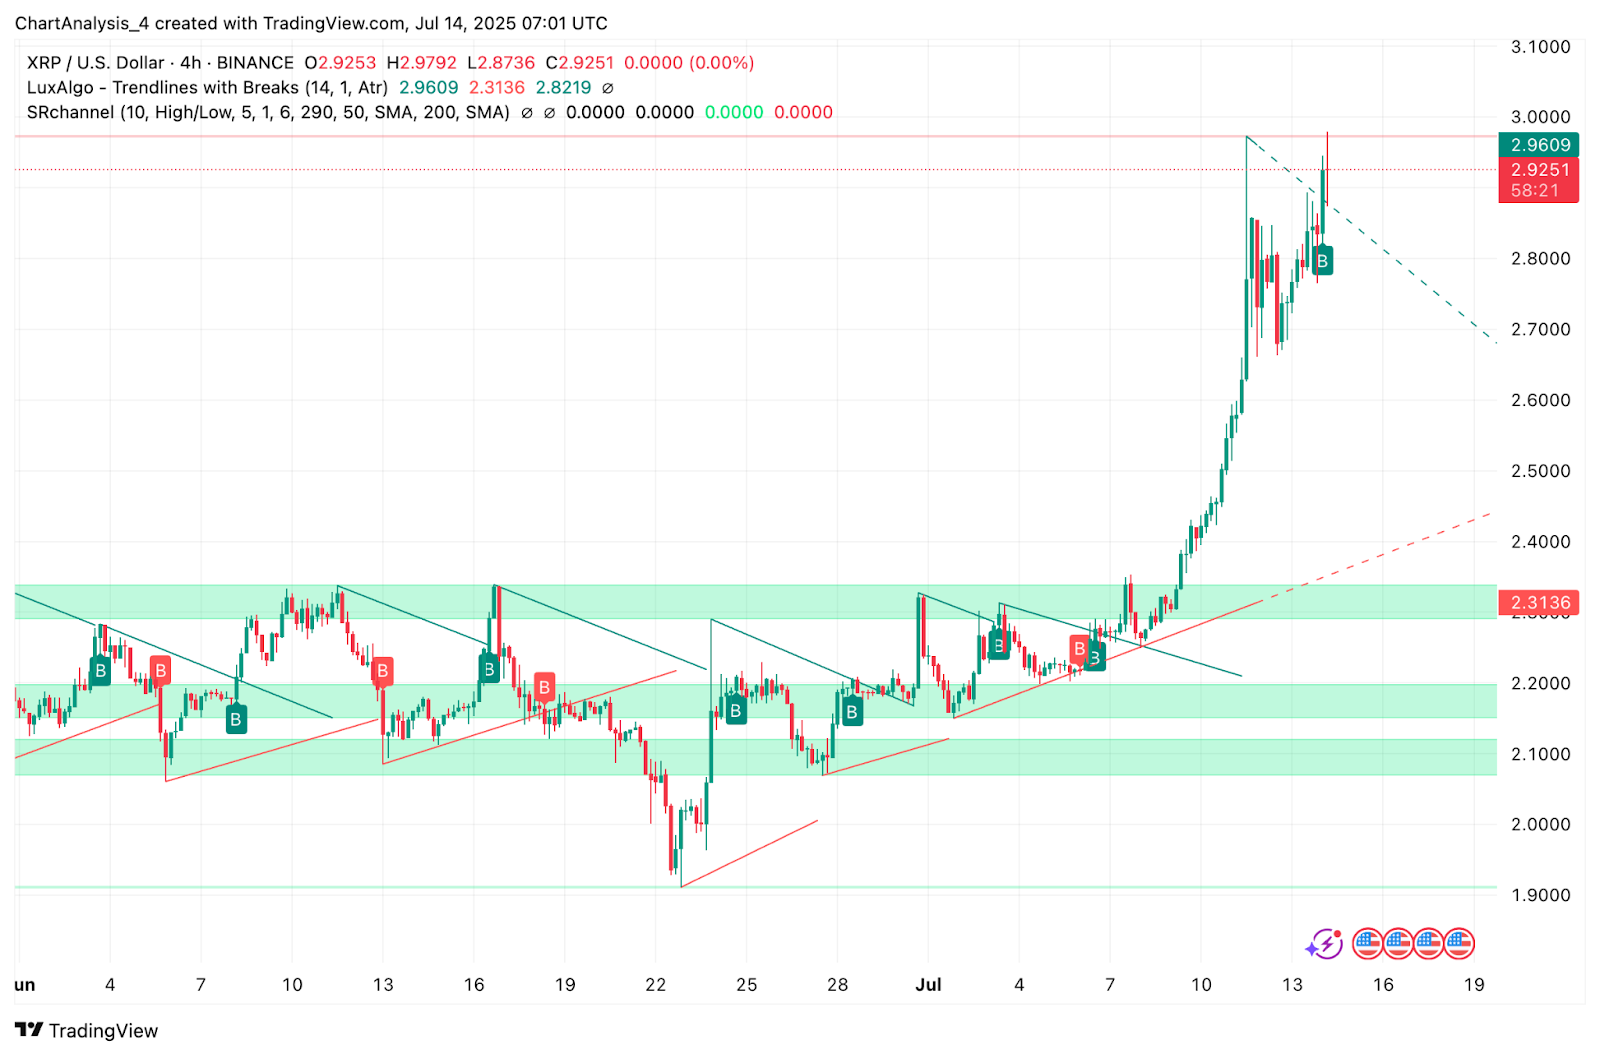
A clear parabolic curve has developed, supported by tight EMA alignment and higher lows. The Bollinger Bands on the 4-hour timeframe are widening, with price pushing through the upper band at $2.96. This indicates a continuation of directional volatility, especially with the mean sitting much lower near $2.57.
Why Is The XRP Price Going Up Today?
Why XRP price going up today is a result of technical breakout confirmation and supportive derivatives flow.
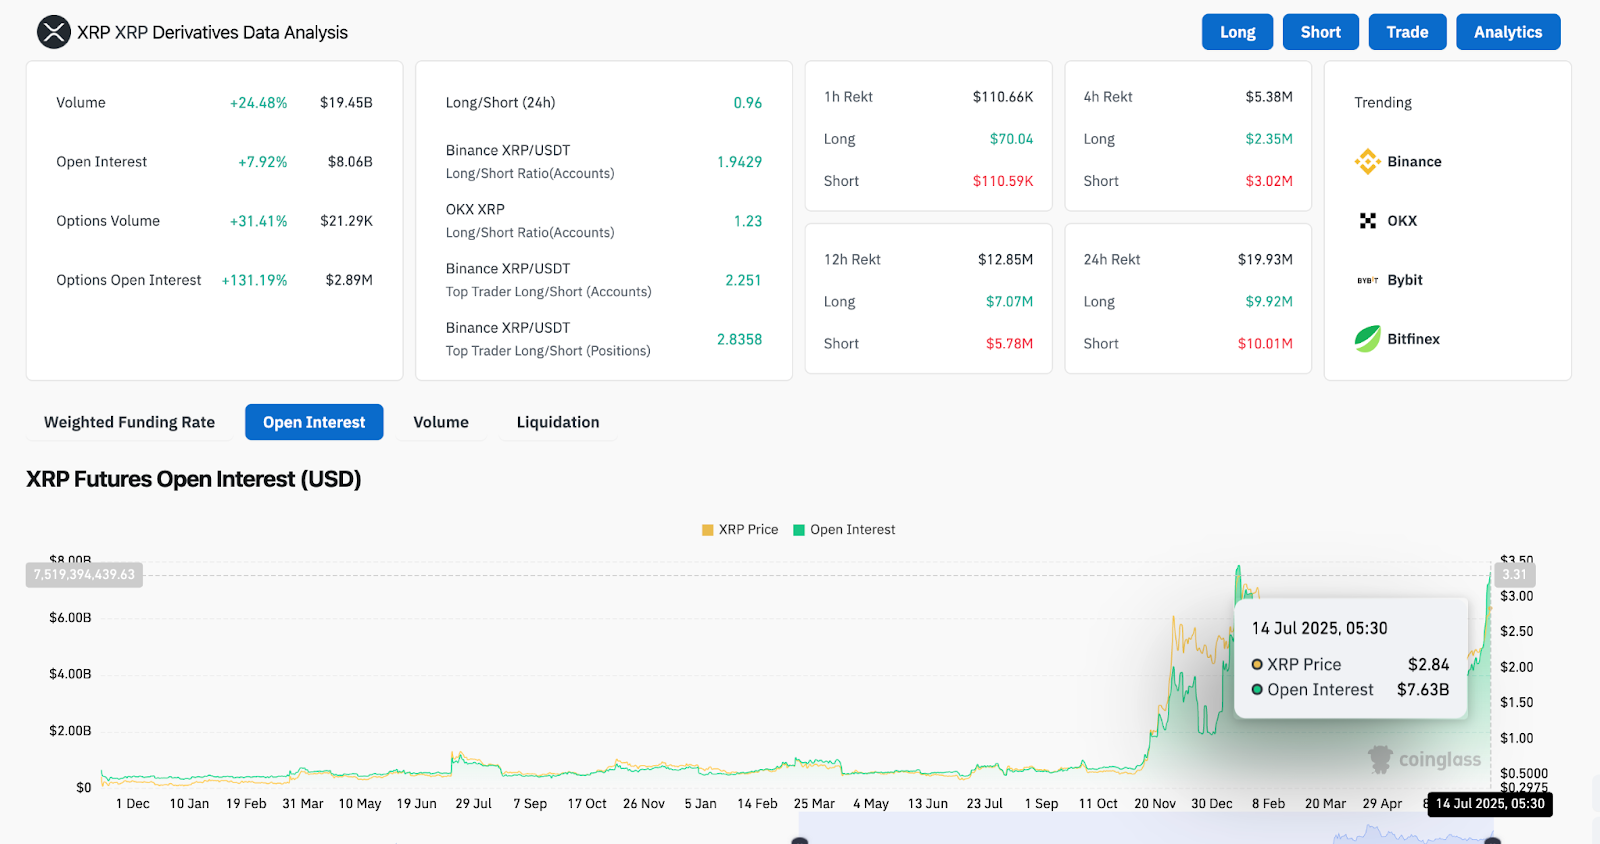
The derivatives data shows a sharp spike in open interest, rising 7.92% to $8.06B. Options volume has surged by 31.41%, with top traders on Binance showing a 2.83 long/short ratio which is heavily tilted toward longs. This reflects strong institutional participation behind the current move.
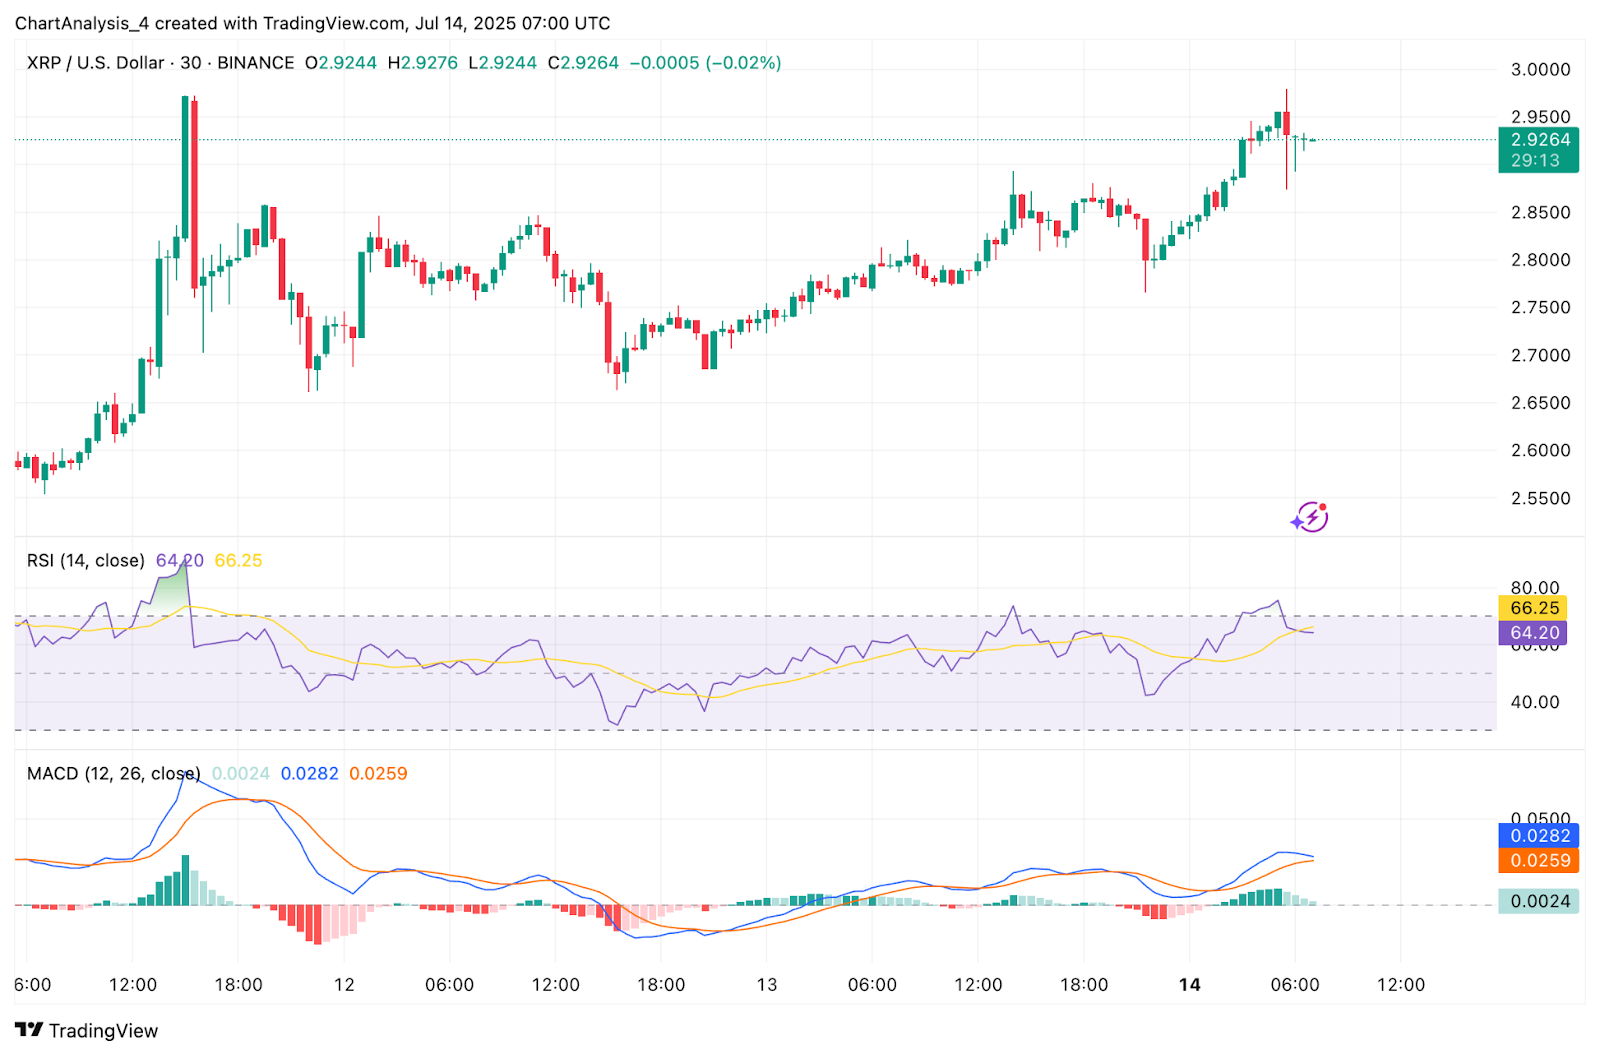
On the 30-minute chart, the RSI has returned to 68.98 after briefly dipping below 66, suggesting a healthy consolidation at elevated levels. MACD remains bullish with rising histogram bars, indicating sustained buying interest. Short-term profit-taking is occurring, but dips are being bought quickly.
Bollinger Bands and EMAs Show Strong Breakout Conditions
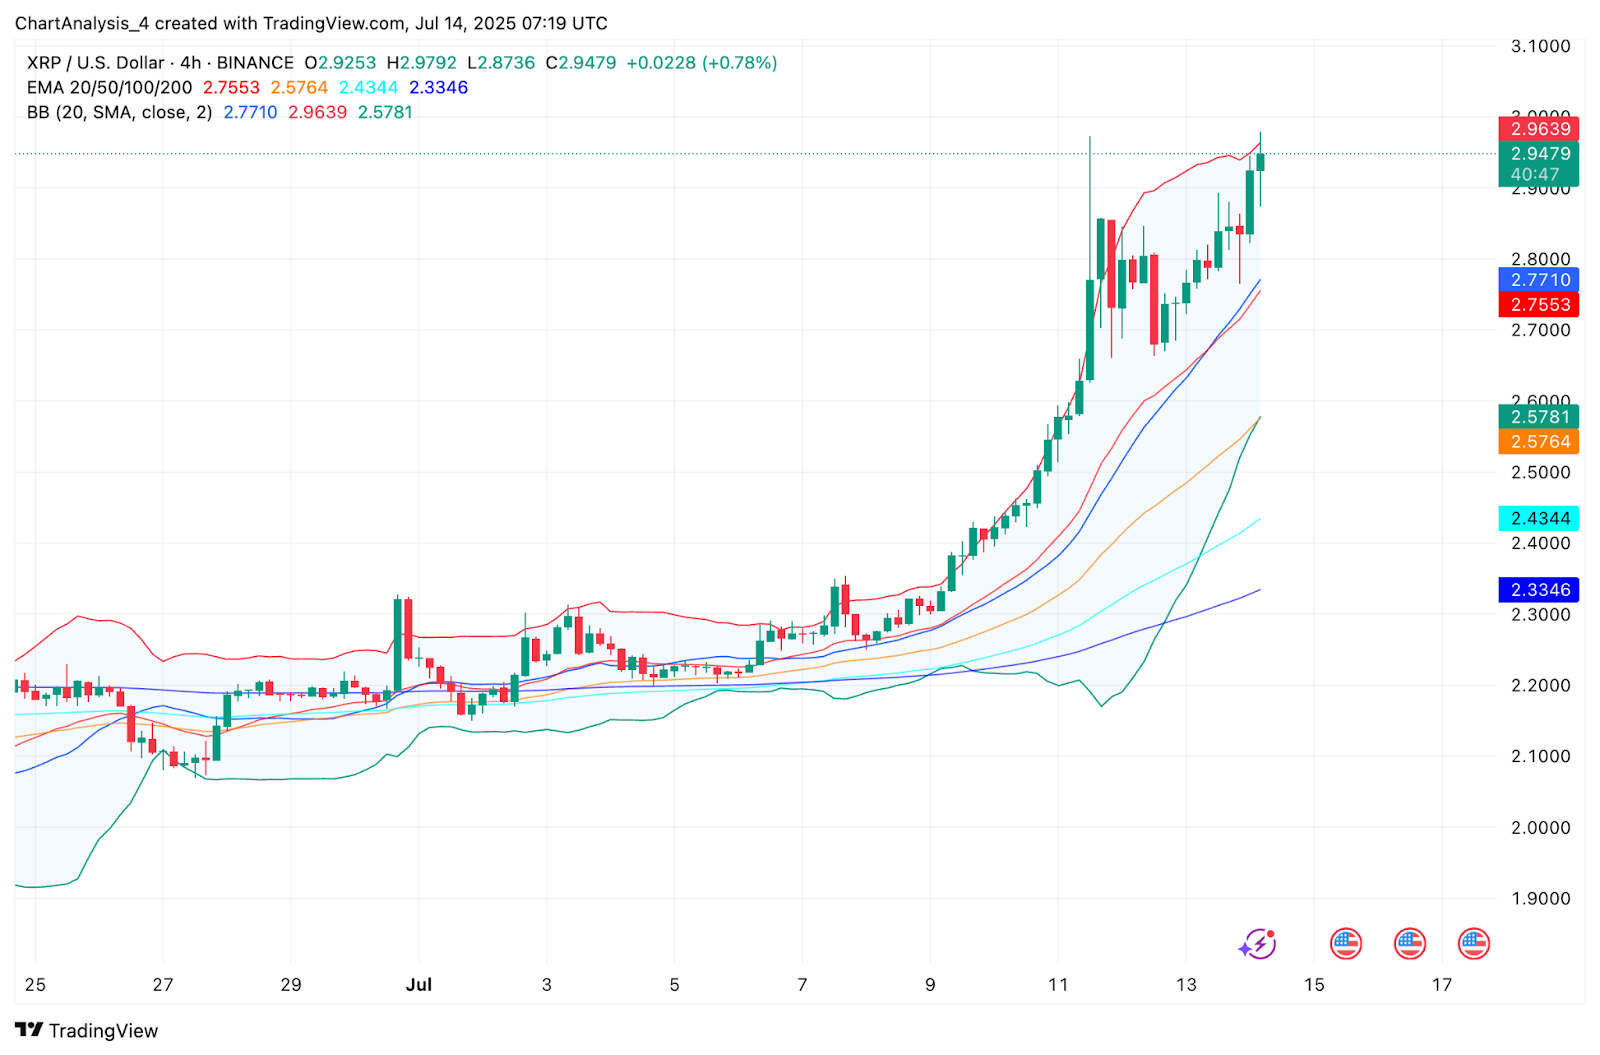
XRP price action remains well supported by its dynamic trend indicators. The 4-hour EMAs are stacked cleanly below price, with EMA20 at $2.76 and EMA200 at $2.33, showing full bullish alignment. The Bollinger Bands on the same timeframe continue to expand, with price holding above the upper band. This signals that the rally may still be in its expansion phase.
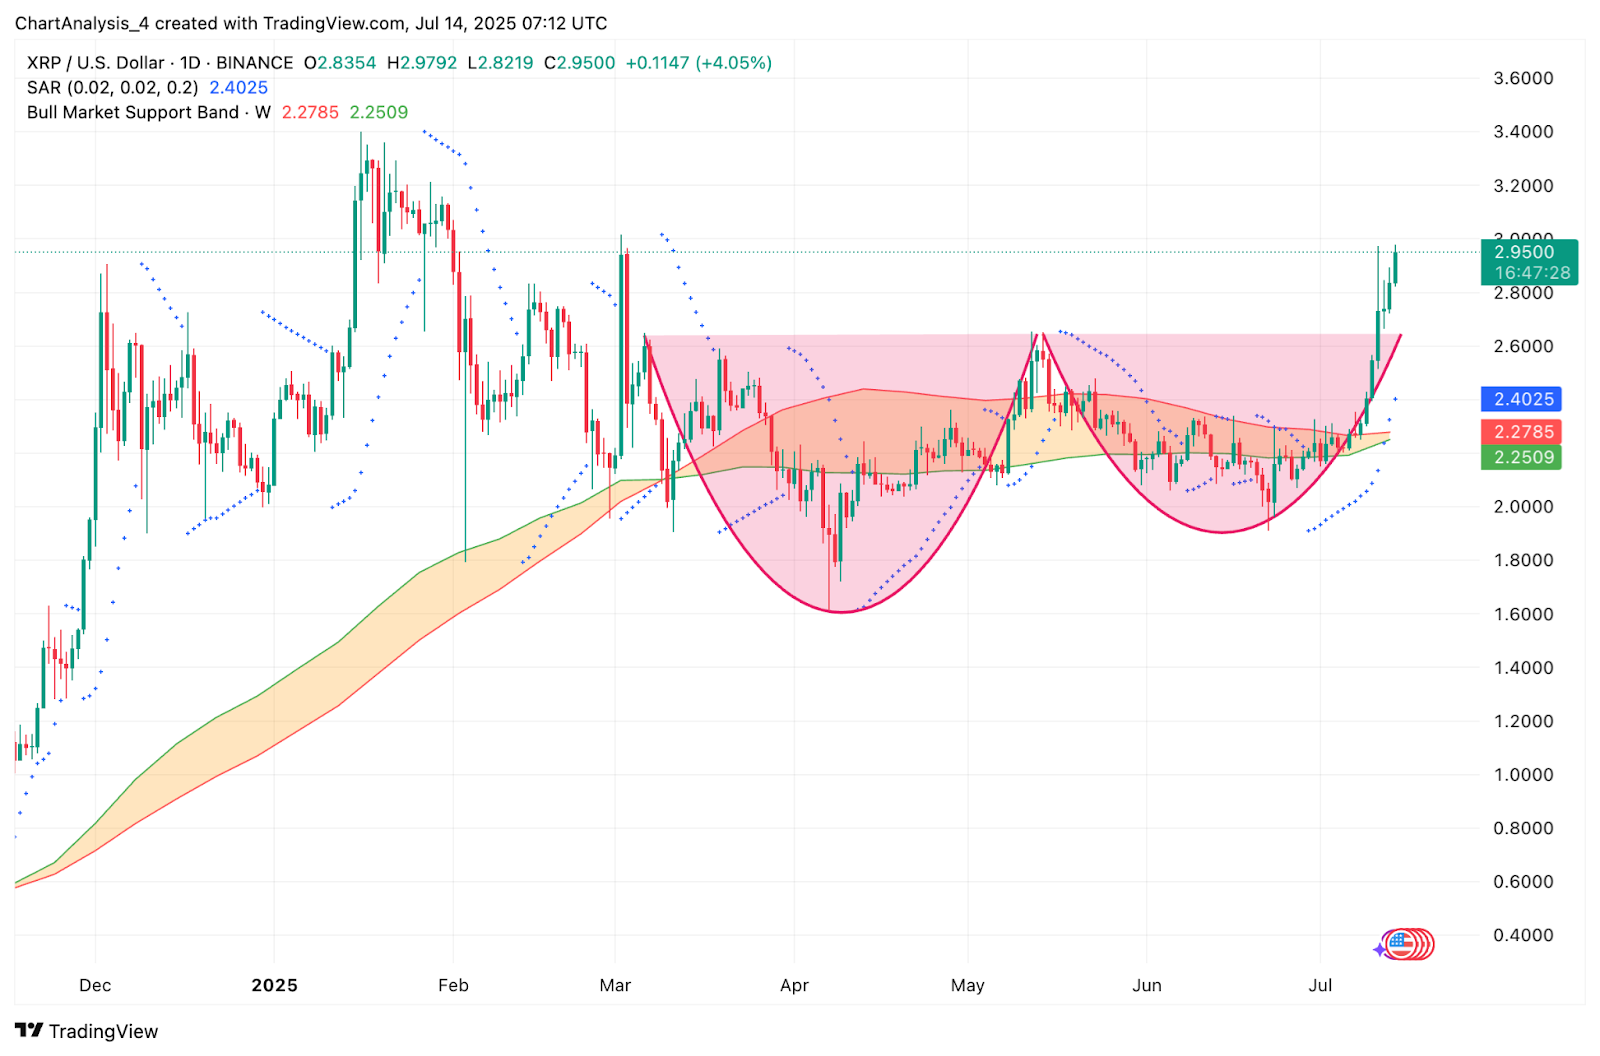
The daily chart’s cup-and-handle-like structure is also close to completion. The neckline has been broken with volume, and the handle zone from $2.60 to $2.80 has now turned into support. If XRP maintains above $2.90, the next phase could involve retesting $3.20 — a historical rejection zone.
On-chain sentiment also aligns with bullish continuation. Parabolic SAR dots on the daily have flipped below price since July 9, a classic confirmation of trend reversal. XRP has also reclaimed its position above the Bull Market Support Band (weekly), a structural shift that reinforces long-term bullish control.
Derivatives liquidation data further supports the move. Over $110 million in short positions were liquidated over the past 24 hours, triggering a short squeeze that contributed to the fast rally into the $2.90s.
XRP Price Prediction: Short-Term Outlook (24H)
XRP price today has formed a high-conviction structure supported by bullish indicator alignment, elevated funding, and breakout volume. If bulls manage to clear the $2.96–$3.00 resistance zone with a daily close, the next upside target lies near $3.10 followed by $3.28.
On the downside, immediate support rests near $2.77 (upper Bollinger mid-band and prior resistance) and $2.57 (EMA50 zone on 4-hour). A break below this could see XRP testing $2.43, although the broader structure still favors upside continuation.
As long as Bitcoin remains stable above $120K, XRP is likely to benefit from continued risk-on flows. Traders should monitor volume near the $2.96 zone to gauge breakout strength. If momentum slows, a brief consolidation below $3.00 could form before another leg higher.
Disclaimer: The information presented in this article is for informational and educational purposes only. The article does not constitute financial advice or advice of any kind. Coin Edition is not responsible for any losses incurred as a result of the utilization of content, products, or services mentioned. Readers are advised to exercise caution before taking any action related to the company.


