 Price Prediction for July 16")
XRP price extended its bullish rally into the $2.95 to $3.03 range before encountering firm resistance just under the 0.236 Fibonacci level on the weekly chart. The broader structure shows price consolidating beneath the March 2024 high, with XRP price today hovering around $2.87 after shedding over 2.9 percent intraday.
XRP Price Forecast Table: July 16, 2025
| Indicator/Zone | Level / Signal |
| XRP price today | $2.87 |
| Resistance 1 | $2.95 |
| Resistance 2 | $3.03 |
| Support 1 | $2.83 |
| Support 2 | $2.65 |
| Weekly Fib Resistance | 0.236 at $2.71 |
| Spot Netflow (July 15) | -$45.48M |
| Funding Rate | 0.0125 percent (positive) |
| RSI (30-min) | 42.1 (bearish bias) |
| MACD (4H) | Flattening, weakening momentum |
| Bollinger Bands (4H) | Expanding, support at $2.67 |
| VWAP (30-min) | Below midline at $2.87 |
| Binance Top Trader Ratio | 2.91 long bias |
What’s Happening With XRP’s Price?
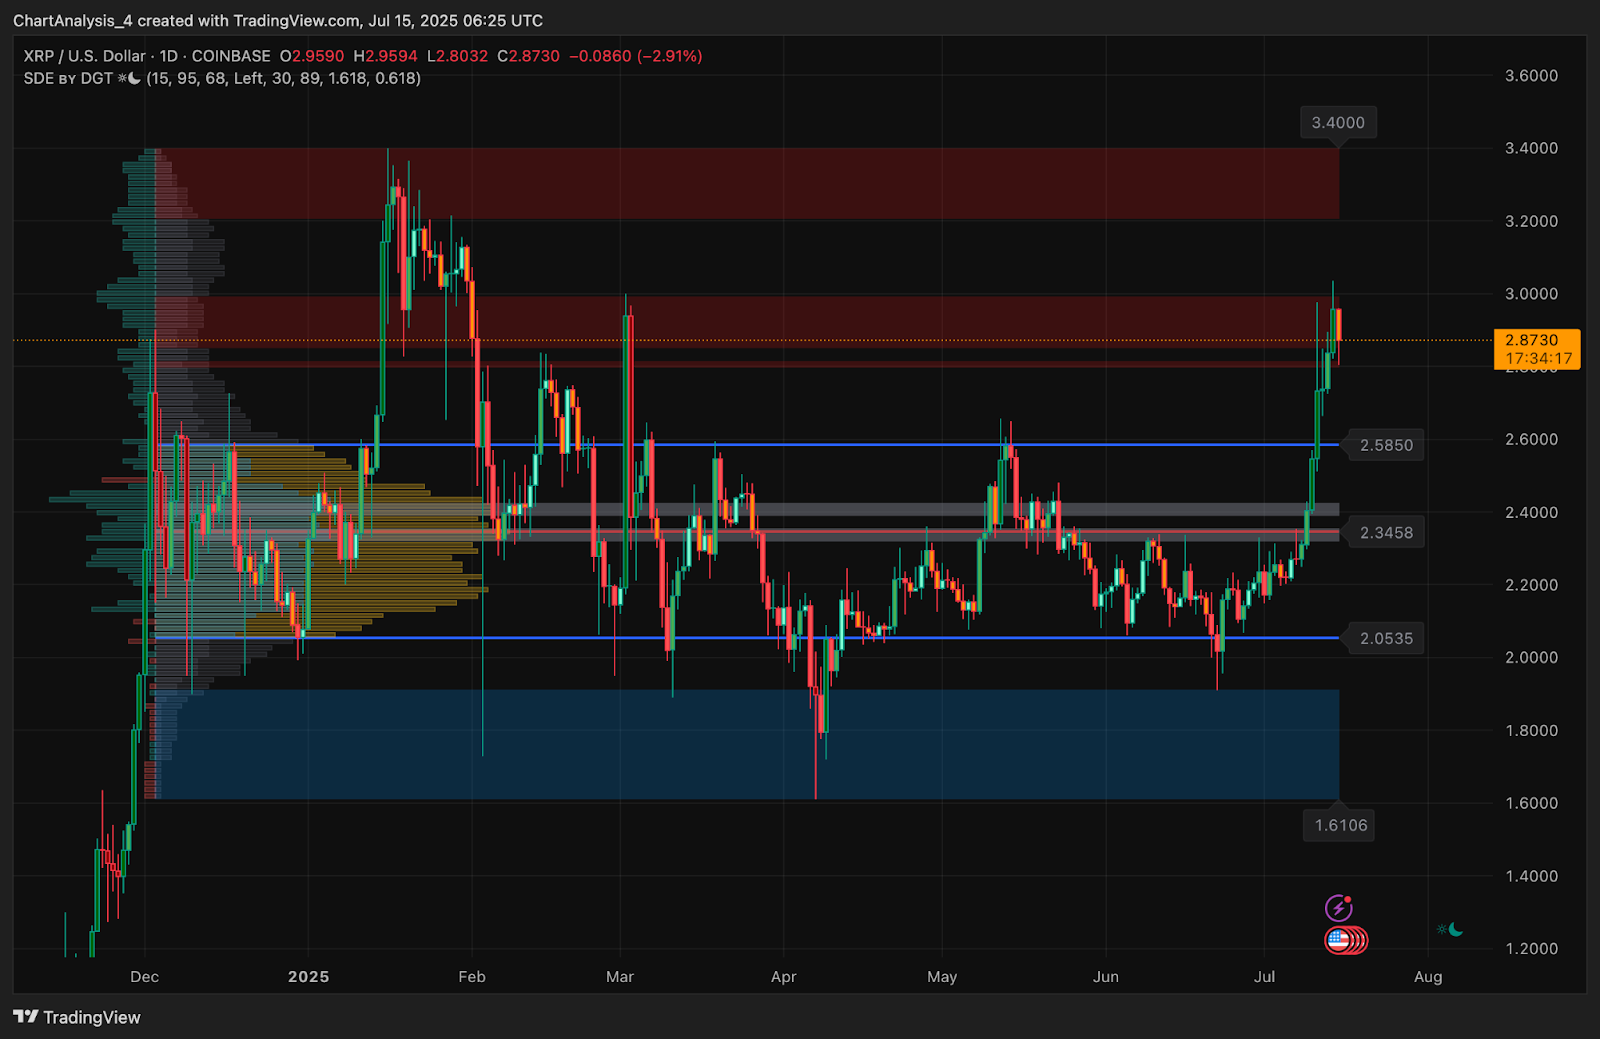
Following a powerful breakout from the $2.40 consolidation base, XRP price action surged into a high-volume resistance zone that stretches from $2.85 to $3.05. This area aligns with key historical rejections seen in late 2024 and also marks the 23.6 percent retracement zone from the macro move toward $3.40.
On the 1-day chart, XRP tagged a high of $3.03 before retracing into a minor support band near $2.83. This rejection came as the price met a previously unfilled volume inefficiency on the volume profile and was rejected from the top of a red order block on the daily chart.
Despite the recent pullback, XRP continues to trade above the 20 and 50 EMAs on the 4-hour timeframe, with the Bollinger Bands showing signs of fresh expansion. The upper band at $3.00 has capped price for now, while the median band near $2.84 is providing short-term support.
Why Is The XRP Price Going Down Today?
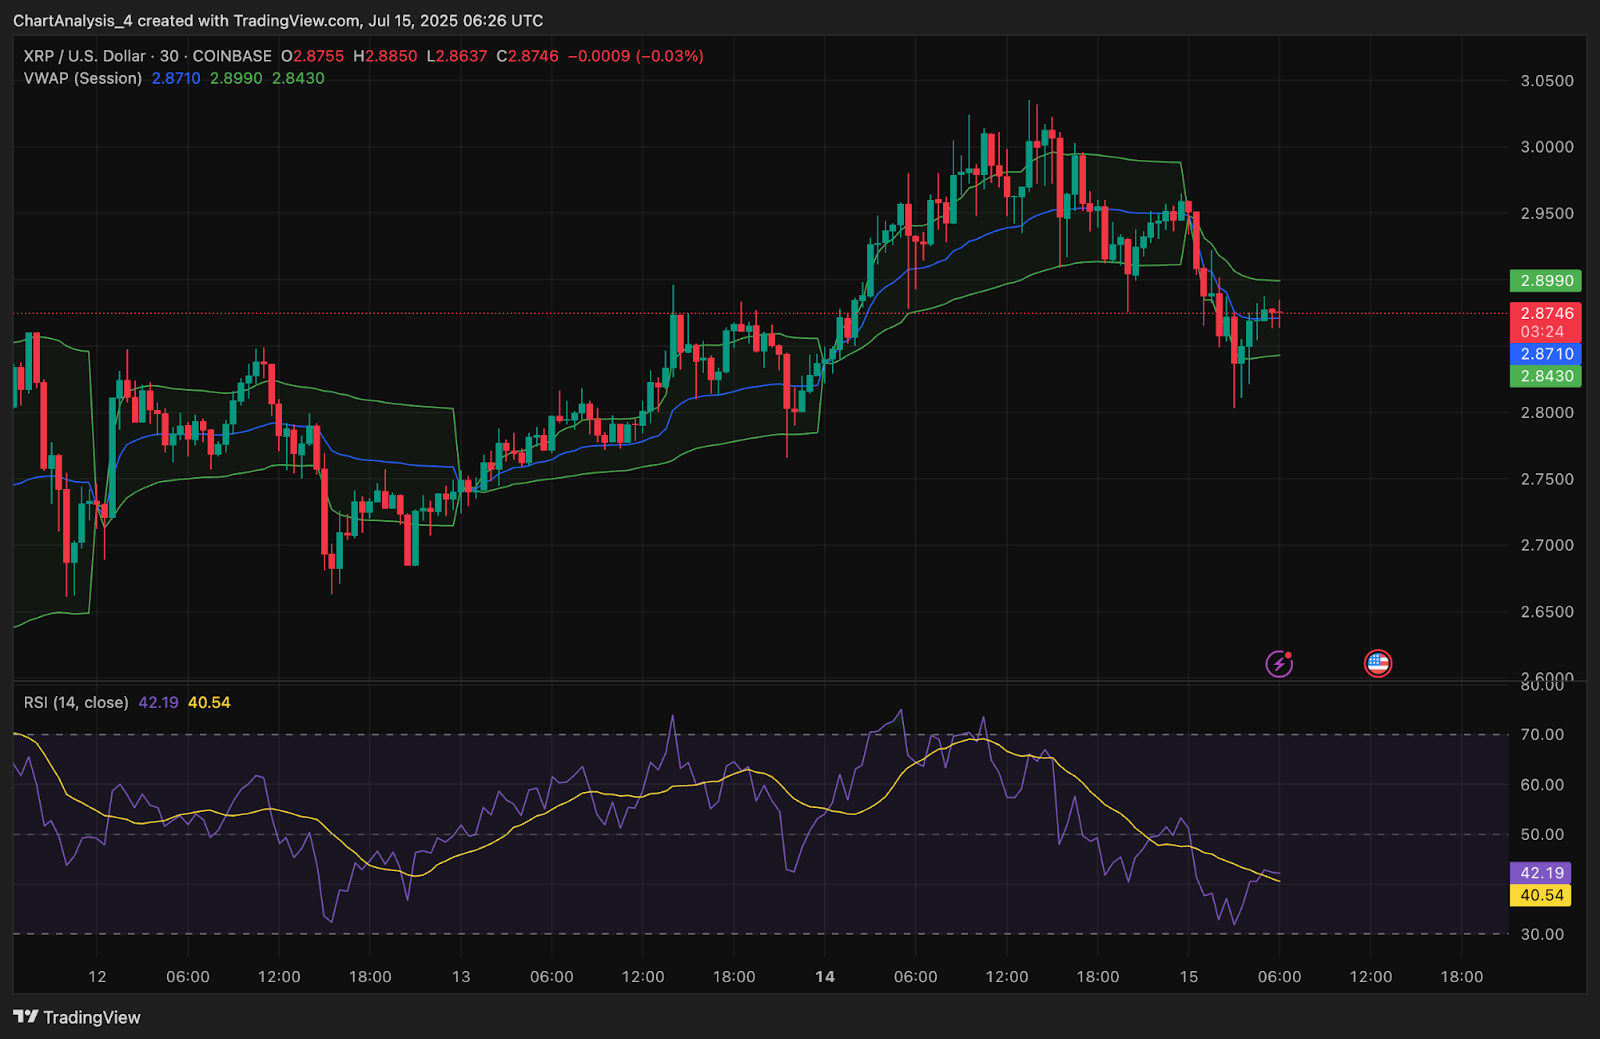
The pullback in XRP price today is primarily driven by short-term exhaustion and profit-taking near historical resistance zones. The 30-minute chart shows RSI dropping to 42.1, reflecting weakening momentum after being overbought for much of the July rally.
The VWAP bands on the intraday chart show XRP now trading below the session VWAP at $2.87 and hugging the lower band. This confirms reduced bid strength following the morning rejection.
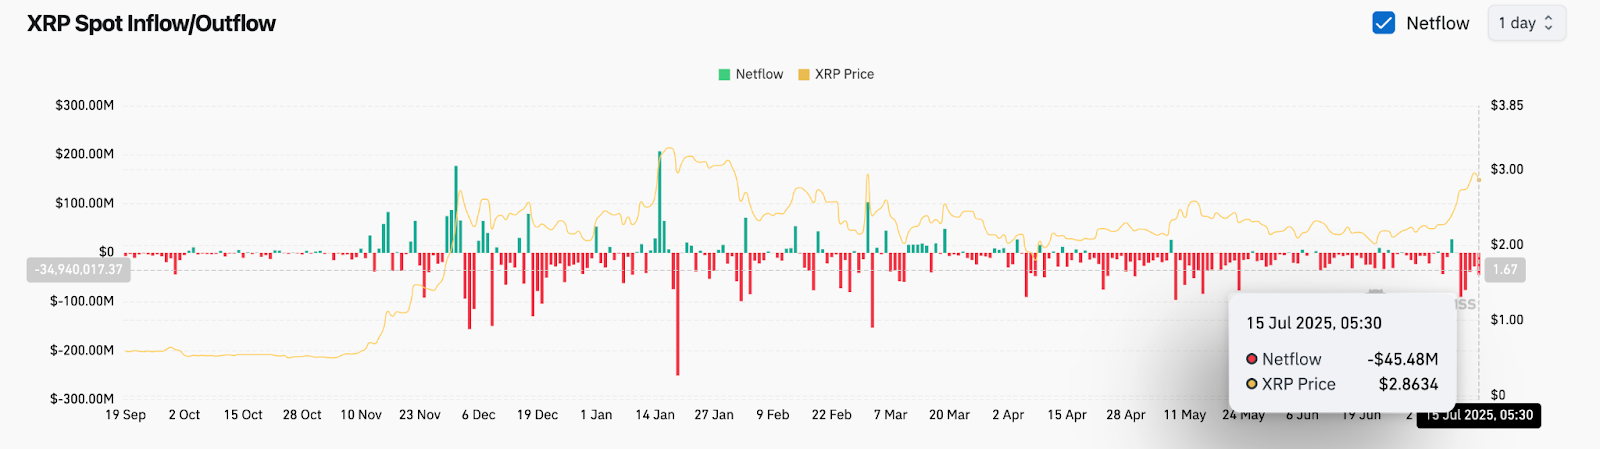
From a broader flow perspective, the latest spot flow data shows a net outflow of $45.48 million on July 15, reinforcing the idea that whales are distributing into strength at current levels.
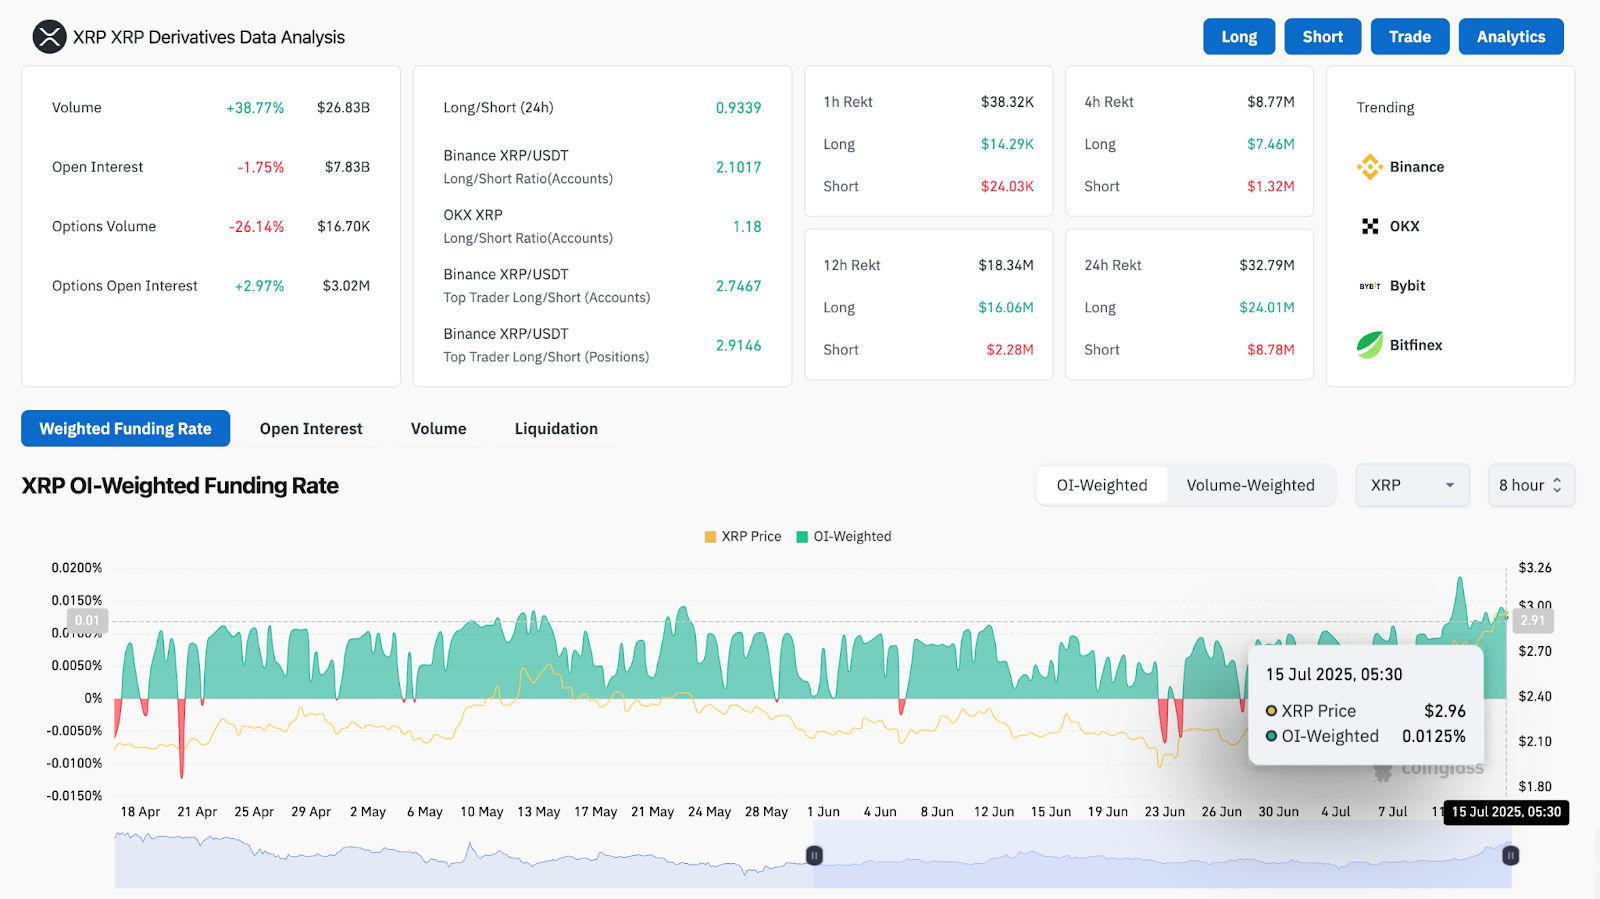
The derivatives market also shows a -1.75 percent drop in open interest despite a 38 percent surge in volume, indicating that buyers may be unwinding leveraged longs.
Still, sentiment remains largely bullish. Binance top traders hold a long-to-short ratio of 2.91 and the funding rate remains positive at 0.0125 percent. This suggests positioning remains tilted in favor of bulls despite short-term weakness.
Fib Levels and Bollinger Expansion Define Price Boundaries
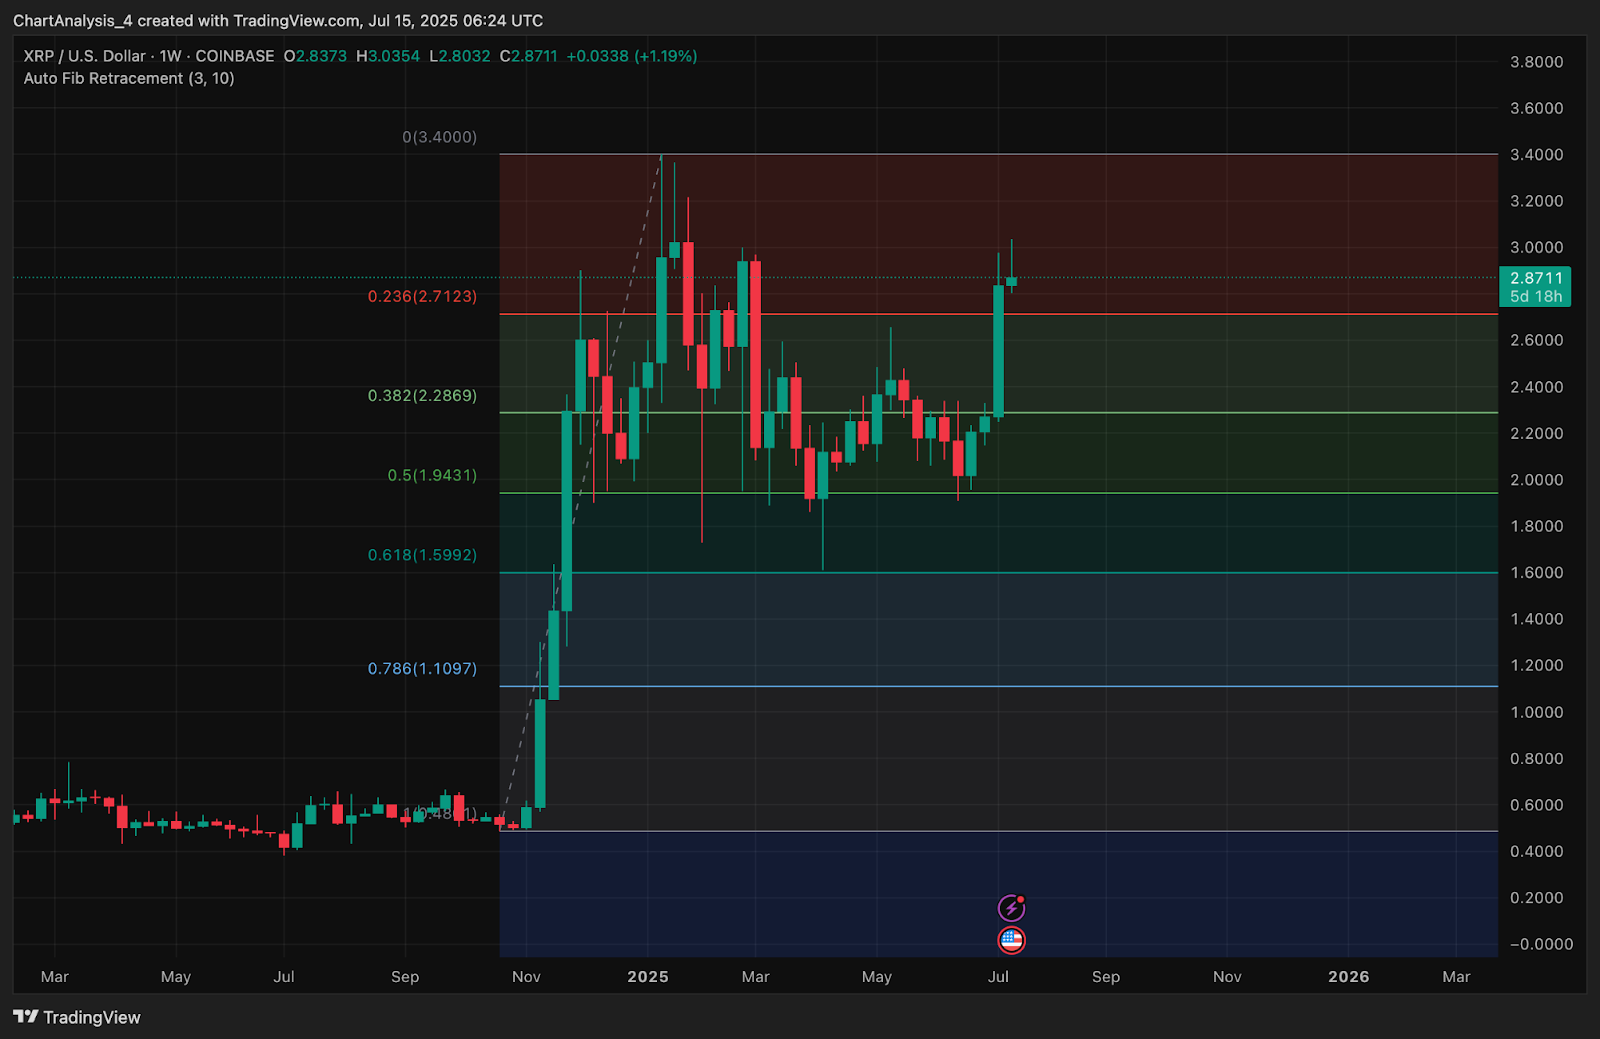
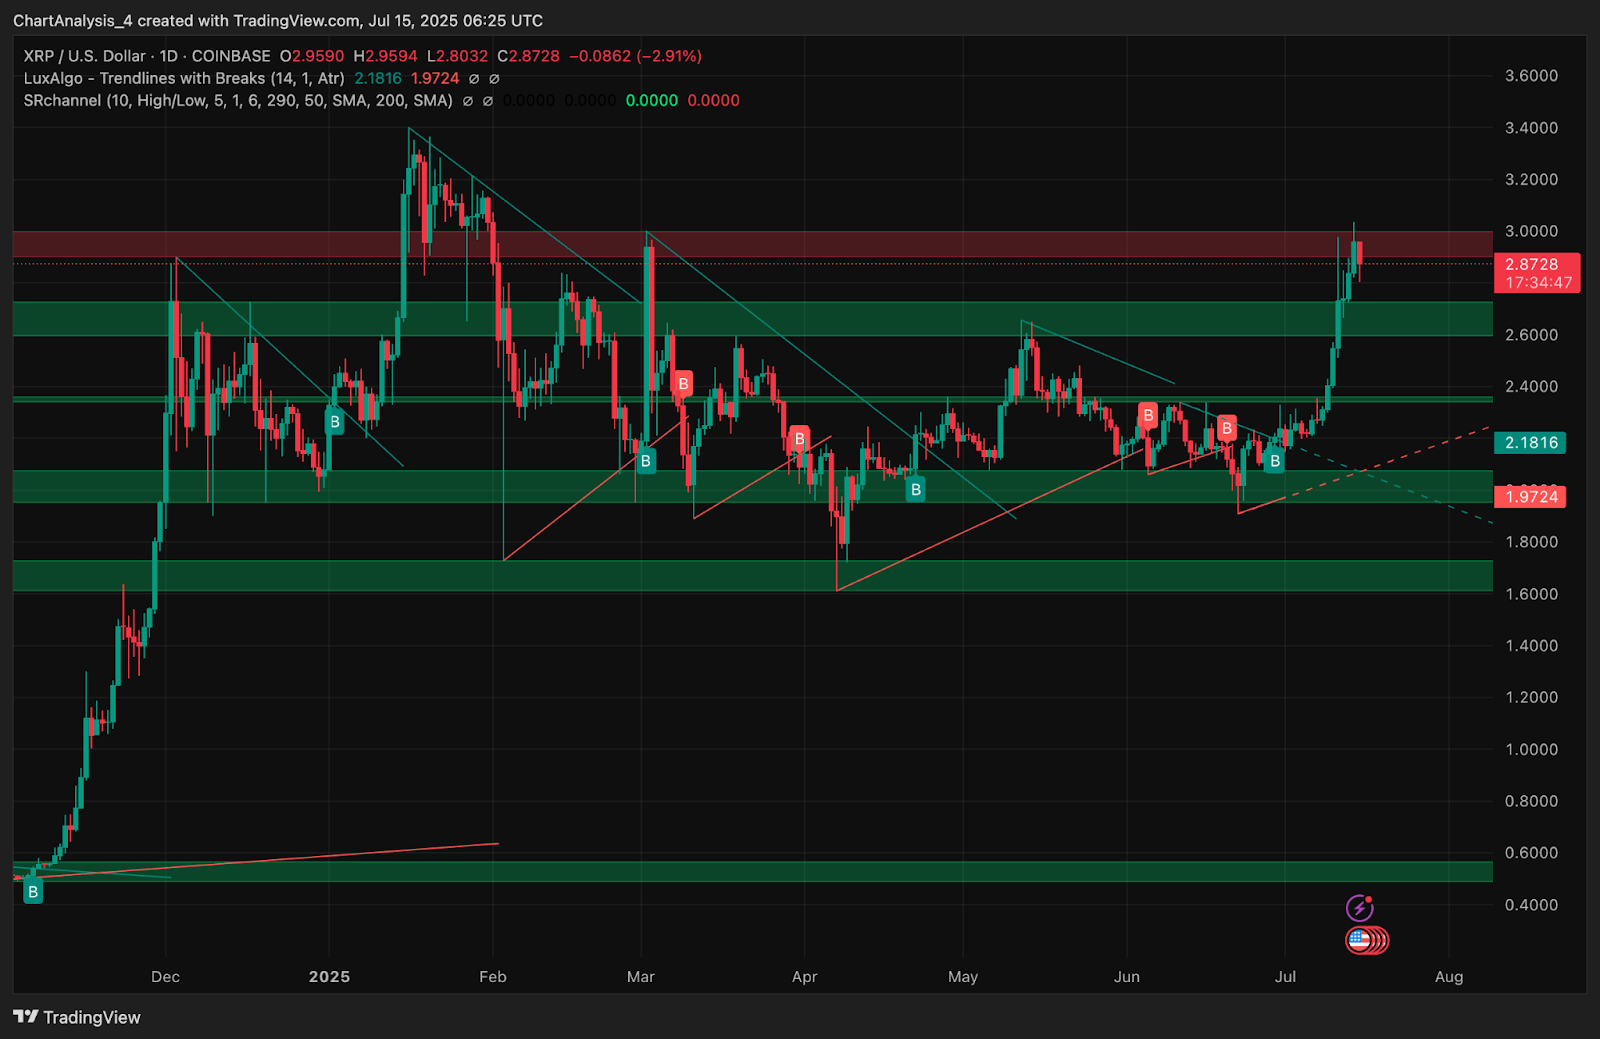
On the weekly timeframe, XRP price is facing stiff resistance at the 0.236 Fib level of $2.71 after reclaiming the 0.382 zone at $2.28 last week. Price briefly moved above the Fib threshold to tap $3.03 but closed back below $2.90.
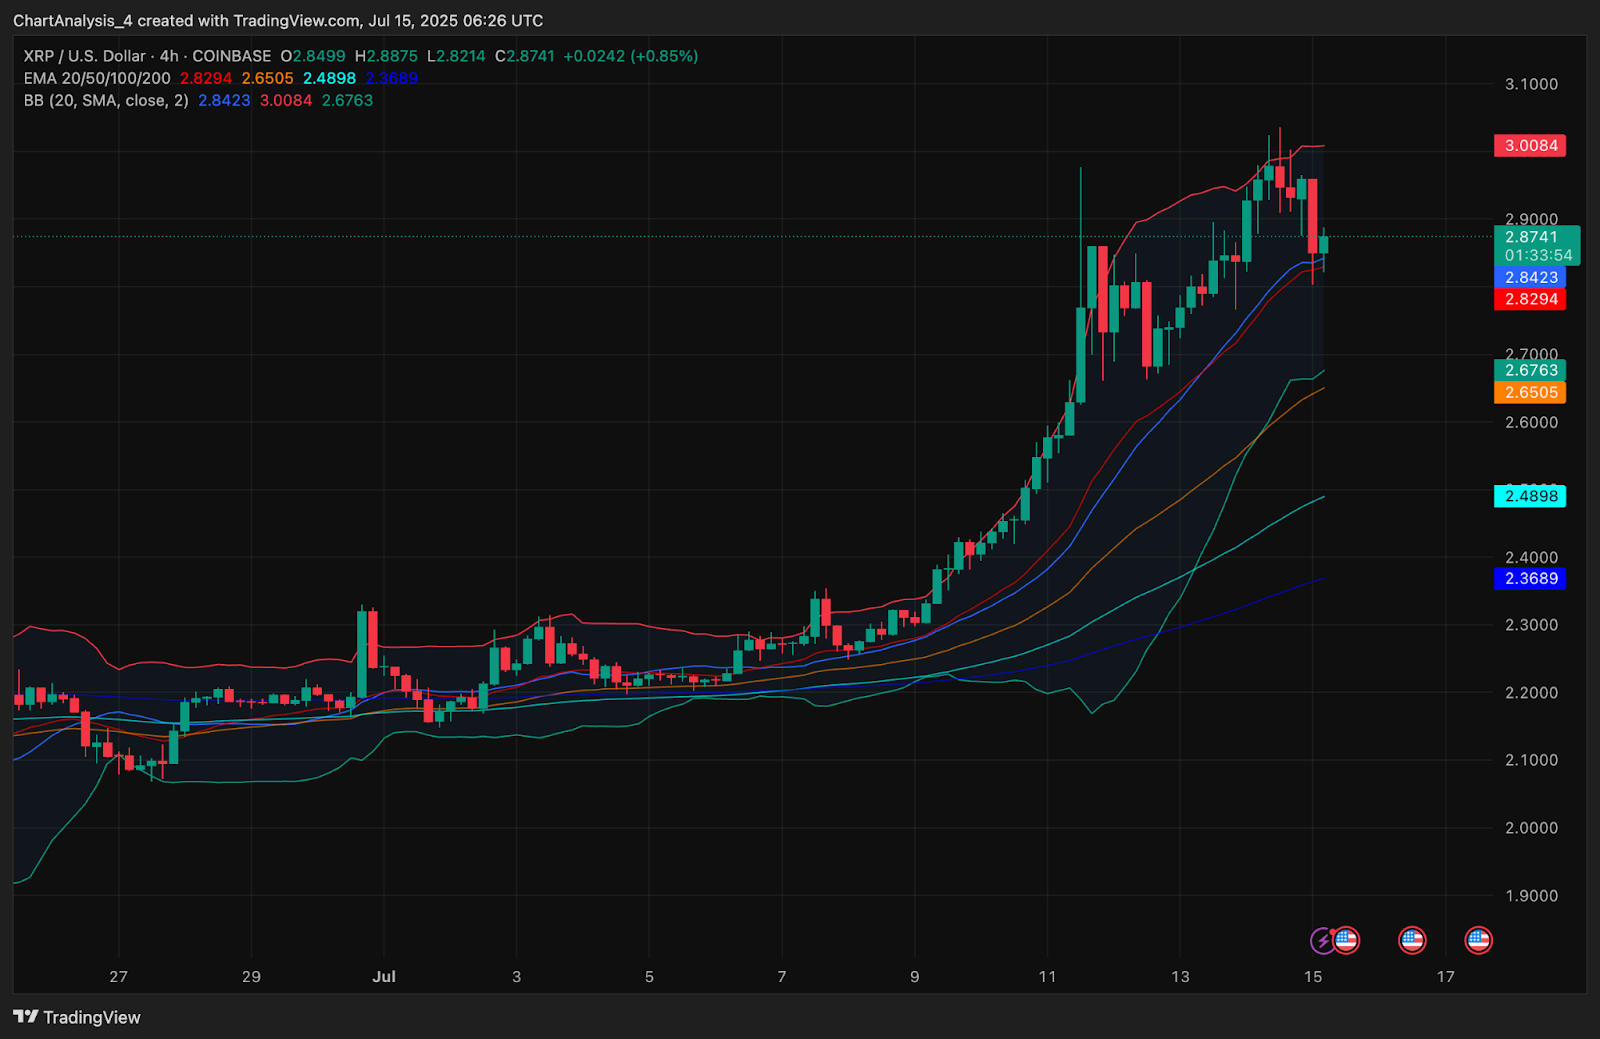
This retracement is expected, especially given the rapid rise from $2.05 without major consolidation. Bollinger Bands on the 4-hour chart show strong volatility expansion, with the lower band now curving upward around $2.67. This zone, along with the EMA50 at $2.65, marks a key support base.
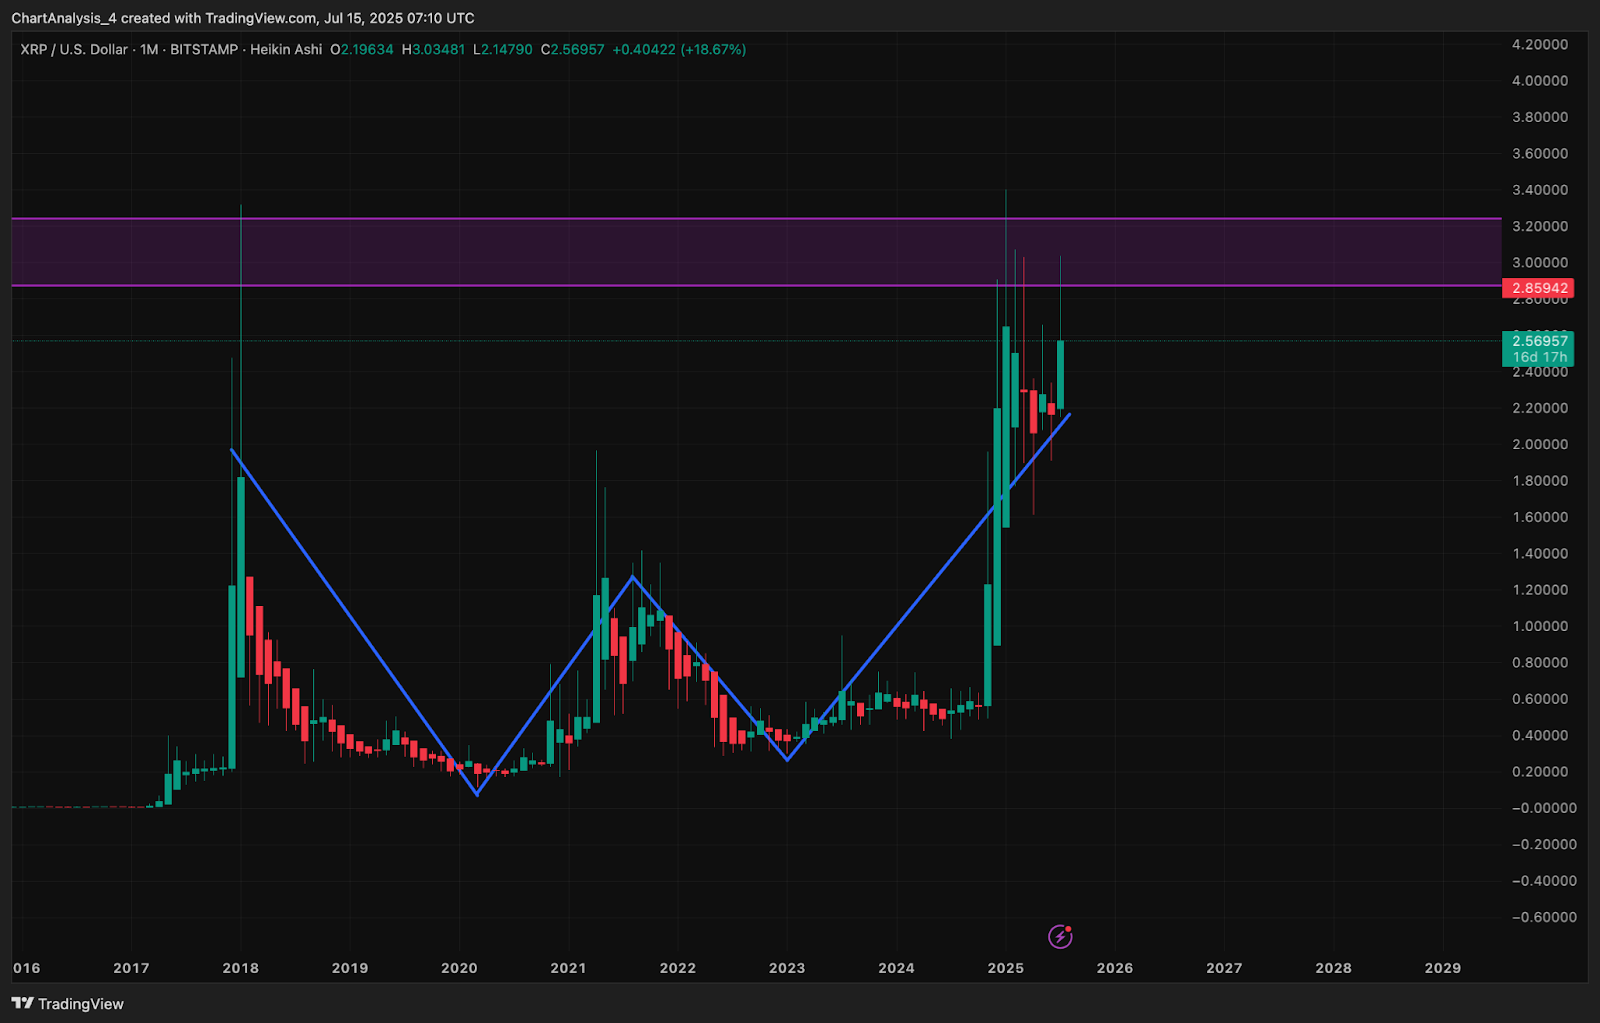
The monthly Heikin Ashi structure also shows a bullish continuation pattern (W pattern), but price has temporarily paused just below the neckline of the previous macro rejection band between $2.95 and $3.20.
If price holds above the current EMA stack, the medium-term trend remains intact. However, a clean close below $2.76 would flip the Bollinger structure neutral and open a deeper retest of $2.65 and $2.58.
XRP Price Prediction: Short-Term Outlook (24H)
XRP price today is likely to consolidate between $2.83 and $2.95 over the next 24 hours, as indicators cool down from the recent vertical move. If price closes a 4-hour candle above $2.91 with volume support, a retest of the $3.03 to $3.10 region becomes viable.
However, failure to defend the $2.83 intraday support zone could trigger a retest of the $2.70 to $2.65 region. This range is structurally important as it contains both EMA50 and the lower Bollinger band.
As long as XRP holds above $2.65 and funding remains positive, the bulls retain structural control. But a drop below $2.58 would shift the focus back toward $2.34 and invalidate the recent breakout.
Disclaimer: The information presented in this article is for informational and educational purposes only. The article does not constitute financial advice or advice of any kind. Coin Edition is not responsible for any losses incurred as a result of the utilization of content, products, or services mentioned. Readers are advised to exercise caution before taking any action related to the company.


