 Price Prediction for July 22")
After an aggressive rally that pushed XRP price from under $2.10 to over $3.66 earlier this month, price action has entered a tightening consolidation structure. Currently, XRP price today sits at $3.50, coiling inside a symmetrical triangle and facing immediate resistance at $3.55. With compression at its peak and volatility building, traders are eyeing a decisive breakout or breakdown in the coming sessions.
What’s Happening With XRP’s Price?
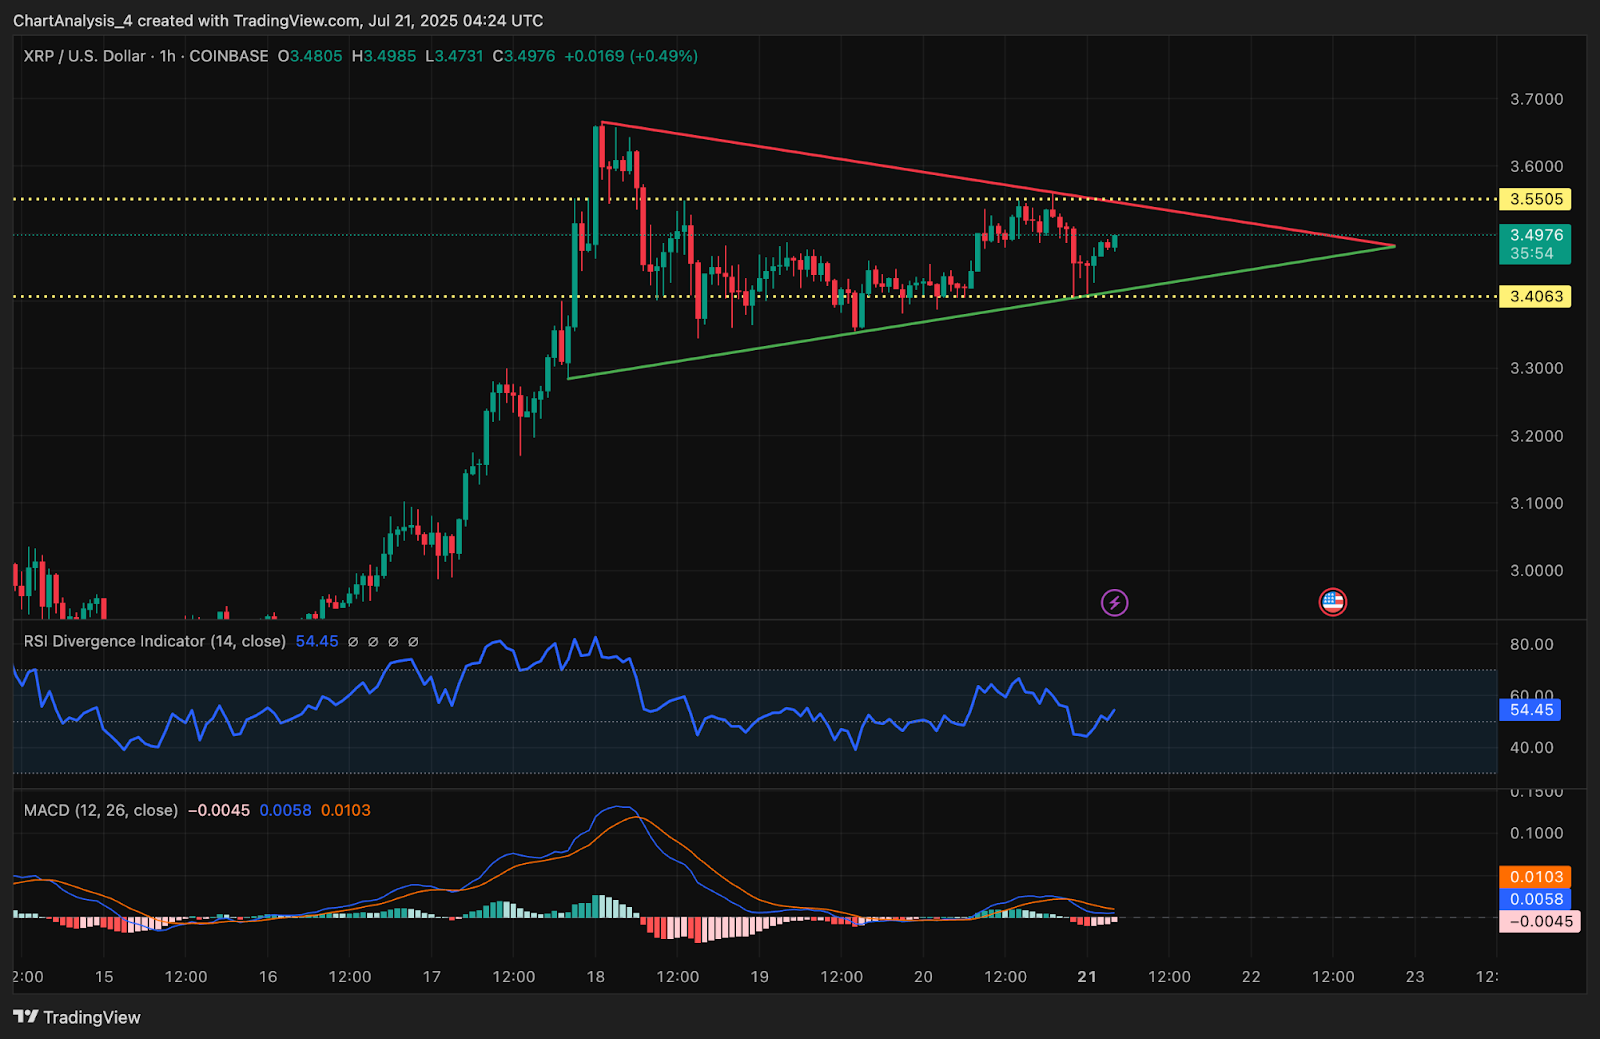
On the hourly timeframe, XRP price action is locked inside a clean symmetrical triangle structure. The upper boundary is marked near $3.55, while the lower support trendline sits around $3.40. The recent consolidation has respected this range tightly, suggesting a volatility expansion is imminent. A breakout above $3.55 could confirm a bullish continuation toward the $3.66 swing high or higher.
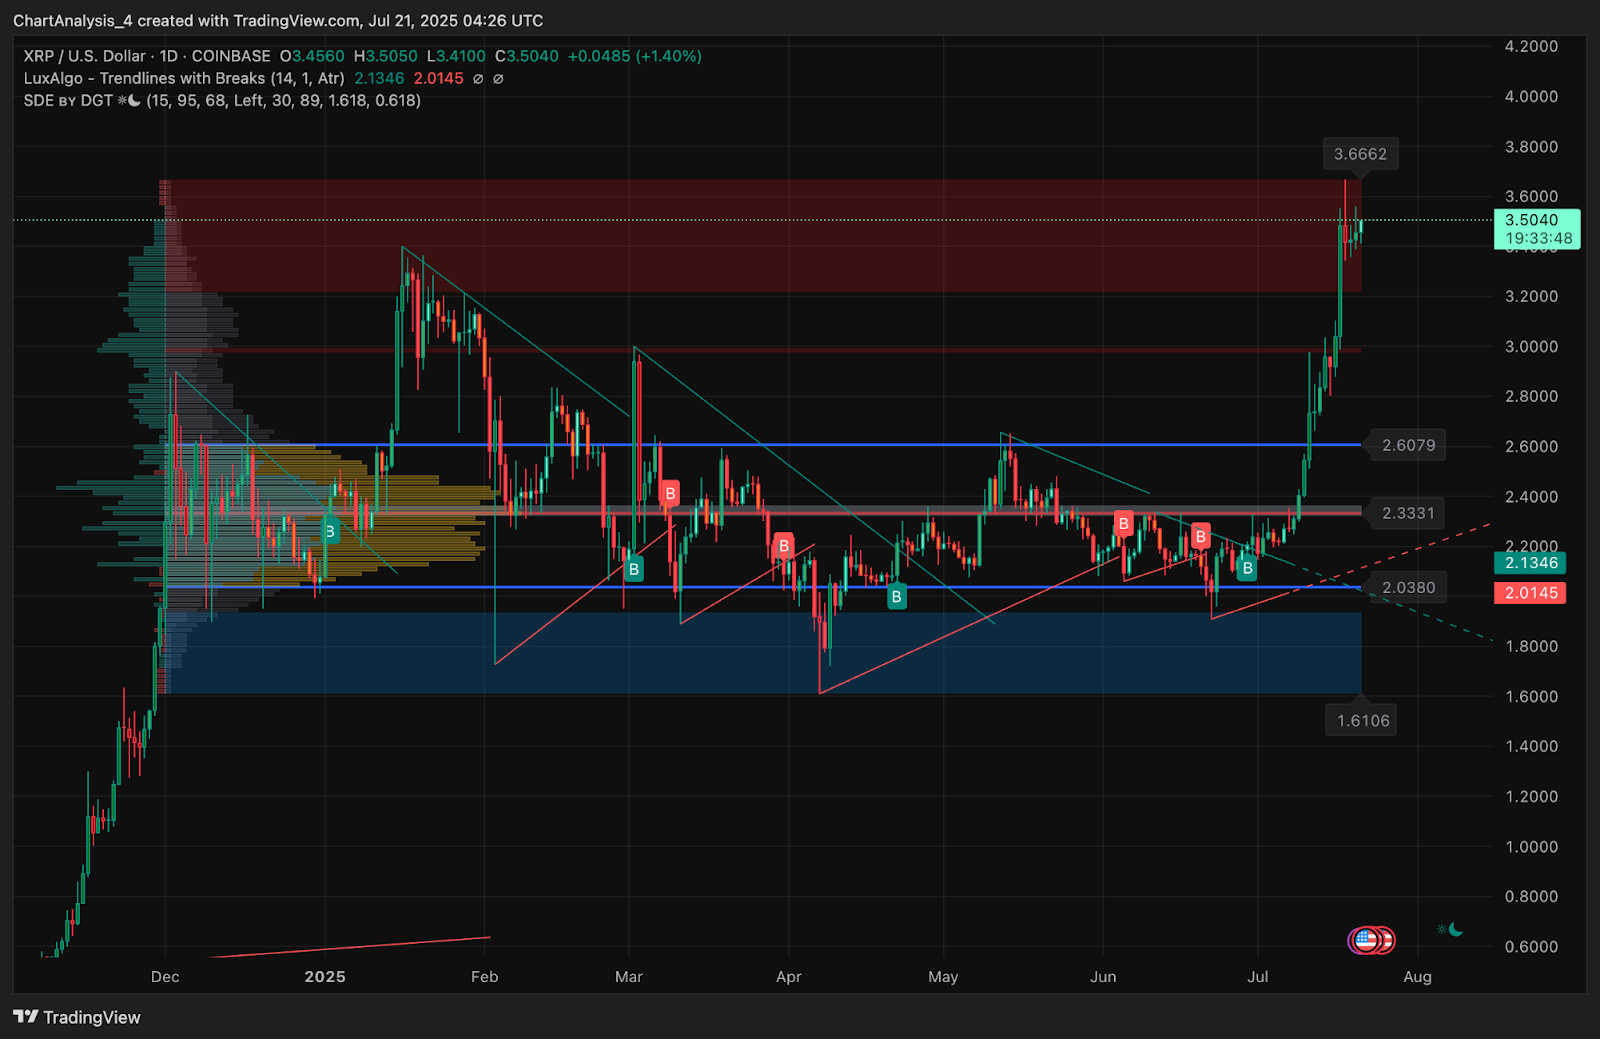
From a broader view, the daily chart shows XRP has cleared major resistance at $2.60 and $2.33 in the past two weeks, triggering a structural reversal. Volume profile analysis also confirms that price has shifted into a low-volume node between $3.30 and $3.60 which is a zone where large directional moves often occur. As of now, XRP is consolidating just beneath this supply zone, signaling that buyers are gradually absorbing selling pressure.
Why Is The XRP Price Going Up Today?
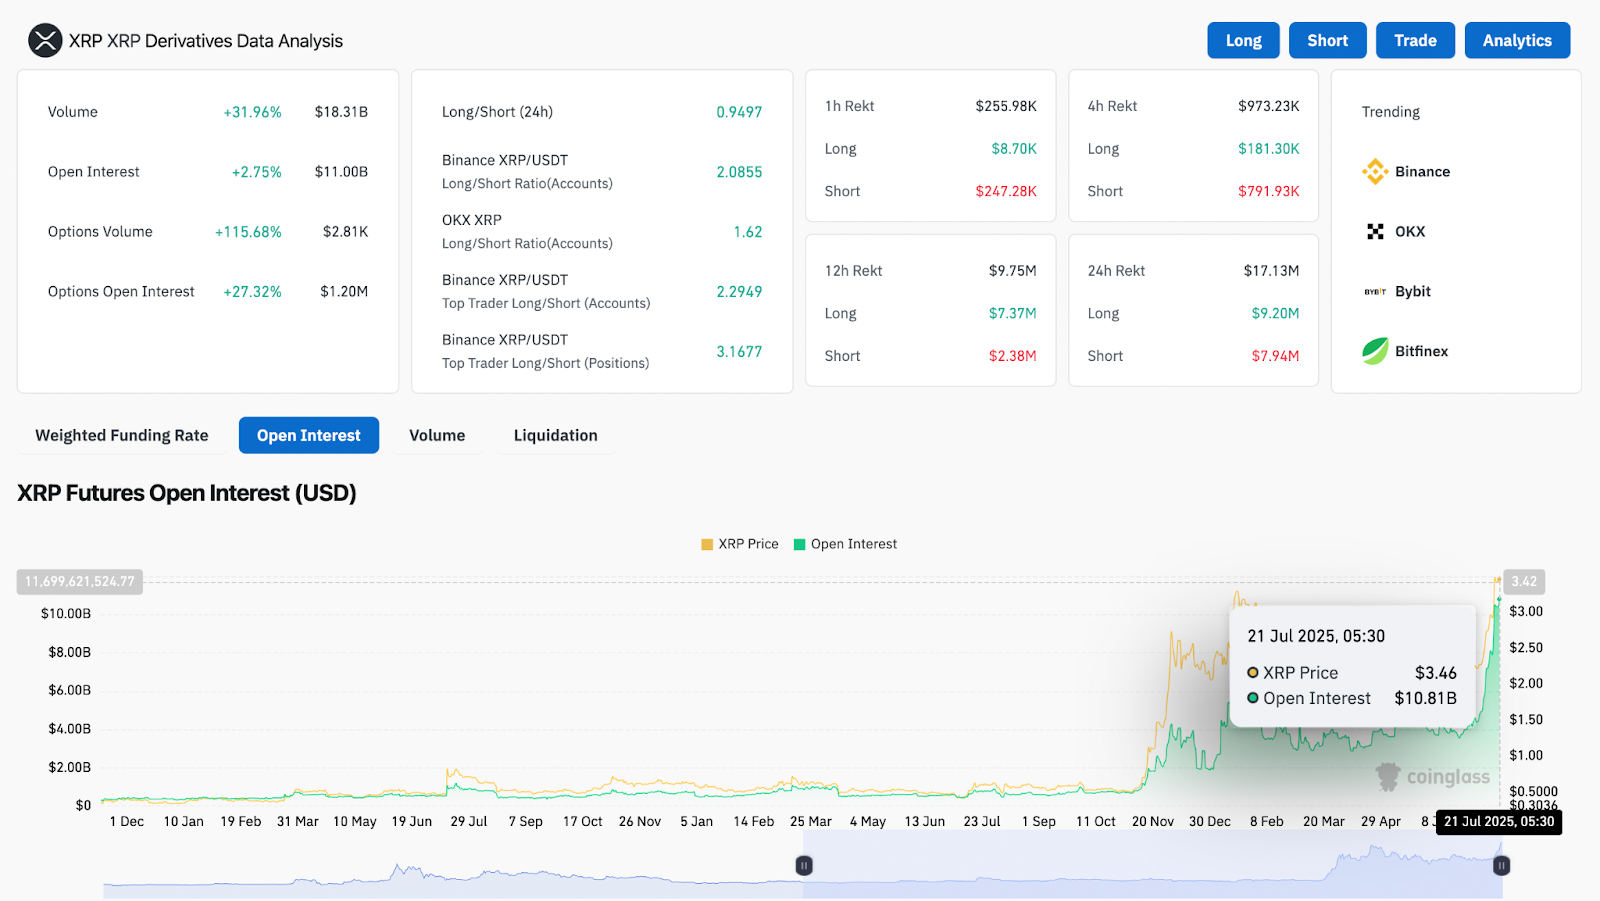
Why XRP price going up today stems from a combination of strong technical consolidation and aggressive accumulation in derivatives and on-chain activity. Coinglass data shows open interest has surged 2.75% to $11.00B, while options volume exploded by over 115%, suggesting aggressive positioning by traders anticipating a breakout.
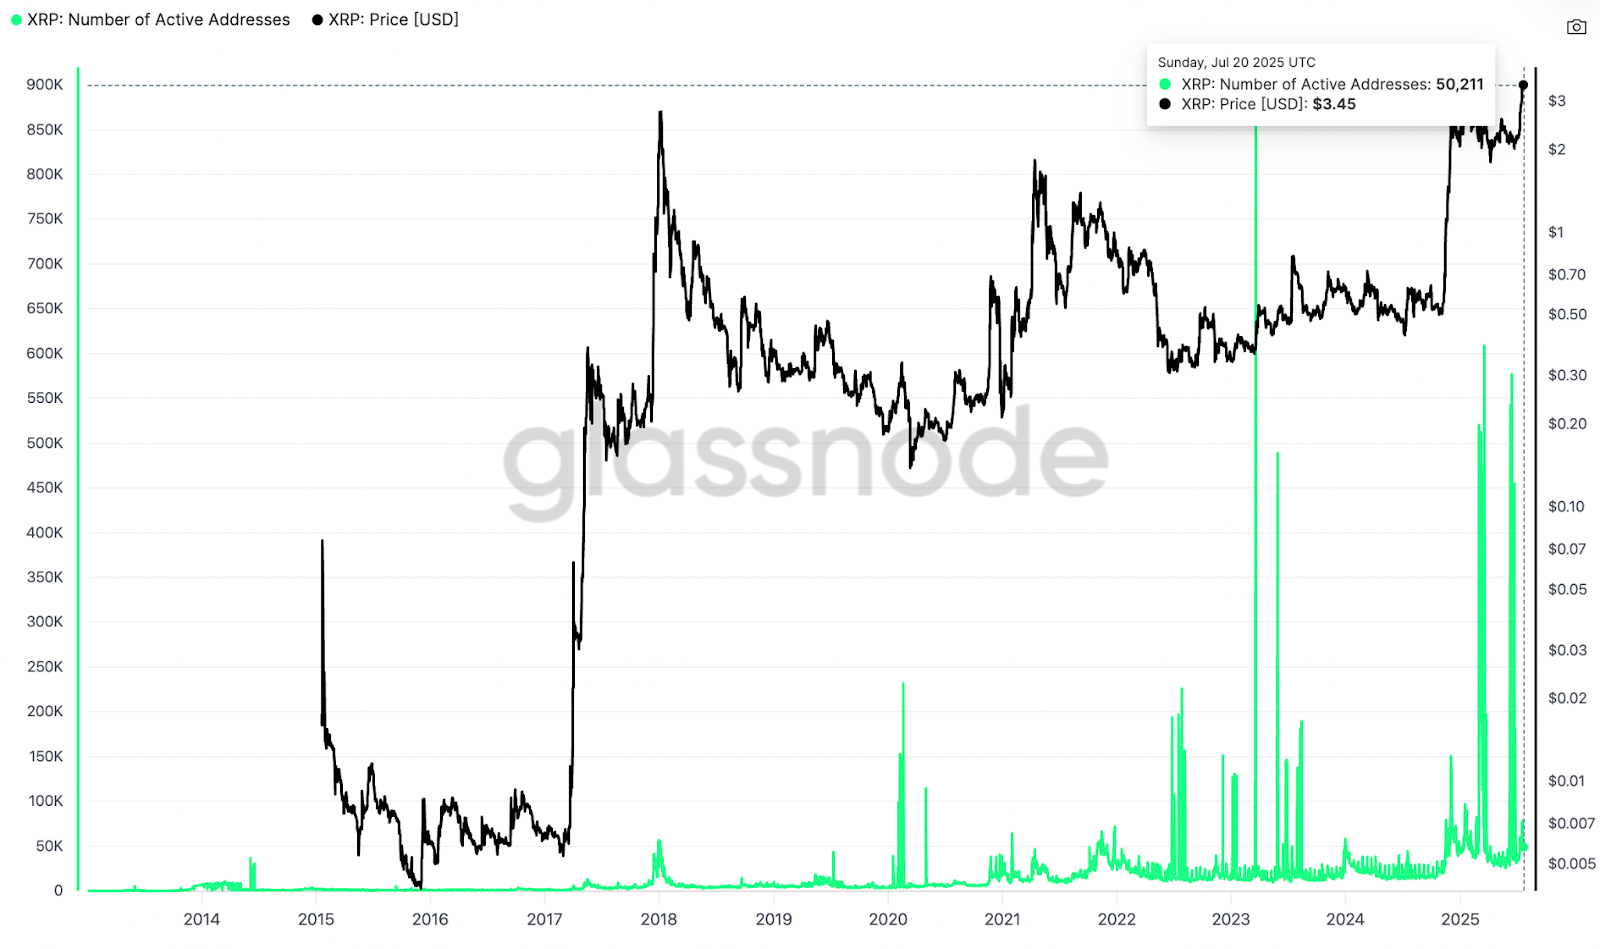
On-chain activity is also rising. According to Glassnode, active addresses reached 50,211 on July 20, the highest daily reading in recent months. This uptick in network usage confirms renewed retail and institutional interest following XRP’s breakout above long-term resistance at $2.60.
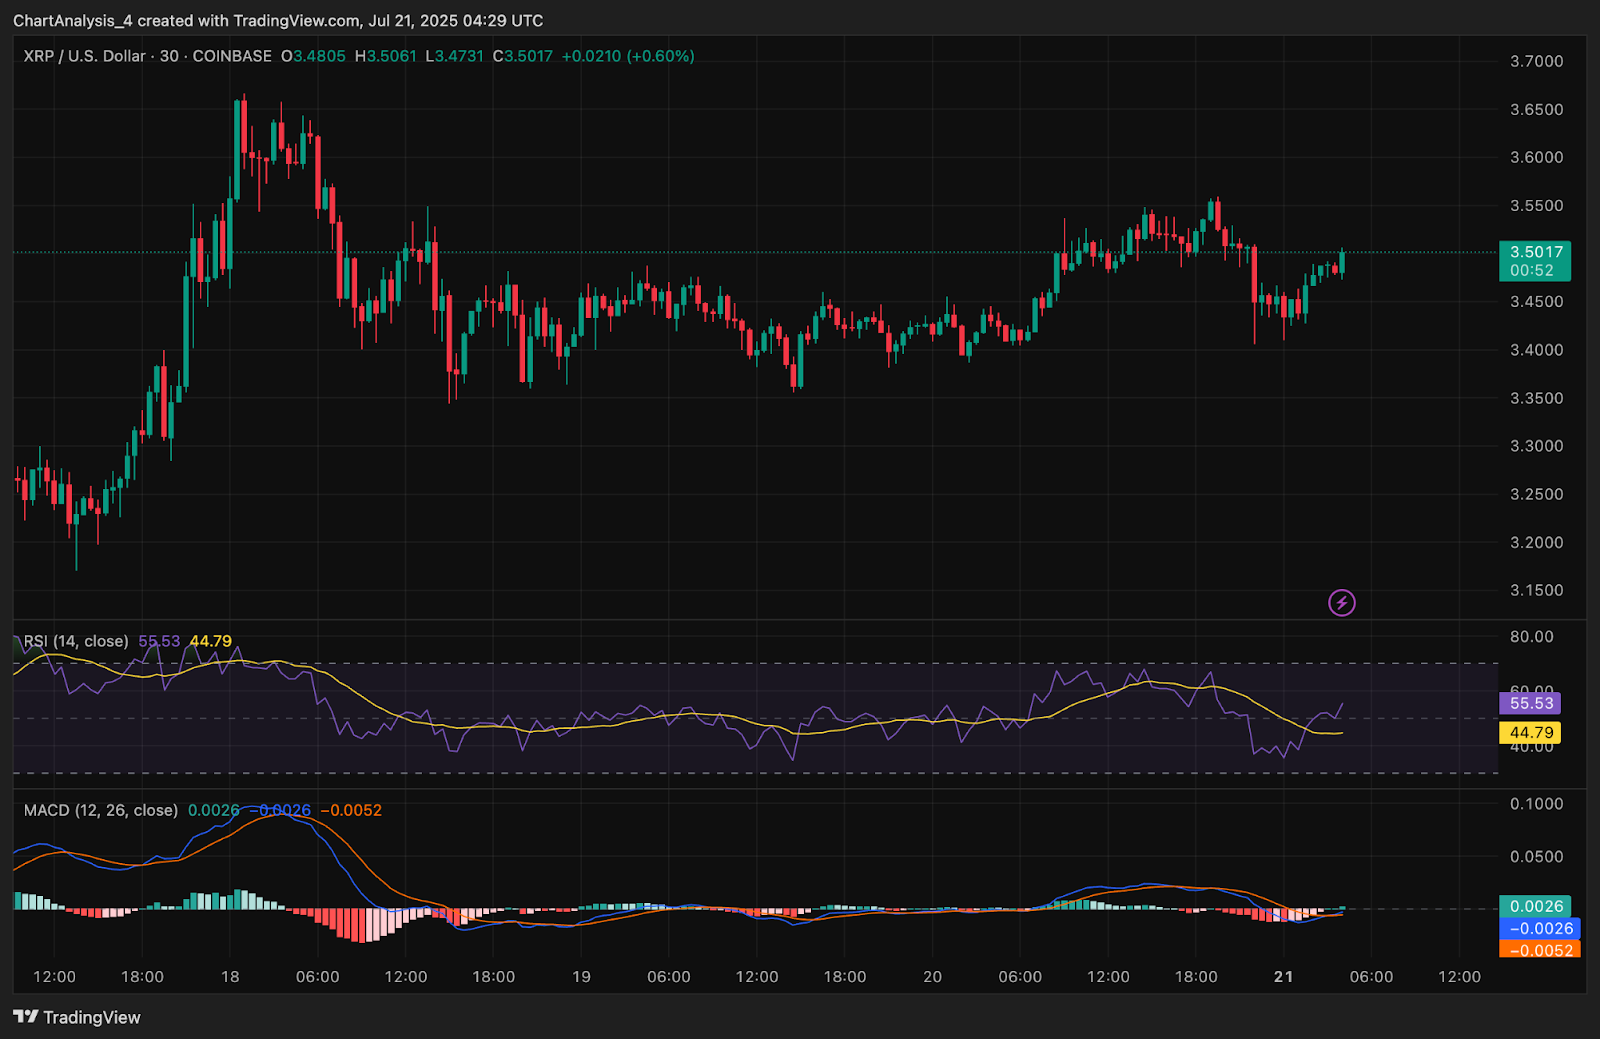
The short-term chart also shows buyers stepping in near the $3.40 zone. RSI on the 30-minute chart has recovered to 55.5 from oversold levels, while MACD is crossing bullishly. These conditions suggest intraday momentum is building just below the breakout threshold.
XRP Price Indicators Signal Squeeze Breakout Opportunity
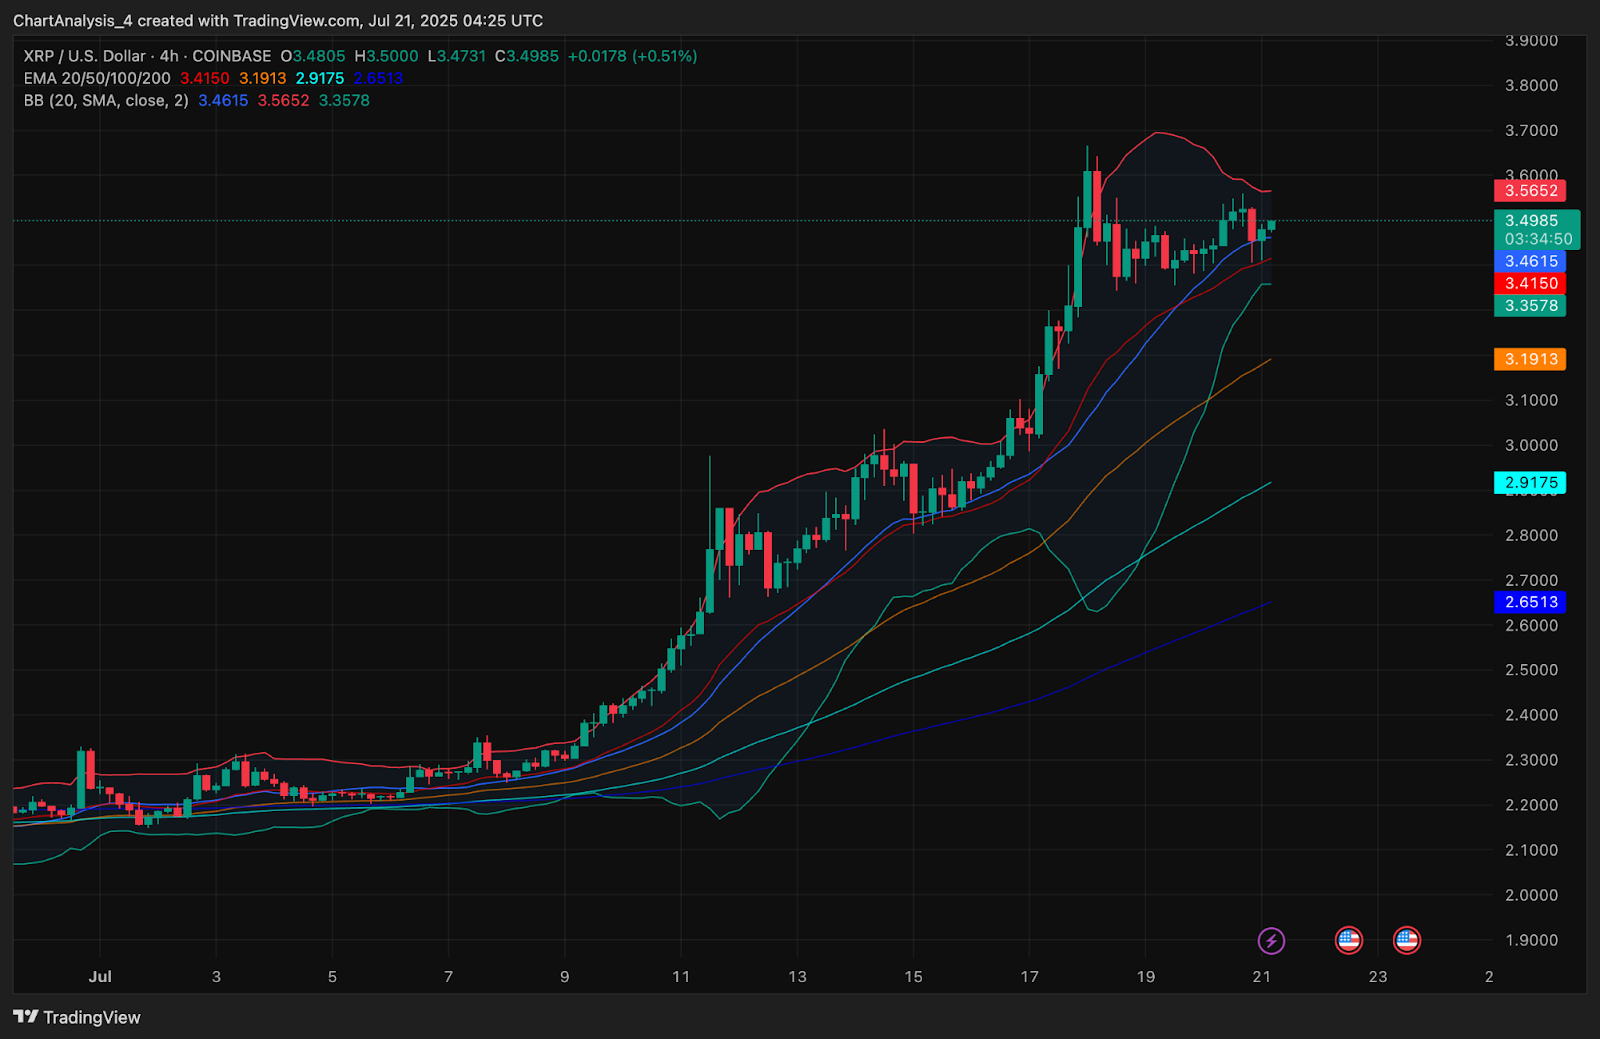
On the 4-hour chart, Bollinger Bands have contracted sharply, with price hovering near the middle band at $3.46. This type of compression is often a precursor to large directional moves. A close above the upper band near $3.56 would trigger a volatility breakout, targeting higher Fibonacci extensions.
The 20/50/100/200 EMAs are all stacked below current price, with the 20 EMA at $3.41 and the 50 EMA at $3.19, reinforcing the bullish momentum structure.
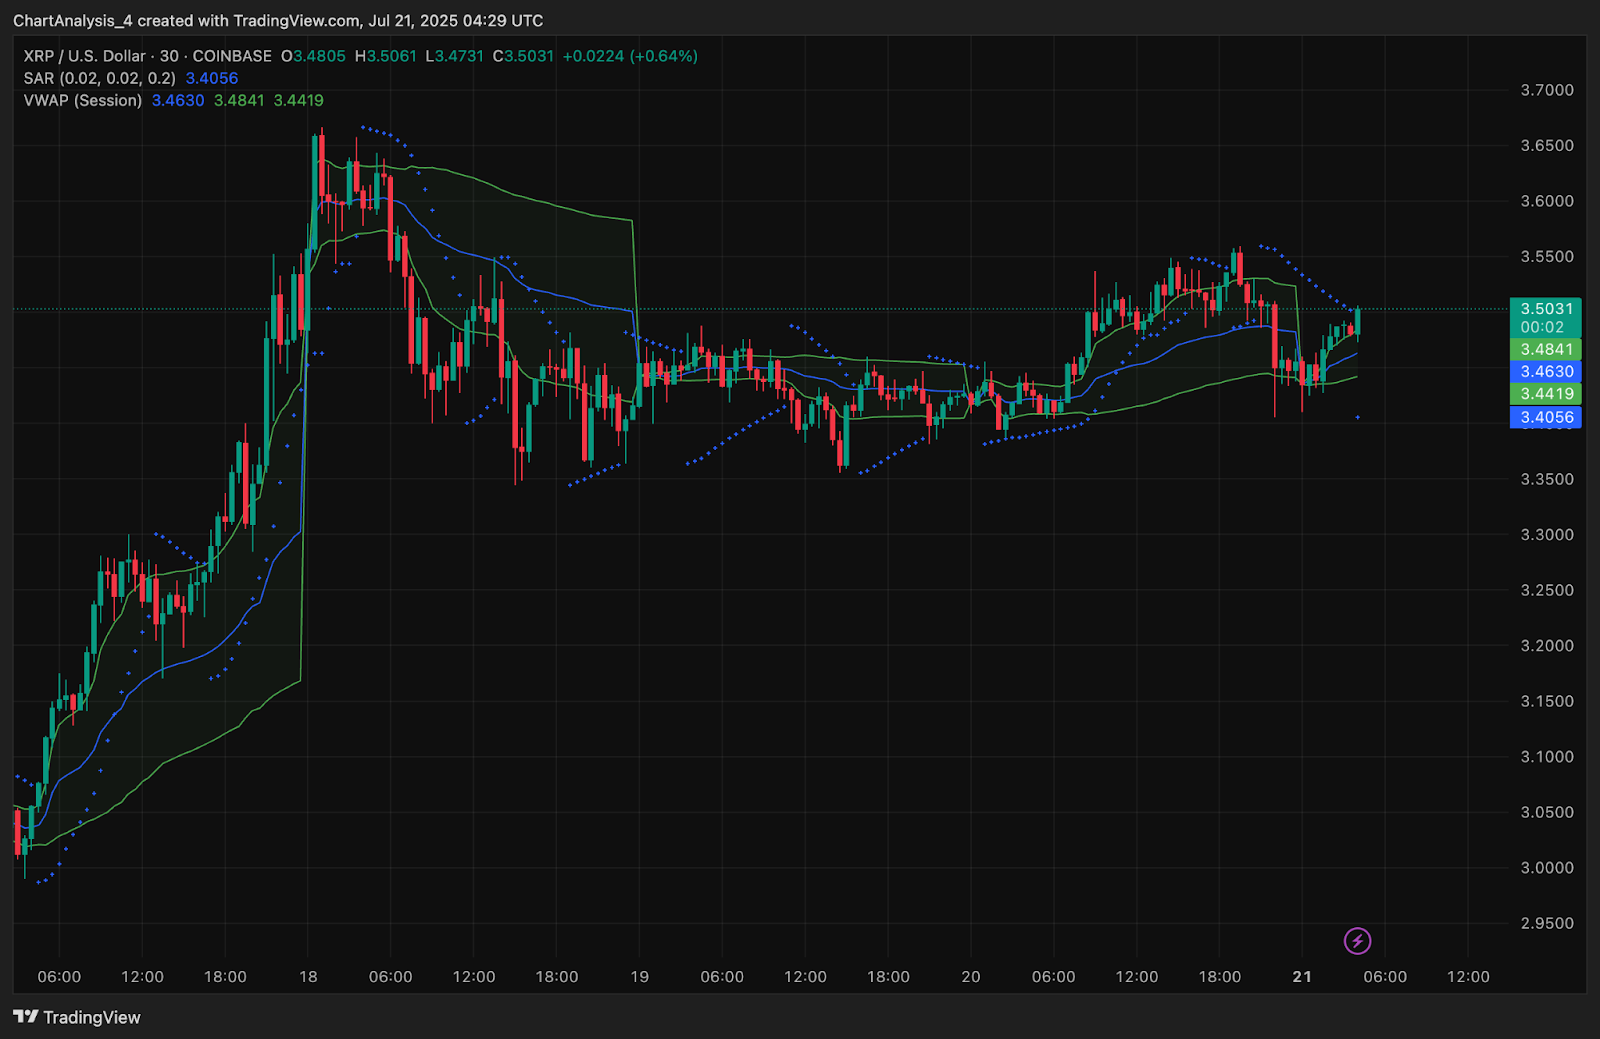
VWAP is also holding steady above $3.44, and the most recent candles are sustaining above it, signaling buyers are in control of intraday order flow. Momentum indicators on both lower and mid timeframes are aligning for an impulsive move if $3.55 is breached.
Additionally, the Parabolic SAR on the 30-minute chart has flipped beneath price, suggesting the short-term bias is now bullish.
XRP Price Prediction: Short-Term Outlook (24H)
If bulls break the $3.55 resistance with convincing volume, XRP could reclaim the recent swing high at $3.66. Beyond that, the next upside targets lie at $3.84 and $4.00, both areas tied to volume imbalances and prior liquidity grabs from late 2021.
On the downside, if XRP loses $3.40, it may retest the $3.30–$3.20 support band where the lower Bollinger Band and EMA confluence provide cushioning. A deeper failure could drag price back toward $2.92.
Given the triangle apex proximity, volume expansion, and supportive indicators, XRP price is approaching a critical breakout point. Traders should closely monitor the $3.55 zone and derivatives volume for breakout confirmation.
XRP Price Forecast Table: July 22, 2025
| Indicator/Zone | Level / Signal |
| XRP price today | $3.50 |
| Resistance 1 | $3.55 (triangle breakout level) |
| Resistance 2 | $3.66 (swing high) |
| Support 1 | $3.40 (triangle base) |
| Support 2 | $3.20 (Bollinger Band & EMA confluence) |
| RSI (30-min) | 55.5 (mild bullish) |
| MACD (30-min) | Bullish crossover |
| Bollinger Bands (4H) | Tight range, breakout setup |
| EMA Cluster (4H) | 20/50/100/200 stacked bullish below |
| VWAP (Session) | $3.44 (price above) |
| Parabolic SAR (30-min) | Flipped bullish |
| Volume Profile (Daily) | Thin zone $3.30–$3.60 (expansion likely) |
| Derivatives OI | $11.00B (+2.75%), rising interest |
| Active Addresses | 50,211 (Glassnode, July 20) |
Disclaimer: The information presented in this article is for informational and educational purposes only. The article does not constitute financial advice or advice of any kind. Coin Edition is not responsible for any losses incurred as a result of the utilization of content, products, or services mentioned. Readers are advised to exercise caution before taking any action related to the company.


 Price Prediction: Weak Momentum Signals Possible Drop to $62K")

 Price Prediction for April 2026: Will Chainlink Move Higher?")