
After rallying over 80% in the past two weeks, XRP price is showing signs of short-term exhaustion. XRP price today is trading near $3.45, down nearly 3% on the day, as bulls lose grip near the upper boundary of a major supply zone. The token is now testing crucial structural support with indicators suggesting mixed momentum.
What’s Happening With XRP’s Price?
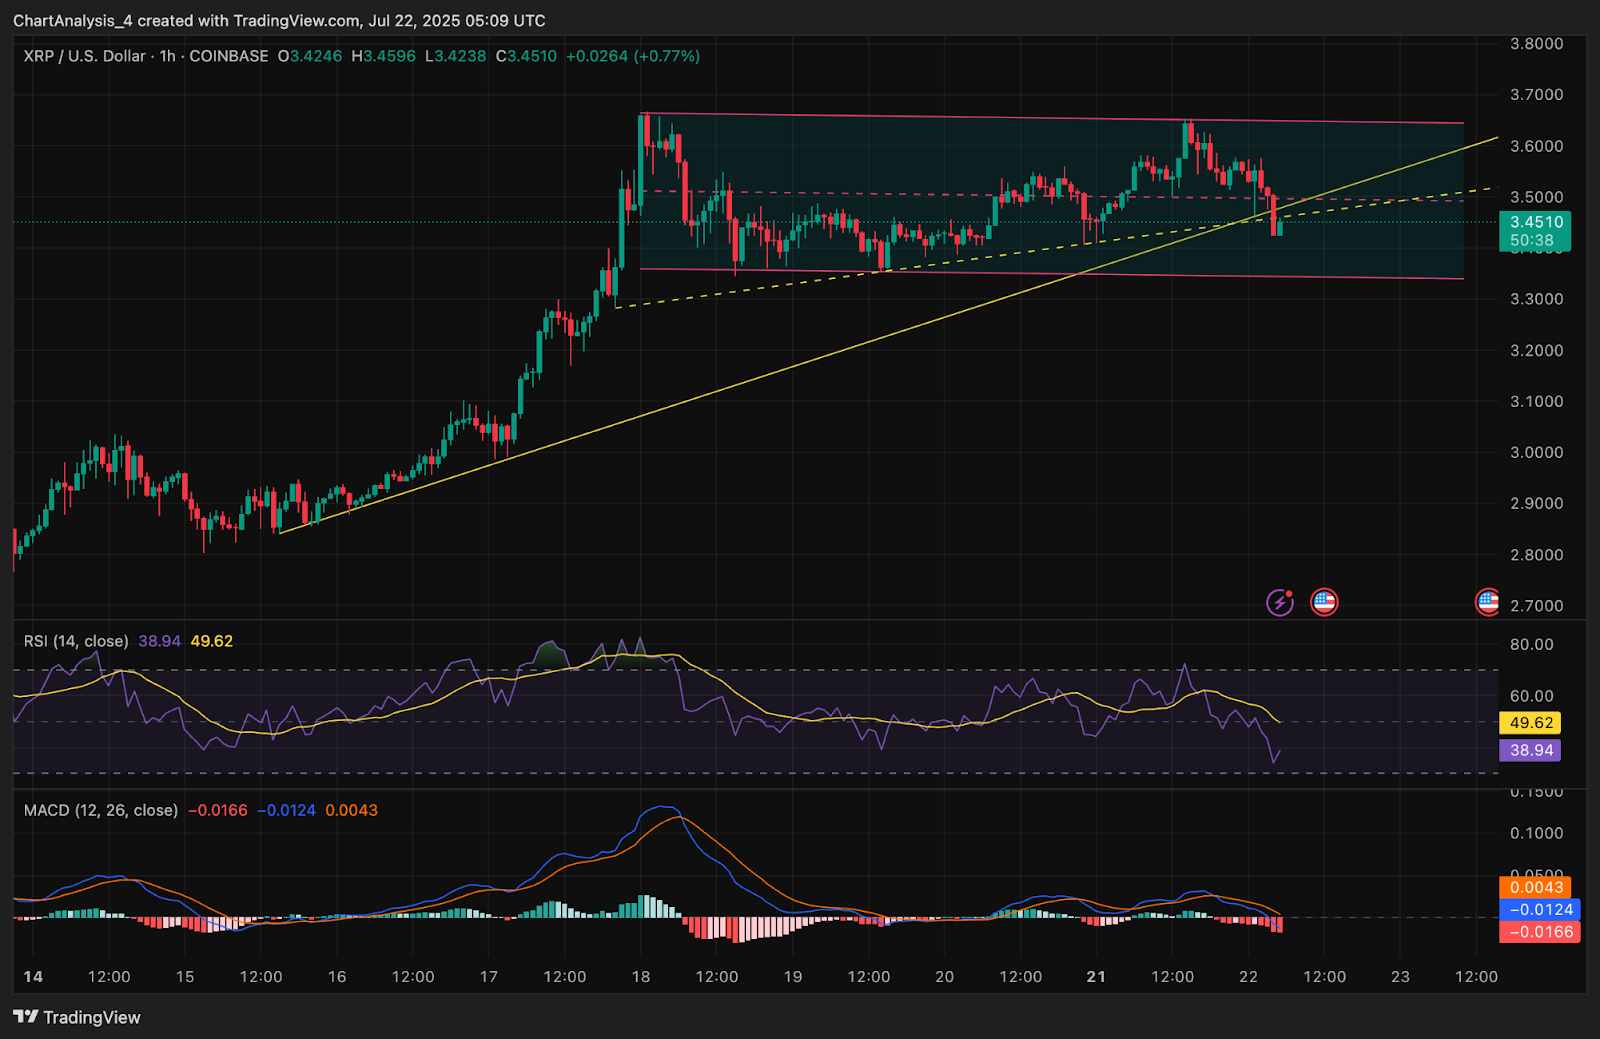
XRP’s intraday structure shows a clear breakdown below a short-term ascending trendline visible on the 1-hour chart. The move follows a double rejection near $3.66, which aligns closely with the top of the red supply zone marked on the daily chart. Price has now fallen back into the previous consolidation band between $3.35 and $3.58.
RSI on the 1-hour chart has dropped to 38.94, suggesting weakening bullish pressure, while MACD shows a fading bullish crossover with histogram bars sliding toward negative territory. The rejection also invalidated the rising channel, and price is now testing the base of a horizontal range.

The 4-hour chart confirms this with XRP trading below the 20 EMA ($3.4690) and just above the 50 EMA at $3.2658. Bollinger Bands are tightening, indicating a potential volatility expansion. With candles beginning to pierce the lower band ($3.37), there is risk of a sharper retracement if buyers do not step in.
Why Is The XRP Price Going Down Today?

Why XRP price going down today can be attributed to rejection from a historically strong supply zone and weakening internal momentum. The daily chart shows XRP hitting a red volume cluster between $3.58 and $3.66, the same area that marked a long-term top earlier in 2024. The inability to break and close above this band triggered profit-taking and a wave of short orders.
Volume Profile confirms this resistance, with the POC aligning just below $3.60. Meanwhile, Smart Money Concepts suggest price is entering a mid-cycle correction. Trendline breaks and failure to hold recent CHoCH levels indicate a likely shift in short-term flow.
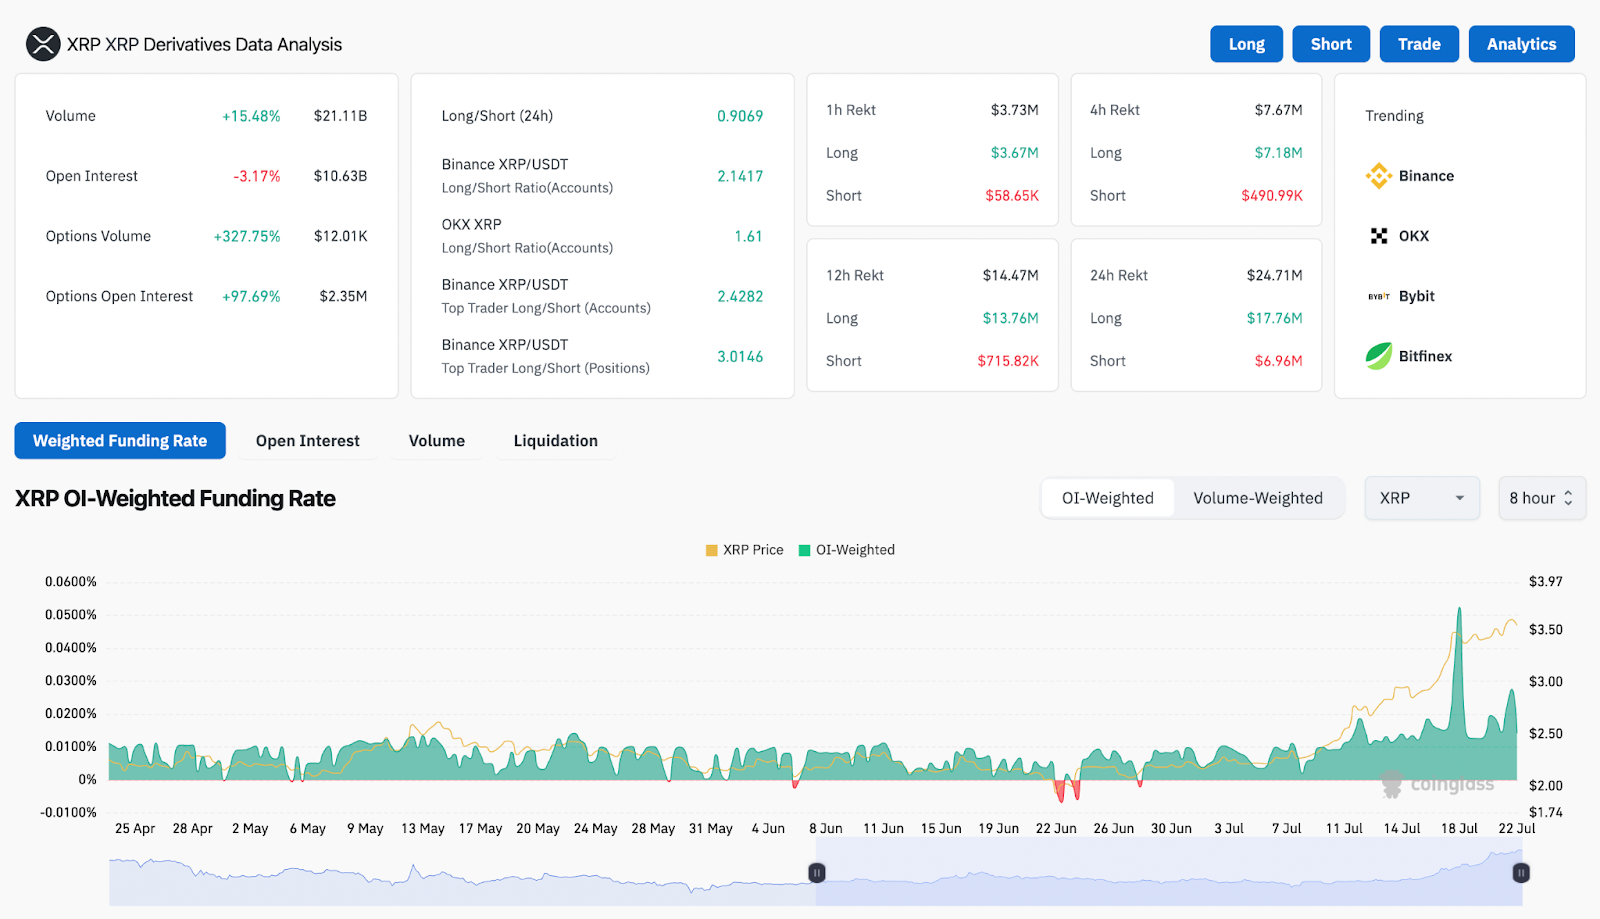
Derivatives data from Coinglass shows a -3.17% drop in open interest (to $10.63B), even as volume rose by 15.48% to $21.1B. This indicates participants are closing long positions while engaging in short-term trades. Notably, the Binance top trader long/short ratio sits at 3.01, showing a strong long bias despite price weakness, a setup that often precedes forced liquidations if support fails.
Supertrend Support and Bearish Divergences Confirm Caution

The 2-hour Supertrend has just flipped bearish below $3.4352. Price is currently hovering near this level, and a clean break below could confirm a downside continuation. The DMI indicator also reinforces this signal, with ADX rising while +DI weakens, suggesting trend strength but no buyer dominance.
Ichimoku structures show XRP breaking below the Tenkan-Sen and approaching Kijun support near $3.37 on the 4-hour timeframe. The bearish tilt will solidify further if price sustains below the EMA cluster, which is currently compressing around $3.46–$3.37.
On the downside, the green support blocks from previous breakouts are clustered between $3.00 and $3.10. A breakdown through $3.35 could accelerate a move toward this demand zone.
XRP Price Prediction: Short-Term Outlook (24H)

If XRP price today loses the $3.43–$3.45 zone decisively, the immediate next target lies at $3.33, followed by $3.10. A break below this level would expose the $2.98–$3.00 demand cluster supported by the 100 EMA on the 4-hour chart.
On the flip side, if bulls reclaim $3.50 with strength, a retest of $3.60 could unfold quickly. But to resume the broader uptrend, XRP must close above $3.66 with high volume, a scenario not currently supported by momentum or funding data.
Given the divergence in volume versus positioning, traders should prepare for volatility and closely monitor whether price can hold above $3.43. If not, deeper retracements could materialize.
XRP Price Forecast Table: July 23, 2025
| Indicator/Zone | Level / Signal |
| XRP price today | $3.45 |
| Resistance 1 | $3.58 |
| Resistance 2 | $3.66 (supply zone top) |
| Support 1 | $3.35 |
| Support 2 | $3.10 |
| RSI (1H) | 38.94 (bearish divergence) |
| MACD (1H) | Weakening bullish crossover |
| Bollinger Bands (4H) | Tightening, testing lower band |
| EMA Cluster (4H) | Price below 20 EMA, near 50 EMA |
| Supertrend (2H) | Flipped bearish at $3.4352 |
| DMI (2H) | ADX rising, buyers losing strength |
| Volume Profile Resistance | $3.58–$3.66 (strong supply) |
| Open Interest (Coinglass) | $10.63B (-3.17%), volume up 15.48% |
| Binance Top Trader Ratio | 3.01 (long-heavy, risk of liquidation) |
Disclaimer: The information presented in this article is for informational and educational purposes only. The article does not constitute financial advice or advice of any kind. Coin Edition is not responsible for any losses incurred as a result of the utilization of content, products, or services mentioned. Readers are advised to exercise caution before taking any action related to the company.


