 Price Prediction for July 24")
XRP price is trading around $3.48 on July 23 after surging past the $3.20 and $3.00 resistance levels earlier this week. This move followed a clean breakout from a multi-month descending structure, as shown on the daily chart. Price has now entered consolidation just below the $3.62 mark, forming a bullish pennant that could precede another impulsive leg higher.
What’s Happening With XRP’s Price?
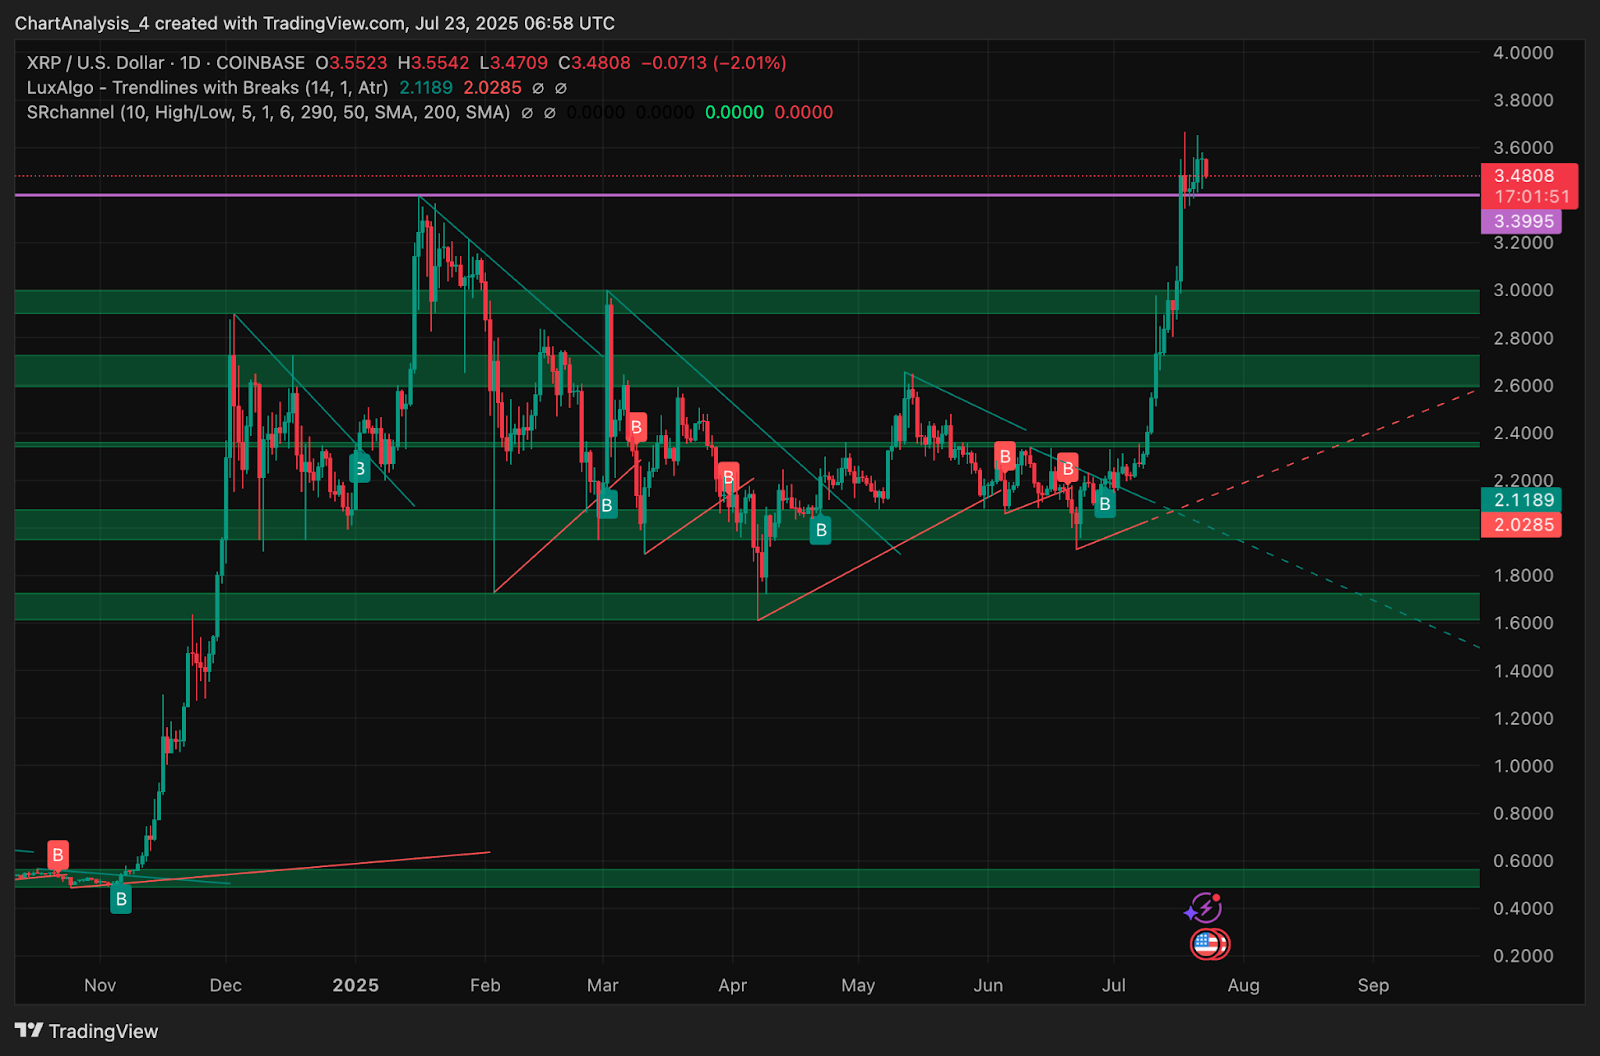
The daily chart shows a sharp rally from below $2.10 to $3.55, triggered by a breakout from a falling wedge that had trapped XRP for over two months. Since breaching key resistance near $2.80, XRP price has been respecting higher demand zones and is now trading within a tight flag-like consolidation structure.
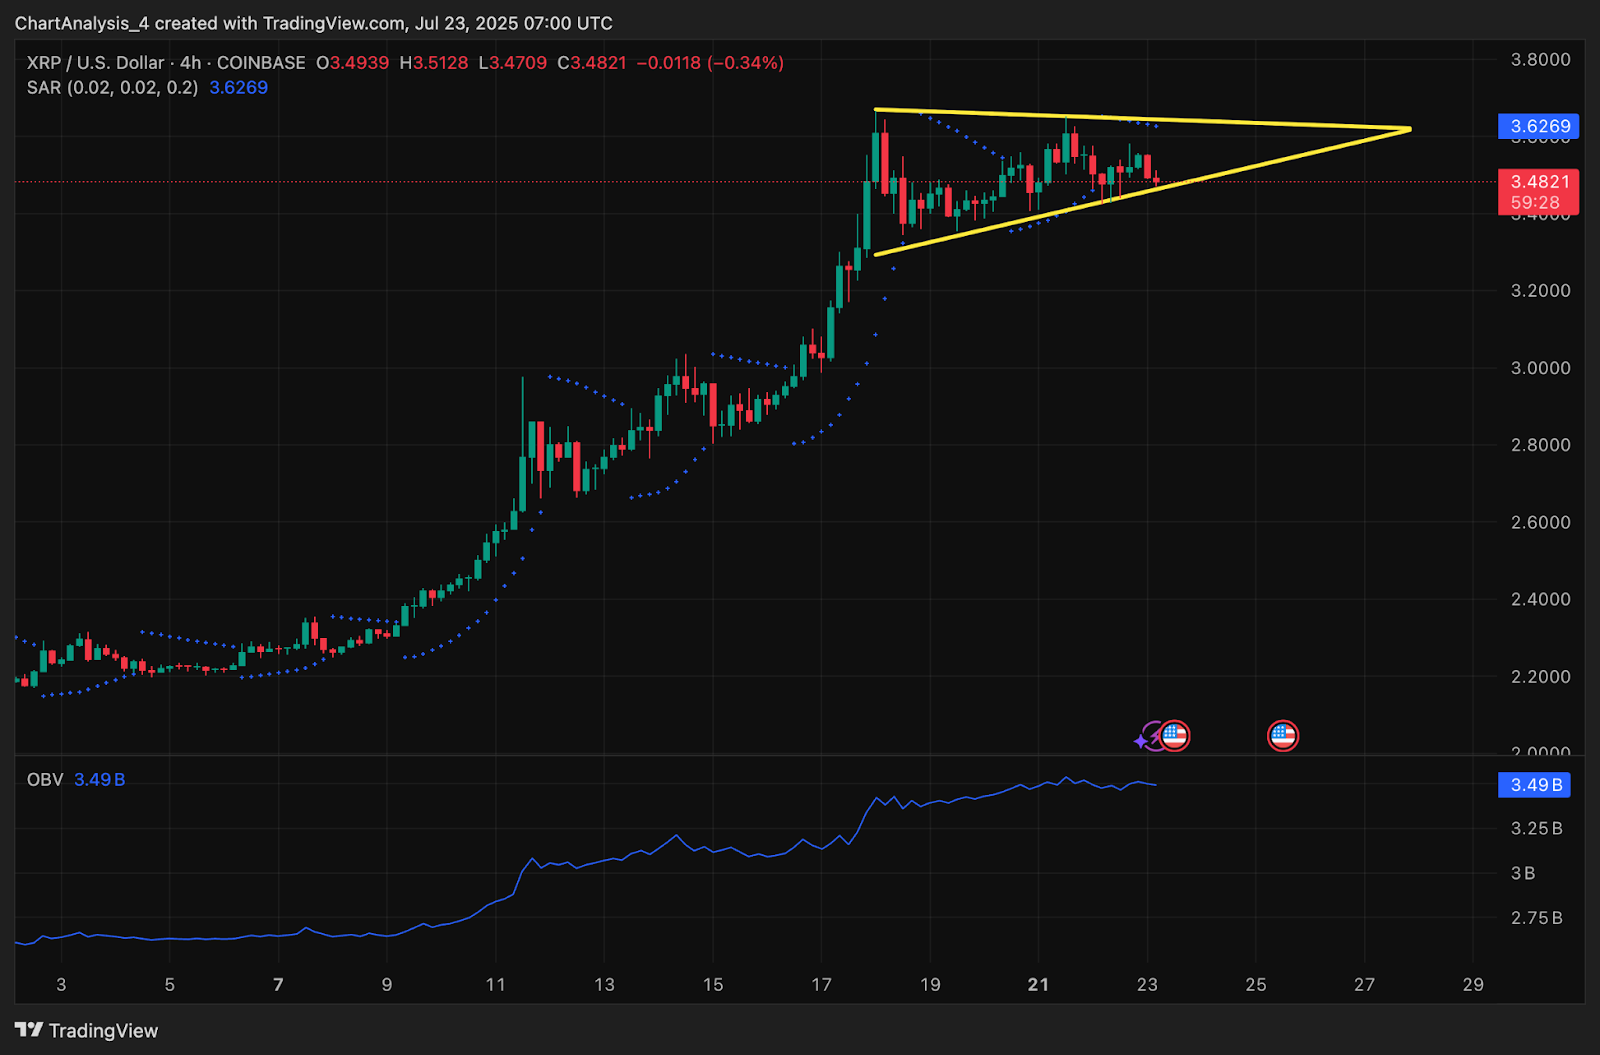
On the 4-hour chart, XRP is compressing inside a symmetrical triangle or bullish pennant, with resistance near $3.62 and support trending higher from $3.35. This structure is typical of post-breakout pauses before a continuation move. Parabolic SAR dots are beginning to flatten above the price, reflecting cooling momentum, but not yet a reversal.
Meanwhile, On-Balance Volume (OBV) remains elevated at 3.49 billion, supporting the idea that the current move is backed by strong accumulation rather than speculation.
Why Is The XRP Price Going Down Today?
Why XRP price going down today is largely tied to short-term profit-taking near the upper triangle resistance. Price briefly tagged $3.55 before pulling back modestly, as shown on the 30-minute and 4-hour charts. The rejection from VWAP resistance at $3.52 and mid-band rejection from Bollinger Bands suggest intraday traders are reducing exposure.
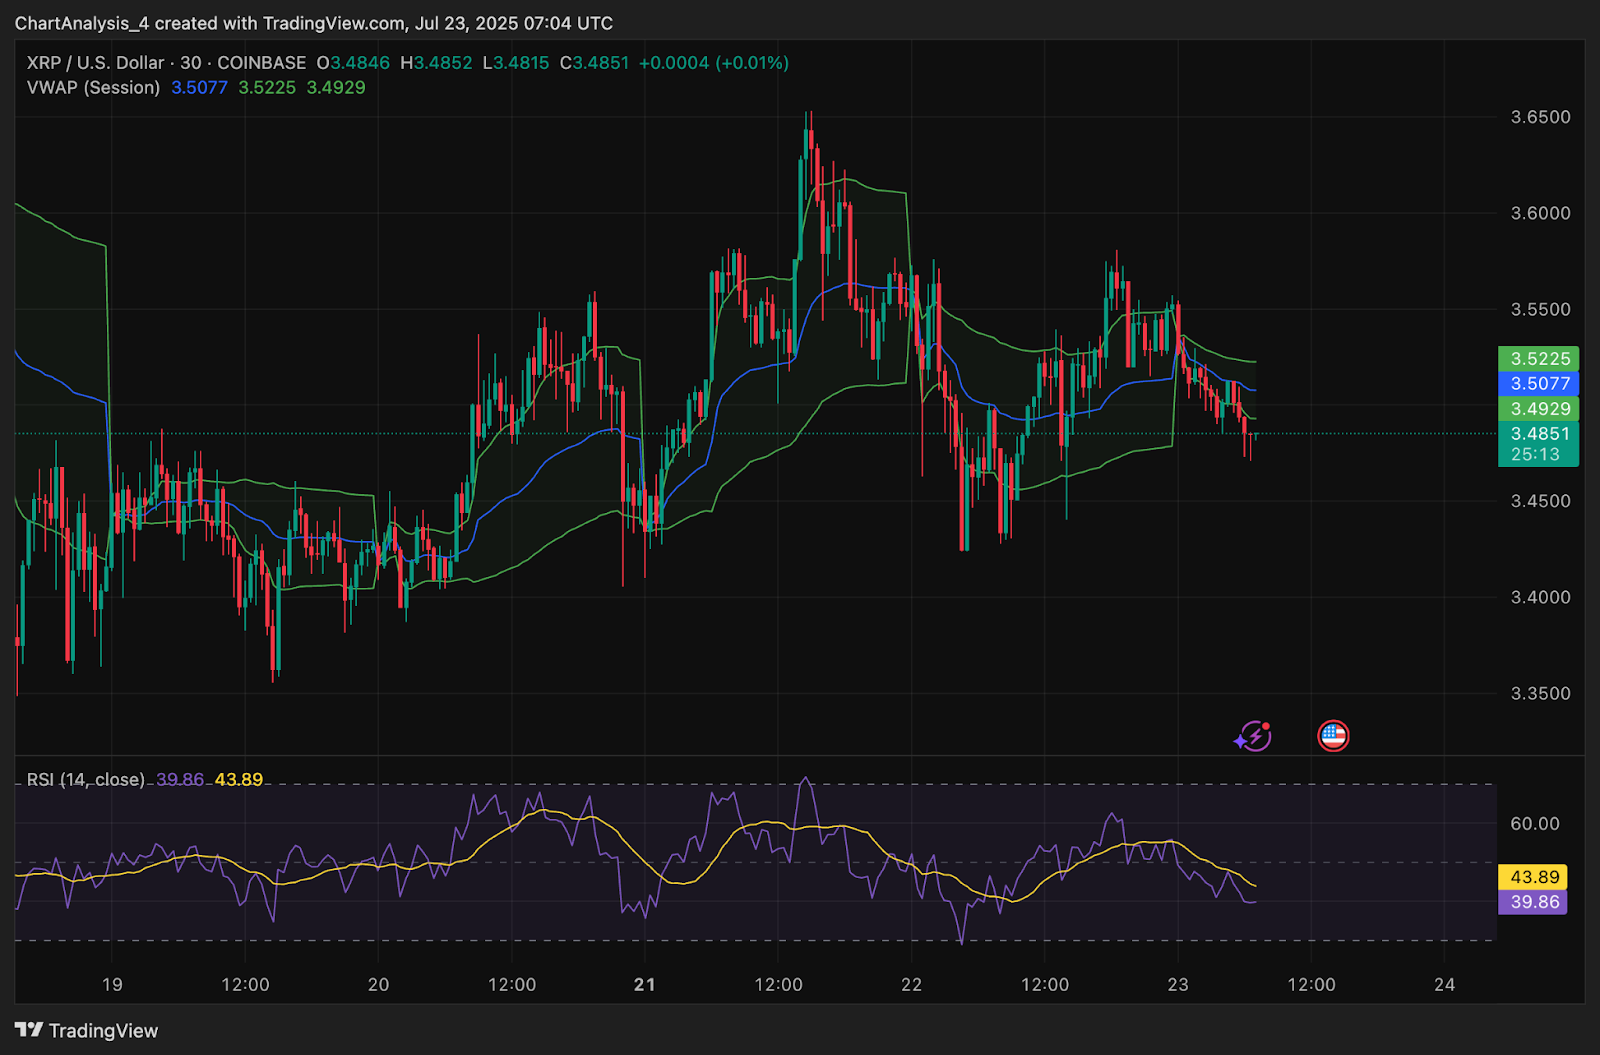
The RSI has slipped to 39.8 on the 30-minute chart, pointing to a bearish divergence, while MACD has flattened and crossed into slight negative territory. DMI also shows the +DI line fading against a steady -DI, with ADX weakening. These are classic signs of a minor intraday pullback or cooling phase.
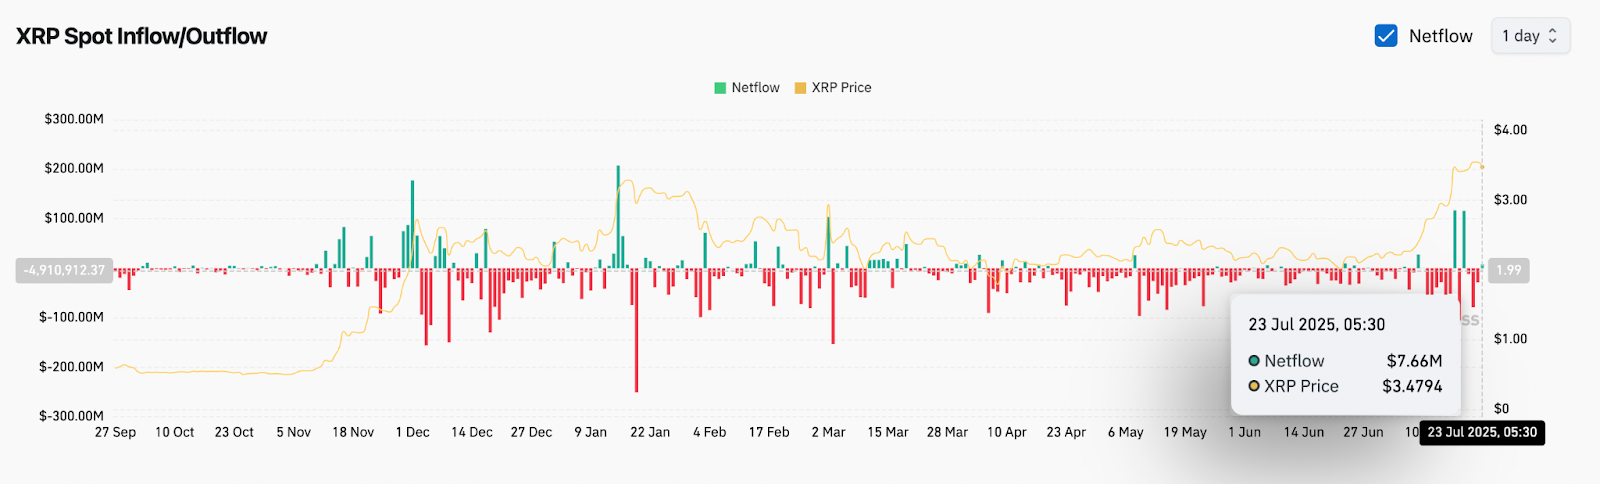
However, broader sentiment remains supportive. Spot netflow data shows +$7.66M in positive flow, and the price has held firmly above prior demand blocks. Unless XRP breaks below $3.32, the correction appears contained.
EMAs and Indicators Confirm Bullish Underpinning
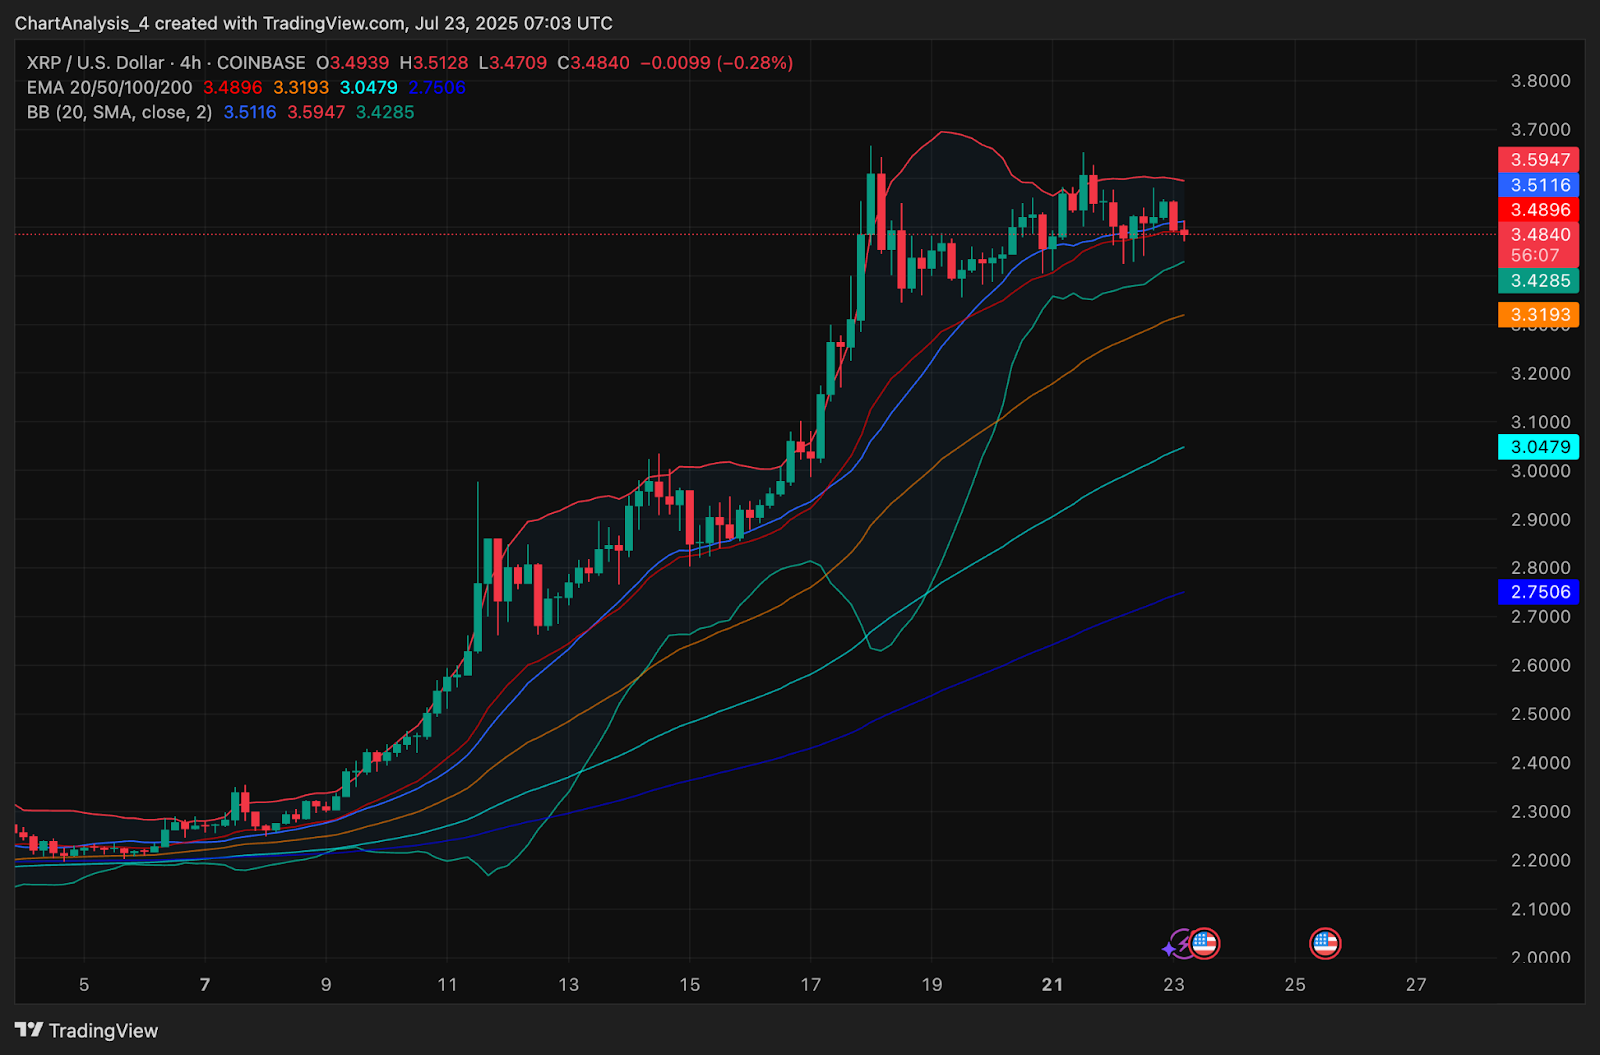
The 4-hour chart shows XRP trading above all major exponential moving averages. The 20 EMA is at $3.48 and currently acting as dynamic support, while the 50 EMA at $3.31 and 100 EMA at $3.04 offer further backing below. The 200 EMA at $2.75 confirms that XRP is well above its macro trend base.
Bollinger Bands are beginning to narrow again, following a prior expansion. Price is currently hugging the middle band, which sits around $3.48. A breakout from the triangle structure accompanied by renewed Bollinger Band widening would mark the next major leg up.
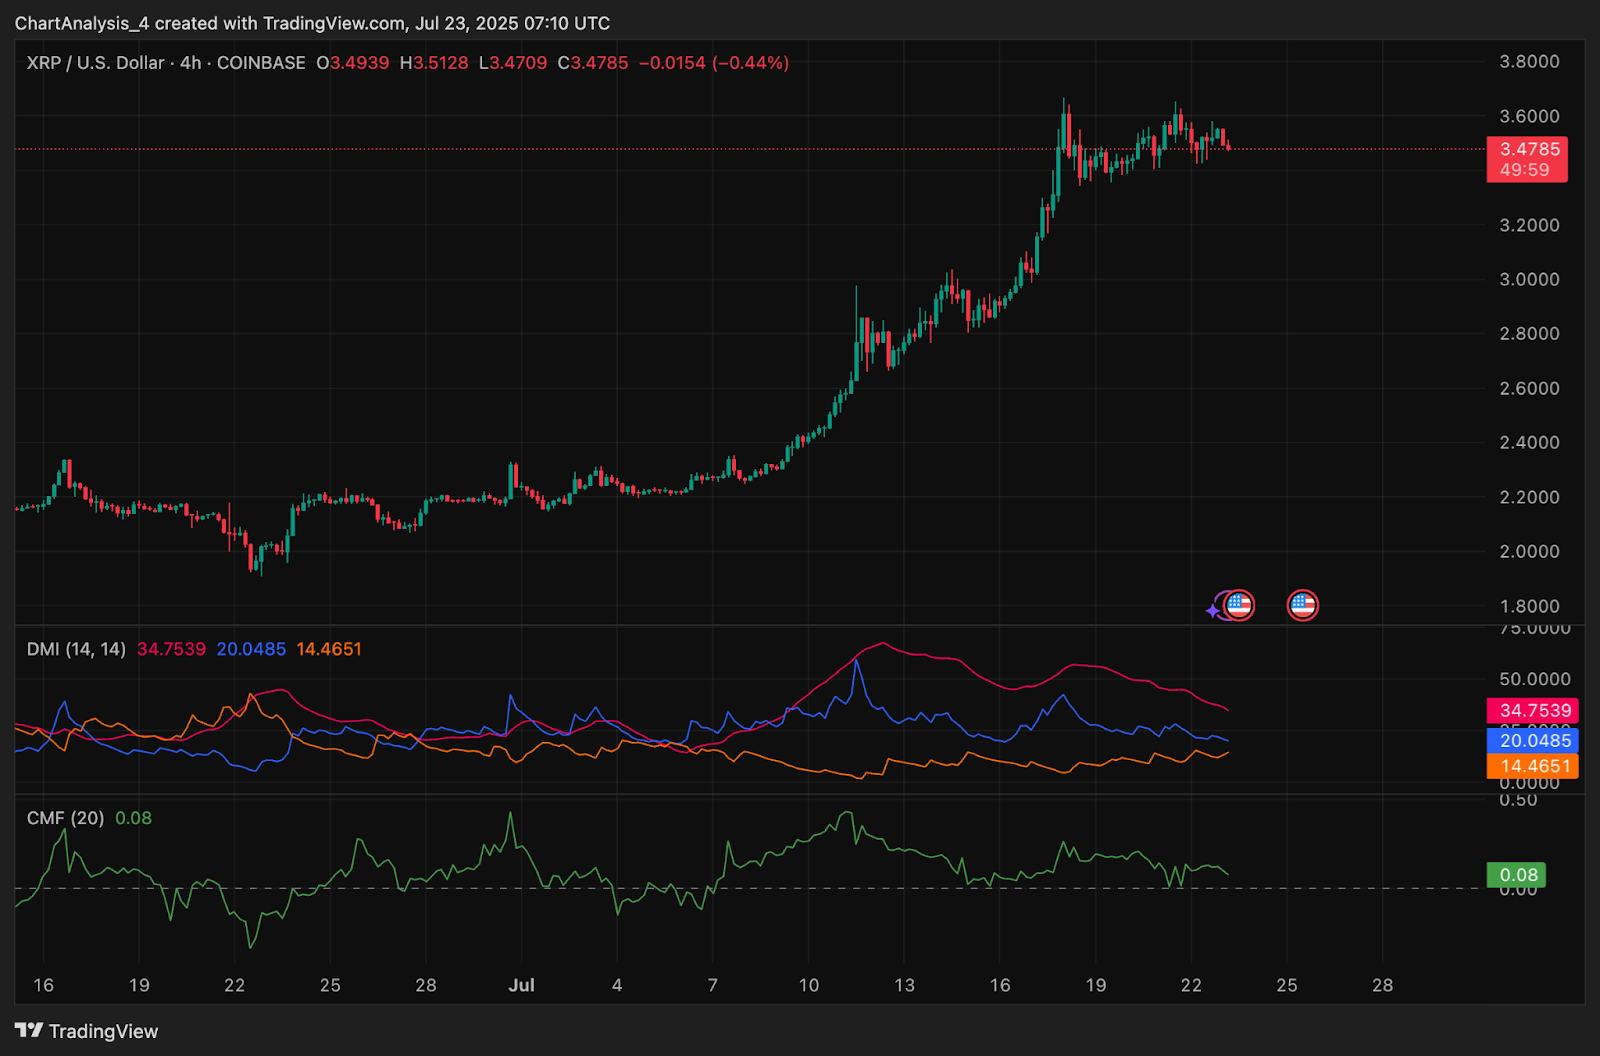
Parabolic SAR and VWAP remain in flux, but volume behavior continues to reflect a healthy consolidation environment. The Chaikin Money Flow (CMF) also prints a positive 0.08, indicating capital remains net-inflowed despite the pause in momentum.
XRP Price Prediction: Short-Term Outlook (24H)
In the immediate term, a confirmed break above the $3.62 pennant resistance would likely trigger a move toward $3.88 and potentially $4.00, where a major psychological and technical barrier awaits. Traders should look for a candle close above $3.63 with rising OBV and renewed RSI strength to validate the breakout.
If rejection continues and price drops below $3.35, support lies at $3.20 and then $3.04 (EMA100 zone). A breakdown below $3.04 would be considered a deeper correction and invalidate the current pennant.
Overall, XRP price today remains in a bullish posture, consolidating after a large rally. Volume, trend indicators, and netflow still support the potential for upside continuation unless critical supports give way.
XRP Price Forecast Table: July 24, 2025
| Indicator/Zone | Level / Signal |
| XRP price today | $3.48 |
| Resistance 1 | $3.62 (Pennant resistance) |
| Resistance 2 | $3.88–$4.00 (Upside breakout) |
| Support 1 | $3.35 (Trendline base) |
| Support 2 | $3.20 / $3.04 (EMA50 / EMA100) |
| RSI (30-min) | 39.8 (Mild bearish divergence) |
| MACD (30-min) | Flat, slight negative bias |
| EMA Cluster (4H) | Bullish, price above all EMAs |
| Bollinger Bands (4H) | Narrowing, breakout potential |
| Parabolic SAR (4H) | Flat, slight resistance |
| VWAP (30-min) | Rejected near $3.52 |
| CMF (4H) | +0.08 (Positive capital inflow) |
| OBV (4H) | 3.49B (Accumulation holding) |
| Spot Netflow | +$7.66M (Supportive sentiment) |
Disclaimer: The information presented in this article is for informational and educational purposes only. The article does not constitute financial advice or advice of any kind. Coin Edition is not responsible for any losses incurred as a result of the utilization of content, products, or services mentioned. Readers are advised to exercise caution before taking any action related to the company.


 Price Prediction: Weak Momentum Signals Possible Drop to $62K")