 Price Prediction for July 25")
After a parabolic rally toward $3.66 earlier this week, XRP price today is trading near $3.14, down over 10% from recent highs. The move marks a volatile turnaround following a clean breakout from compression patterns and previous range resistance. However, the sharp rejection near the $3.60 to $3.66 zone raises questions about the sustainability of this breakout, especially as buyers look to defend the $3.00 psychological support.
What’s Happening With XRP’s Price?
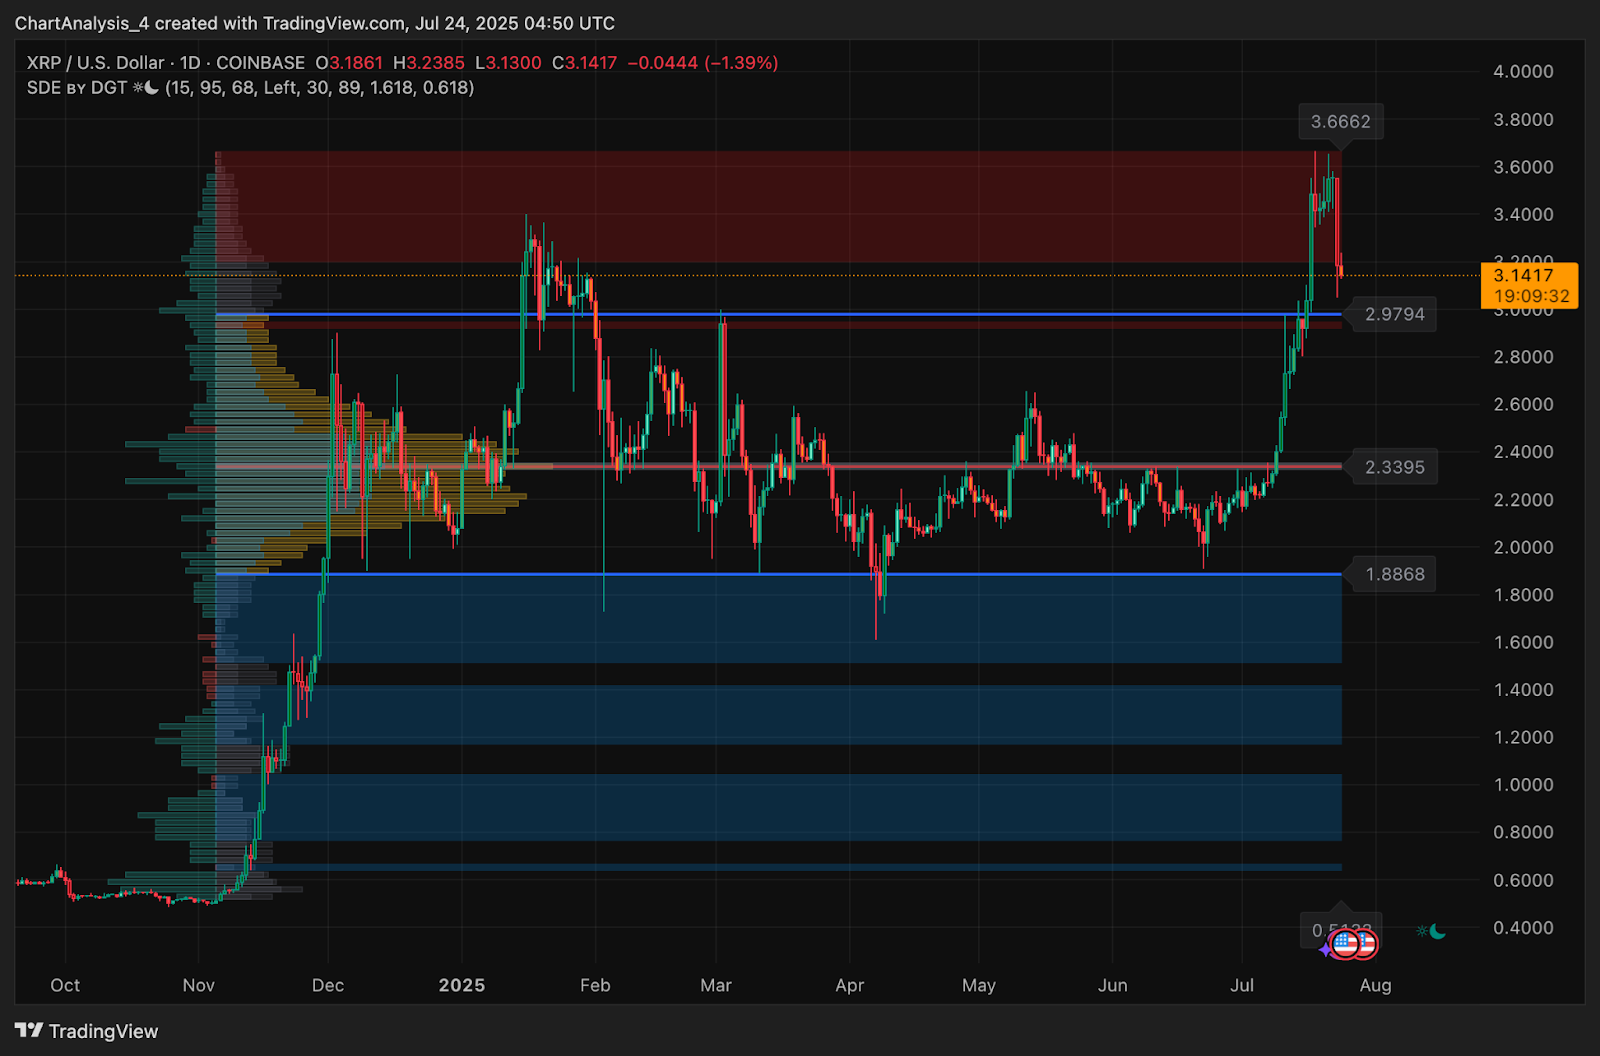
The daily structure shows XRP completing a full breakout from its long-standing range and then hitting supply around $3.66, a level marked by historical volume clusters and prior swing failures. This zone coincides with the top of a major red value area on the volume profile chart where aggressive profit-taking occurred.
Following this, XRP retraced into the $3.10 to $3.15 zone, now sitting just above a key support band at $2.97. If this area fails, the next downside magnet sits near $2.34 where previous range resistance has now flipped into a support cluster.
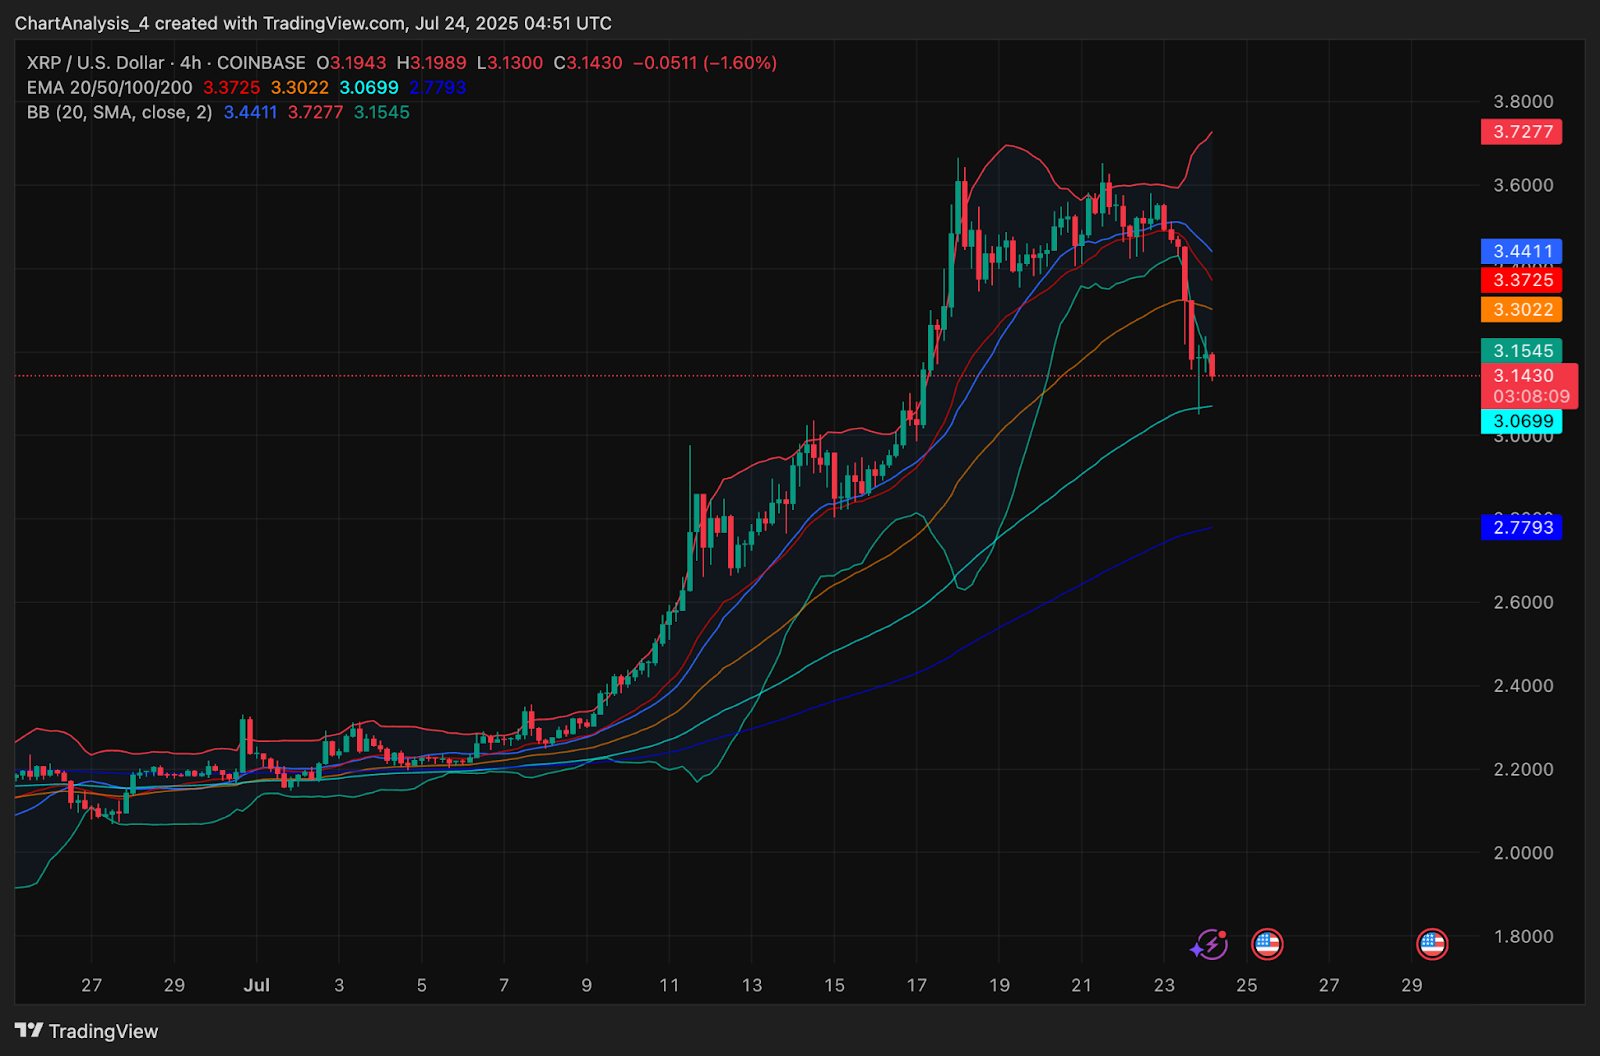
On the 4-hour chart, Bollinger Bands are starting to expand downward again and the price has decisively broken below the middle band near $3.30. The 20 EMA at $3.30 and 50 EMA at $3.06 are now converging near the current price, while the 100 EMA sits lower at $2.77, making it a possible downside target in case of extended correction.
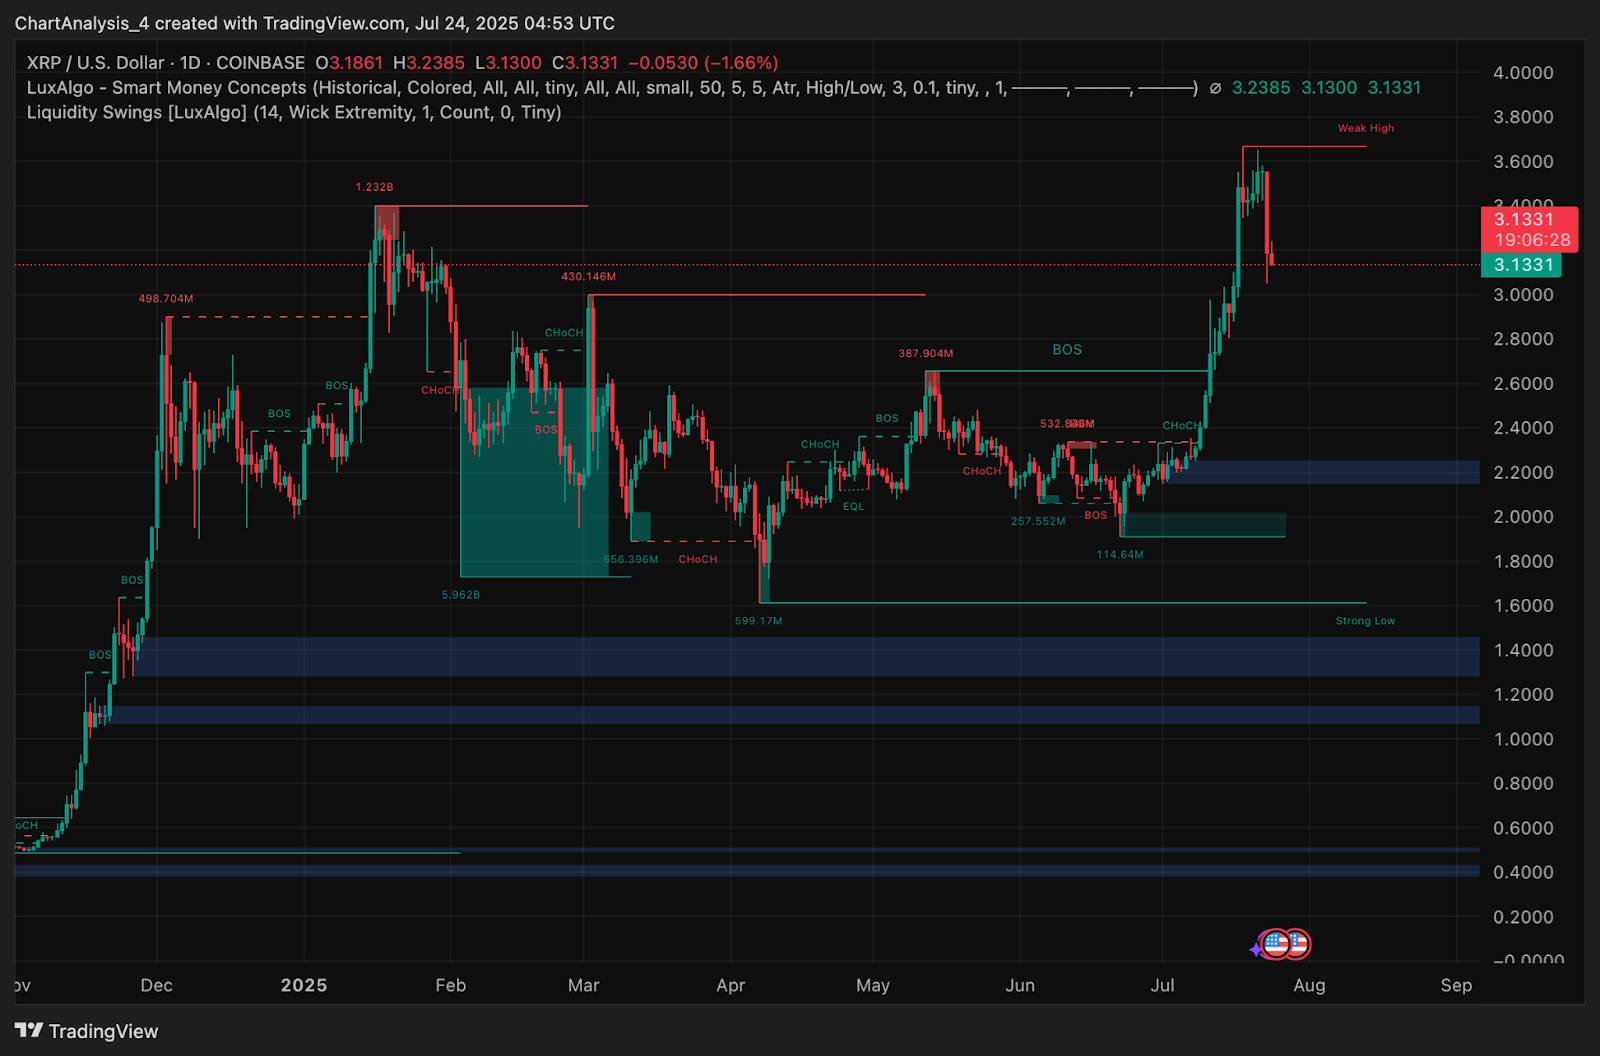
The daily Smart Money Concepts structure continues to favor bulls long term after a clean Break of Structure (BOS) above $2.40 and $2.80, but the most recent rejection at the “Weak High” level suggests immediate upside is capped unless volume reappears.
Why Is The XRP Price Going Down Today?
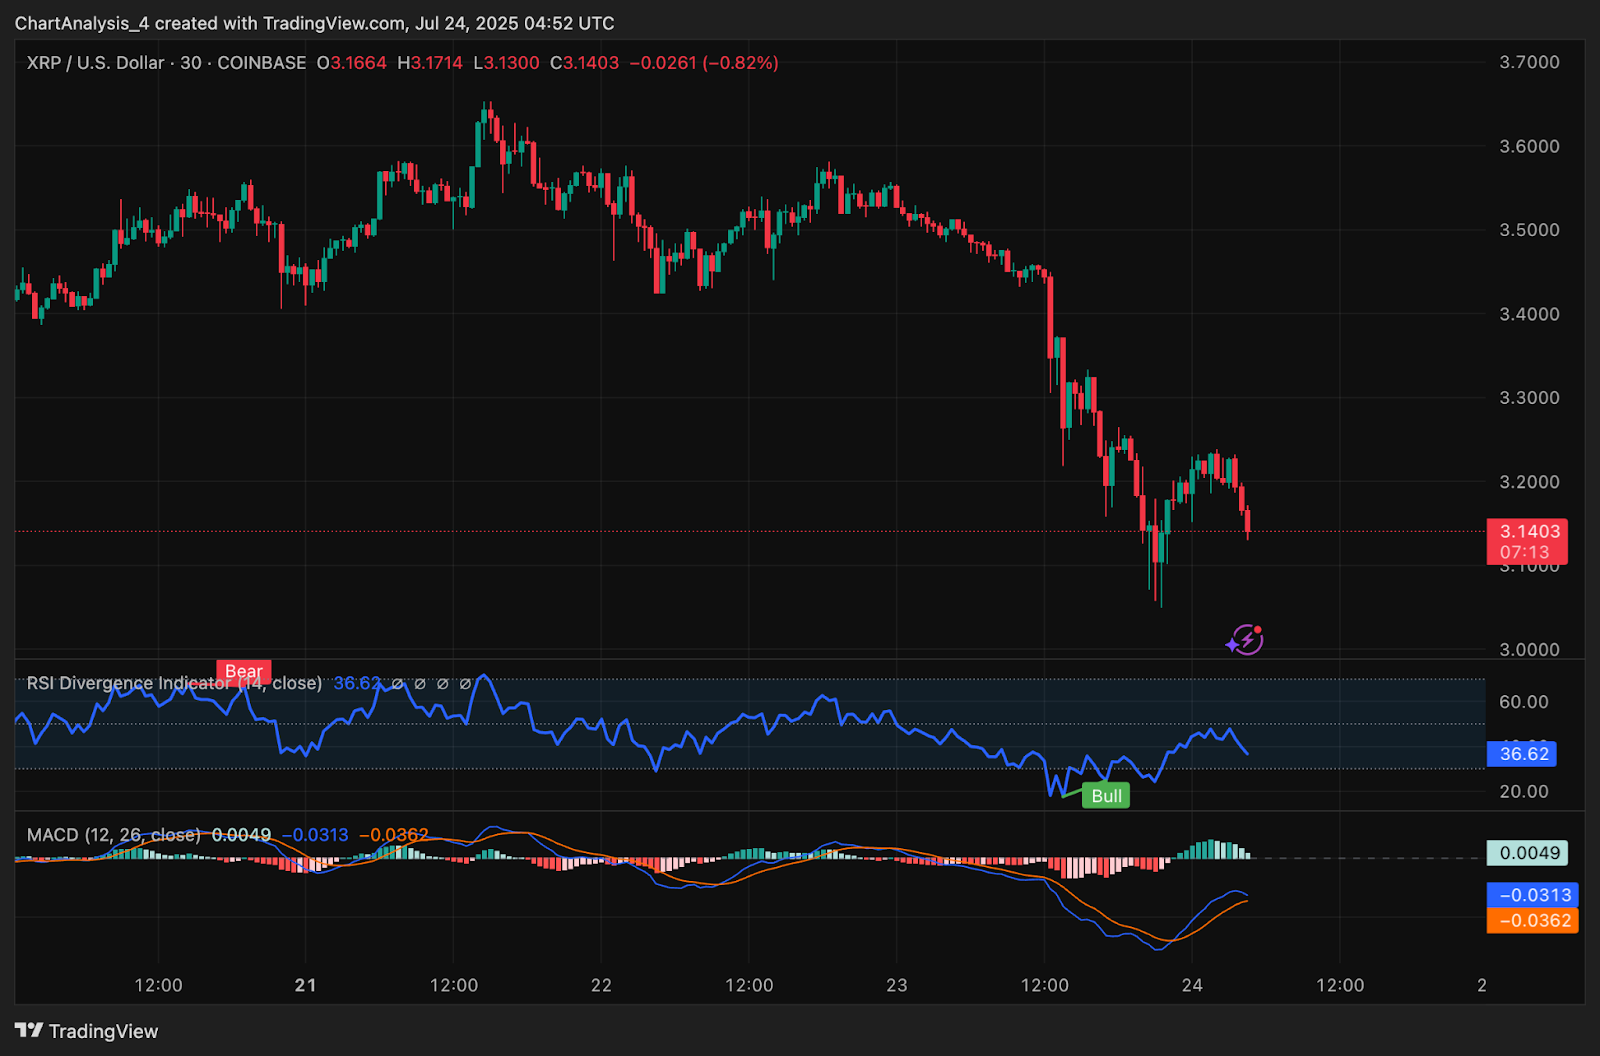
The recent retracement in XRP price is being driven by both technical rejection and weakening short-term momentum indicators. On the 30-minute chart, RSI has dropped to 36.6 after a bearish divergence signal near the $3.50 peak. MACD also shows fading momentum with the histogram narrowing and the signal line struggling to hold bullish crossover gains.
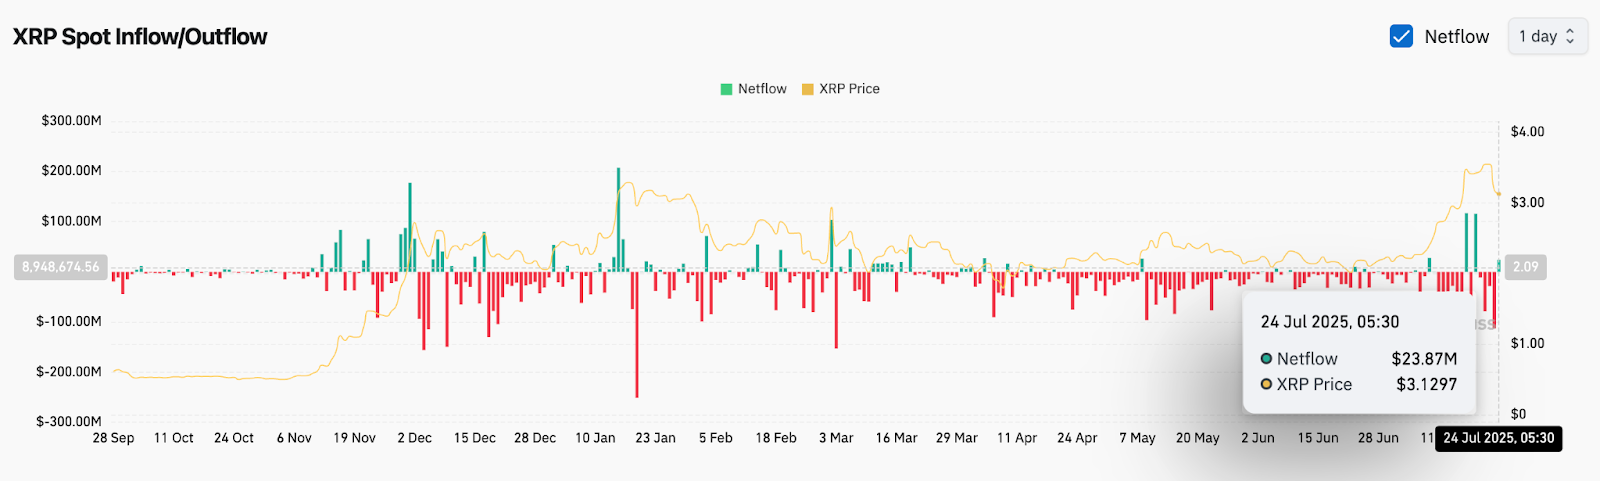
Meanwhile, the spot netflow chart shows a significant drop in buy-side pressure. While there was a $23.87M positive net inflow earlier on July 24, price action failed to respond proportionally, a bearish divergence between inflows and price strength. This suggests buyer exhaustion may be setting in despite capital inflow.
Adding to the caution, XRP has fallen back below the 20 and 50 EMAs on the 4-hour timeframe, a zone that had previously supported continuation rallies. The candle body close below $3.15 now puts pressure on the $3.00 level, which sits just above the highest-volume node on the visible range profile.
Unless buyers reappear near this zone, there is a risk of a slide back toward the high-volume base between $2.60 and $2.80.
XRP Price Action Signals Cooling Momentum As Volume Dries Up
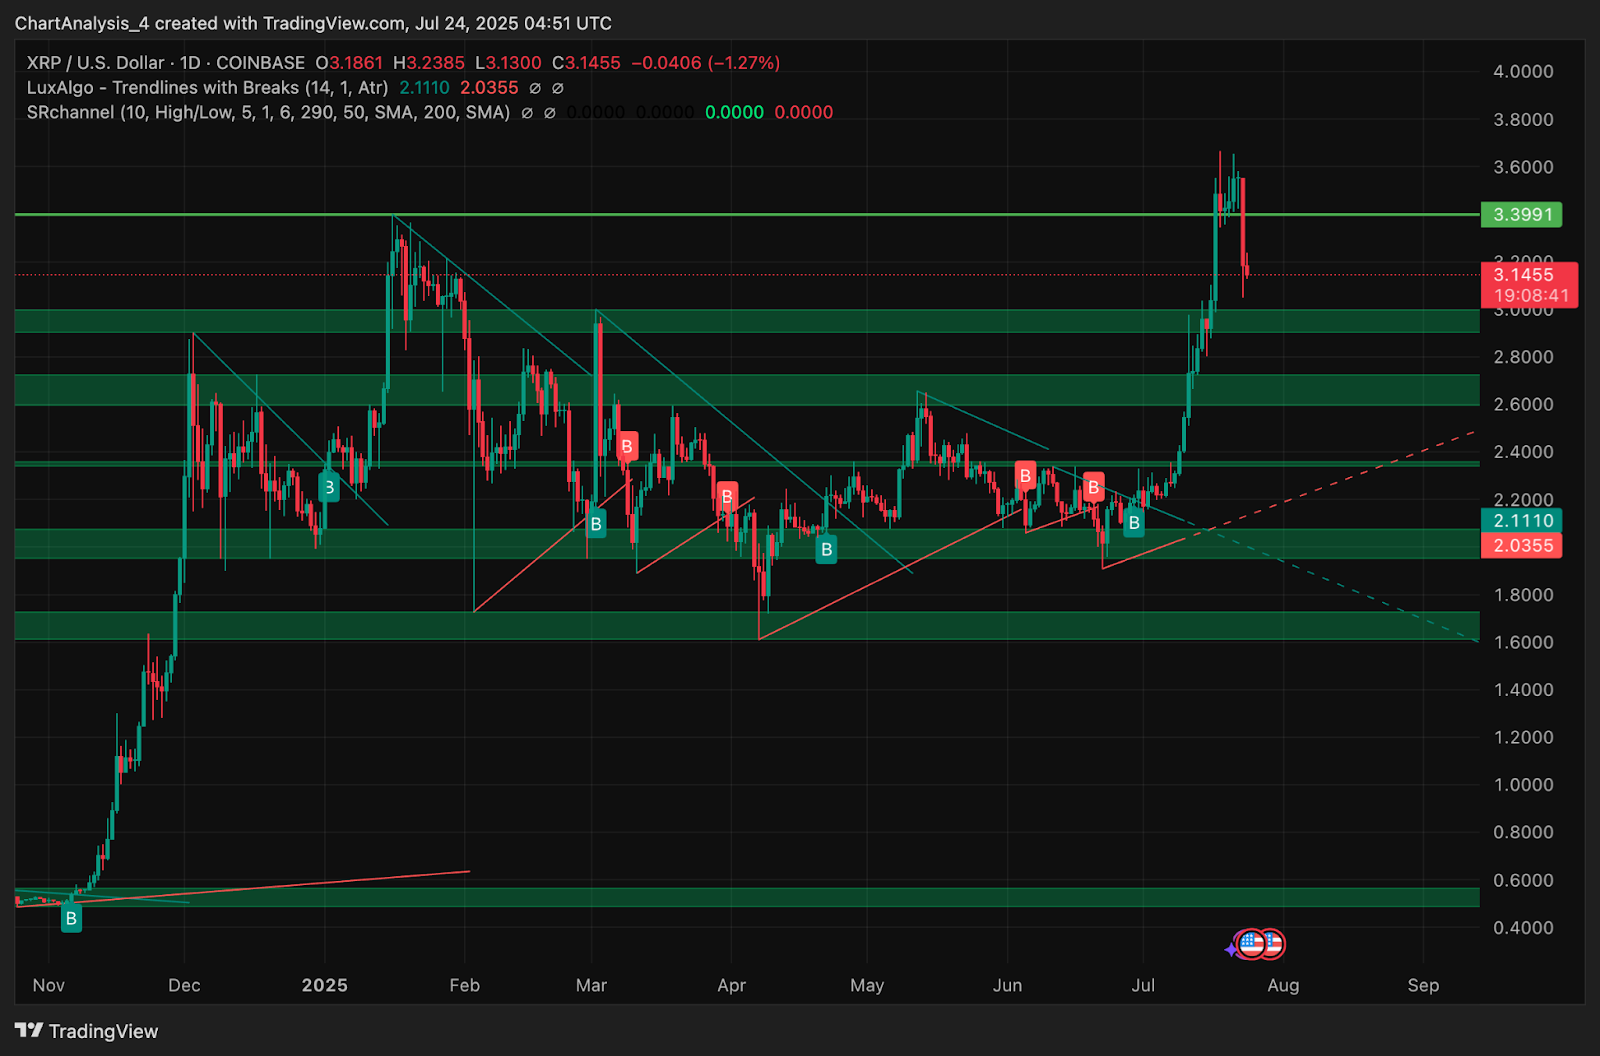
The LuxAlgo trendline and structure indicators confirm XRP is in a post-breakout retest phase. The price action broke through multiple resistance bands between $2.20 and $2.97 but failed to hold above the $3.39 to $3.66 supply wall.
Notably, the symmetrical wedge breakout that launched XRP above $2.40 in early July now appears fully played out. Price has printed a series of lower highs on the lower timeframes and the 4H Bollinger Bands show candles riding the lower band, a classic pattern preceding deeper mean reversion.
On-chain momentum is also waning. The Chande Momentum Oscillator (not shown on chart but inferred from declining RSI-MACD structure) is likely below neutral, suggesting fading upside impulse. The Volume Point of Control (POC) from recent breakout accumulation rests around $2.98, making it the final defensive line for bulls in this cycle.
Until XRP closes back above the $3.30 to $3.38 range with conviction, traders may remain hesitant to re-enter large long positions.
XRP Price Prediction: Short-Term Outlook (24H)
In the next 24 hours, XRP price needs to hold above $3.00 and preferably reclaim $3.15 to $3.20 to avoid triggering a deeper breakdown. If the current correction extends and sellers push XRP below $2.97, it opens the door for a move toward $2.78 followed by the range base near $2.35.
On the upside, reclaiming $3.30 with strong volume could bring a retest of the $3.45 to $3.50 area but continuation above $3.66 will require fresh catalyst or inflows.
Momentum indicators favor caution for now with 30-minute RSI in a weak zone and MACD struggling to maintain bullish crossover. Unless price stabilizes near EMAs and demand reappears on volume, the correction may persist into the weekend.
XRP Price Forecast Table: July 25, 2025
| Indicator/Zone | Level / Signal |
| XRP price today | $3.14 |
| Resistance 1 | $3.30 |
| Resistance 2 | $3.50 |
| Support 1 | $3.00 |
| Support 2 | $2.78 |
| Value Area POC (Daily) | $2.97 |
| Bollinger Band (4H) | Expanded, lower-band pressure |
| EMA Cluster (20/50/100/200) | $3.30 / $3.06 / $2.77 / $2.78 |
| RSI (30-min) | 36.6 (Bearish zone) |
| MACD (30-min) | Weak Bullish Cross |
| Smart Money Concept (Daily) | Weak High printed at $3.66 |
| Netflow (July 24) | +$23.87M (divergent response) |
| Pattern Watch | Post-breakout retest below supply |
Disclaimer: The information presented in this article is for informational and educational purposes only. The article does not constitute financial advice or advice of any kind. Coin Edition is not responsible for any losses incurred as a result of the utilization of content, products, or services mentioned. Readers are advised to exercise caution before taking any action related to the company.


