 Price Prediction for July 26")
XRP price is trading near $3.06 in today’s session after a sharp selloff rejected the recent upside above $3.40. Momentum has shifted in favor of sellers following back-to-back rejections at the Supertrend flip zone. Multiple indicators now point to weakening bullish strength, as short-term support near $3.00 becomes increasingly critical.
What’s Happening With XRP’s Price?
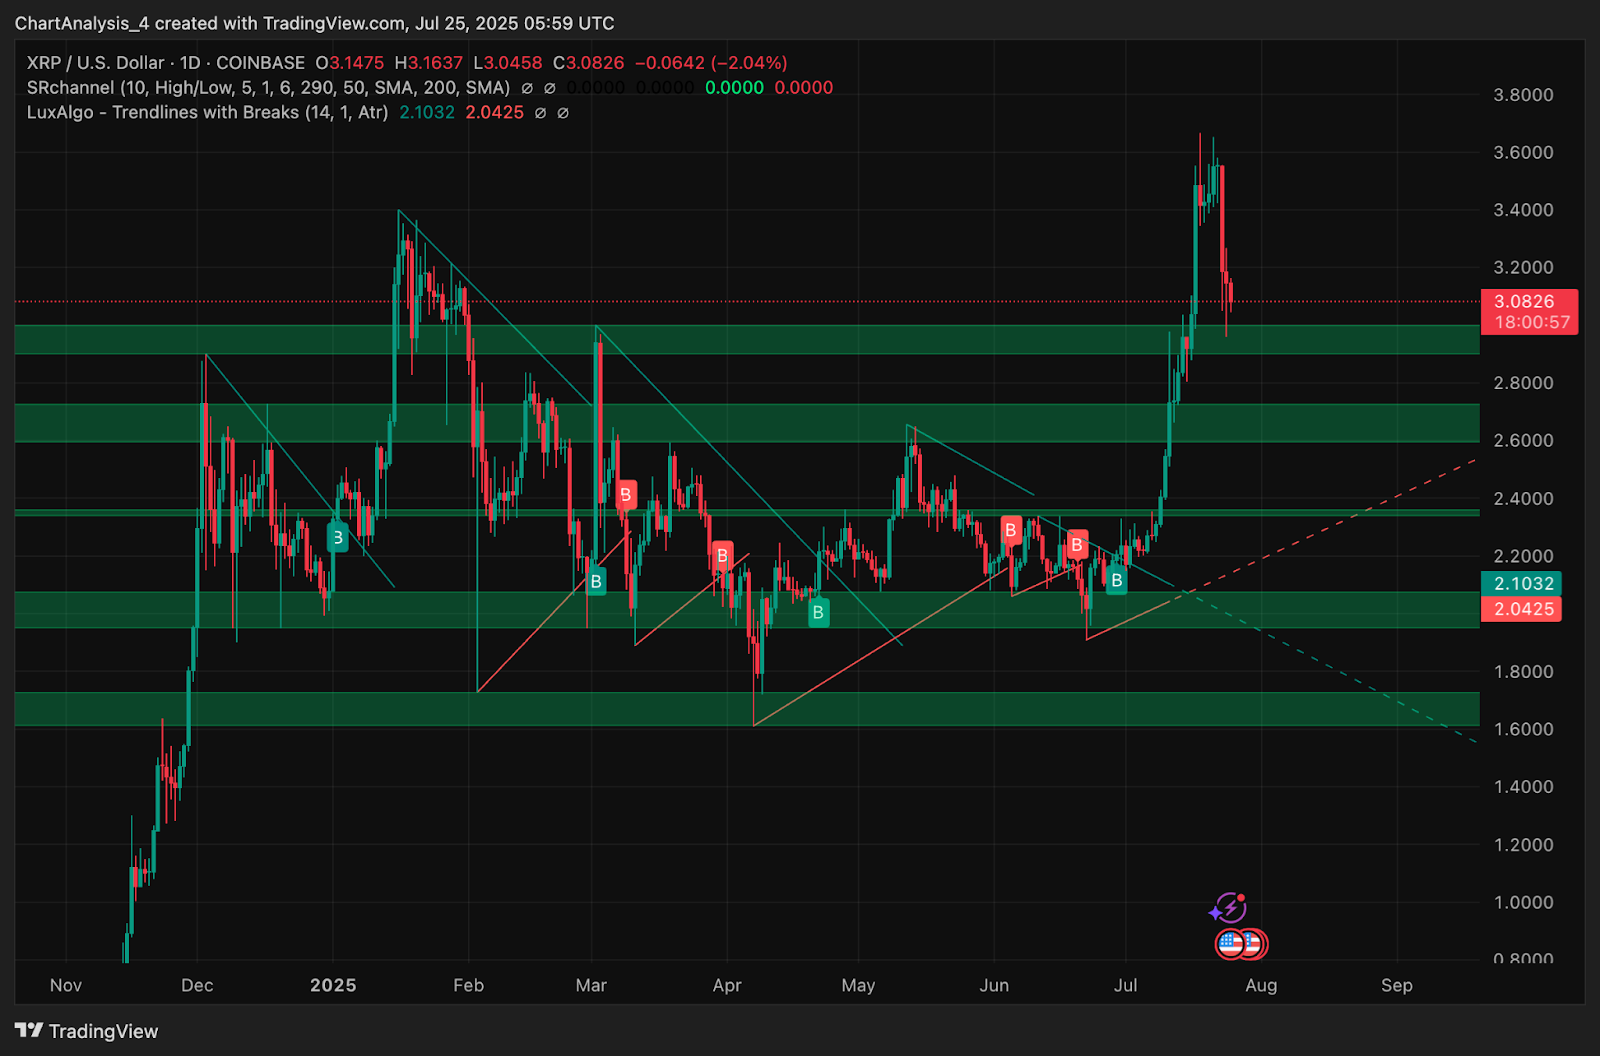
On the daily chart, XRP price action recently broke out of a large descending structure and rallied sharply toward $3.63. However, price has since reversed and is now pulling back into the prior consolidation zone between $3.00 and $3.20. The rejection candle printed on July 23 marked a temporary local top, and price is now forming lower highs as it tests mid-range support.
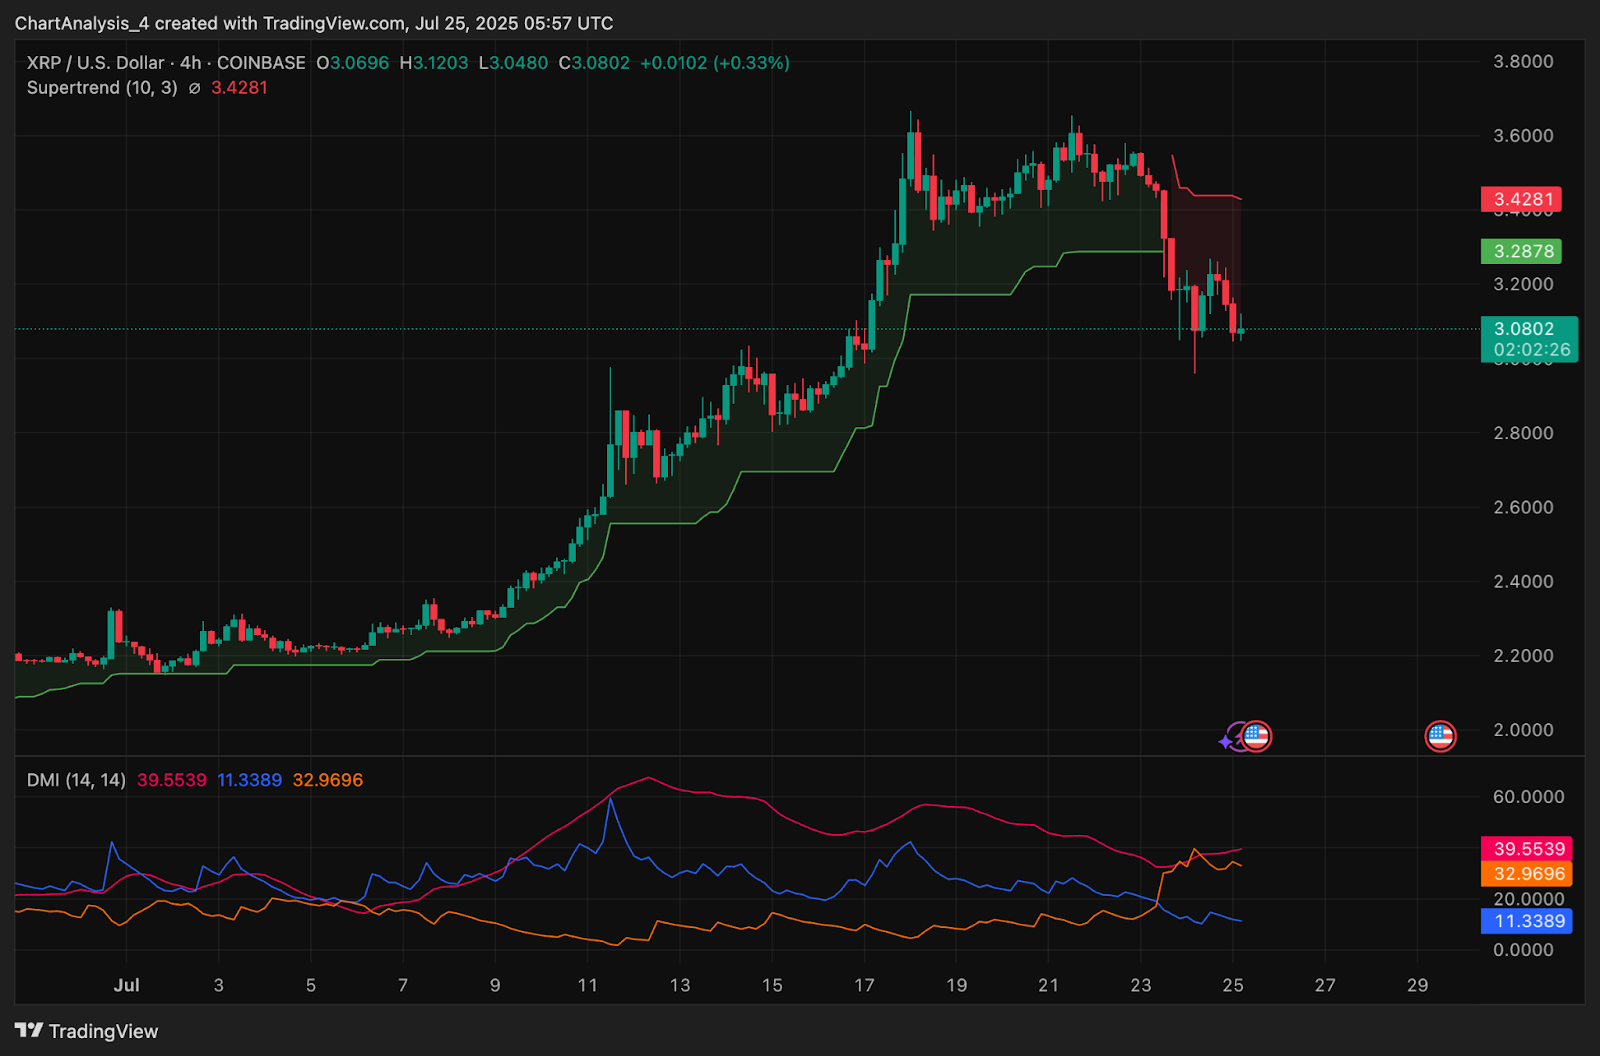
The 4-hour chart shows a clear rejection from the red Supertrend zone at $3.42, with current price trading well below that level. Structure has now flipped neutral to bearish in the short term. Unless XRP reclaims $3.28 and re-enters the bullish support band, the risk of deeper downside remains elevated.
Directional Movement Index (DMI) further supports this view. The -DI at 39.55 is leading, while ADX rises steadily, suggesting bearish strength is building. If the +DI continues to fall, any short-term bounces may be capped under $3.17 to $3.20.
Why Is The XRP Price Going Down Today?
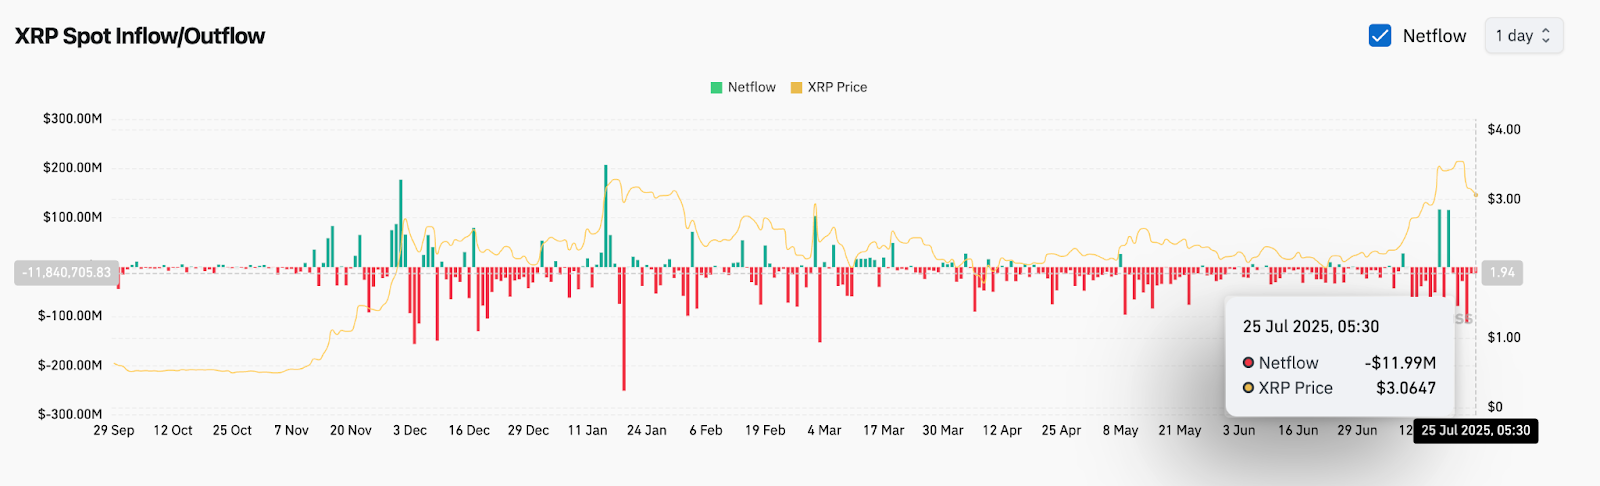
The reason why XRP price going down today lies in the shift in momentum and increased outflows. As of July 25, net outflow from spot exchanges totaled nearly $12 million, according to blockchain data, confirming that investors are rotating capital out of XRP. The
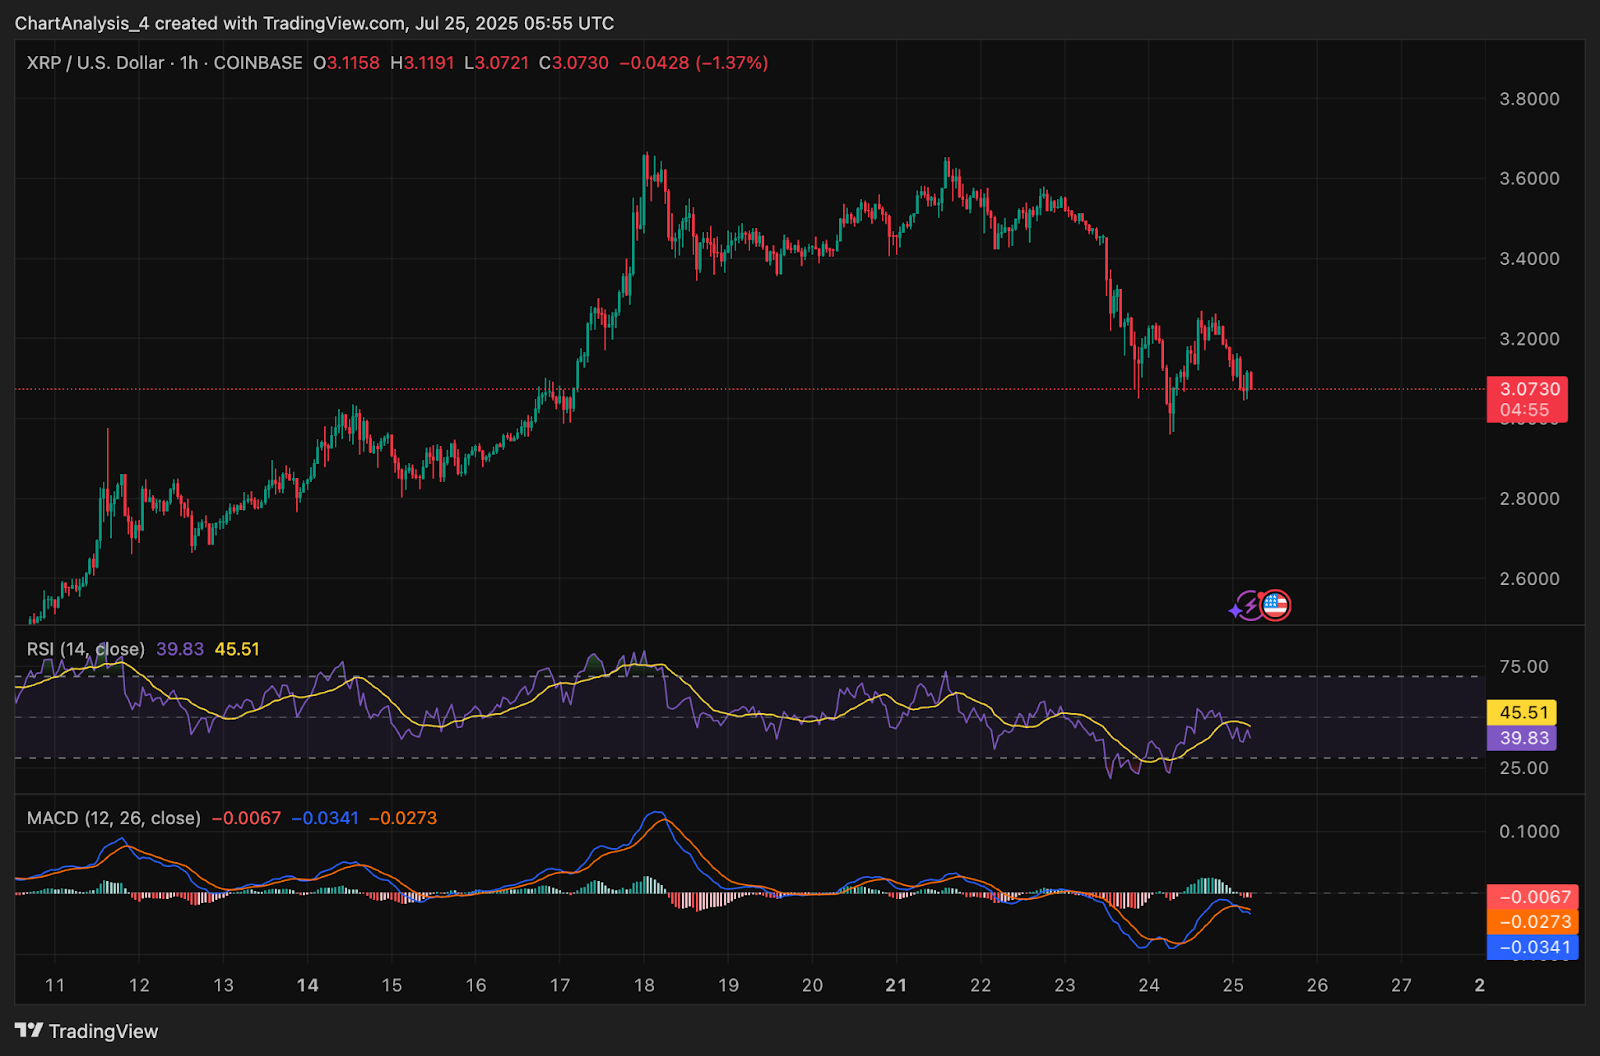
RSI on the 1-hour chart is at 39.83, signaling fading strength, while MACD has turned negative with both signal lines diverging below zero.
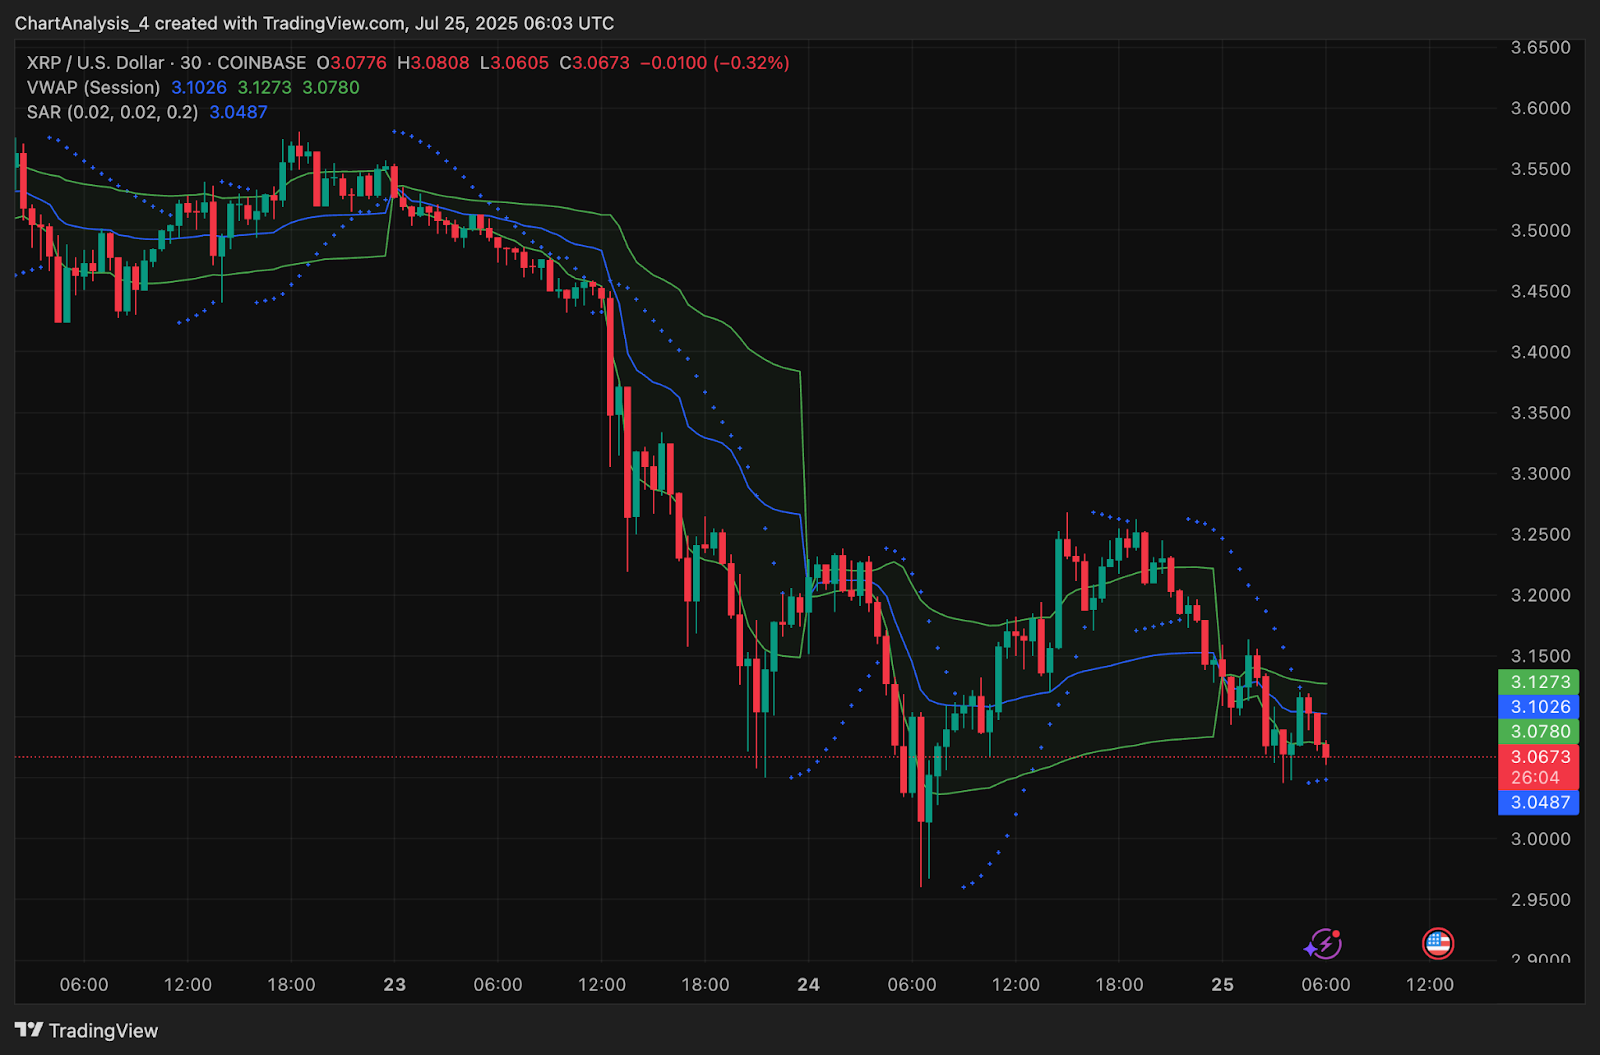
From a volatility and trend-following perspective, the Parabolic SAR indicator on the 30-minute chart has flipped bearish, with dots forming above candles and price trading consistently below session VWAP. Bollinger Bands have started expanding on the 4-hour timeframe, confirming that XRP has entered a new volatility cycle that is currently favoring sellers.
Key Indicators Flash Caution for Bulls
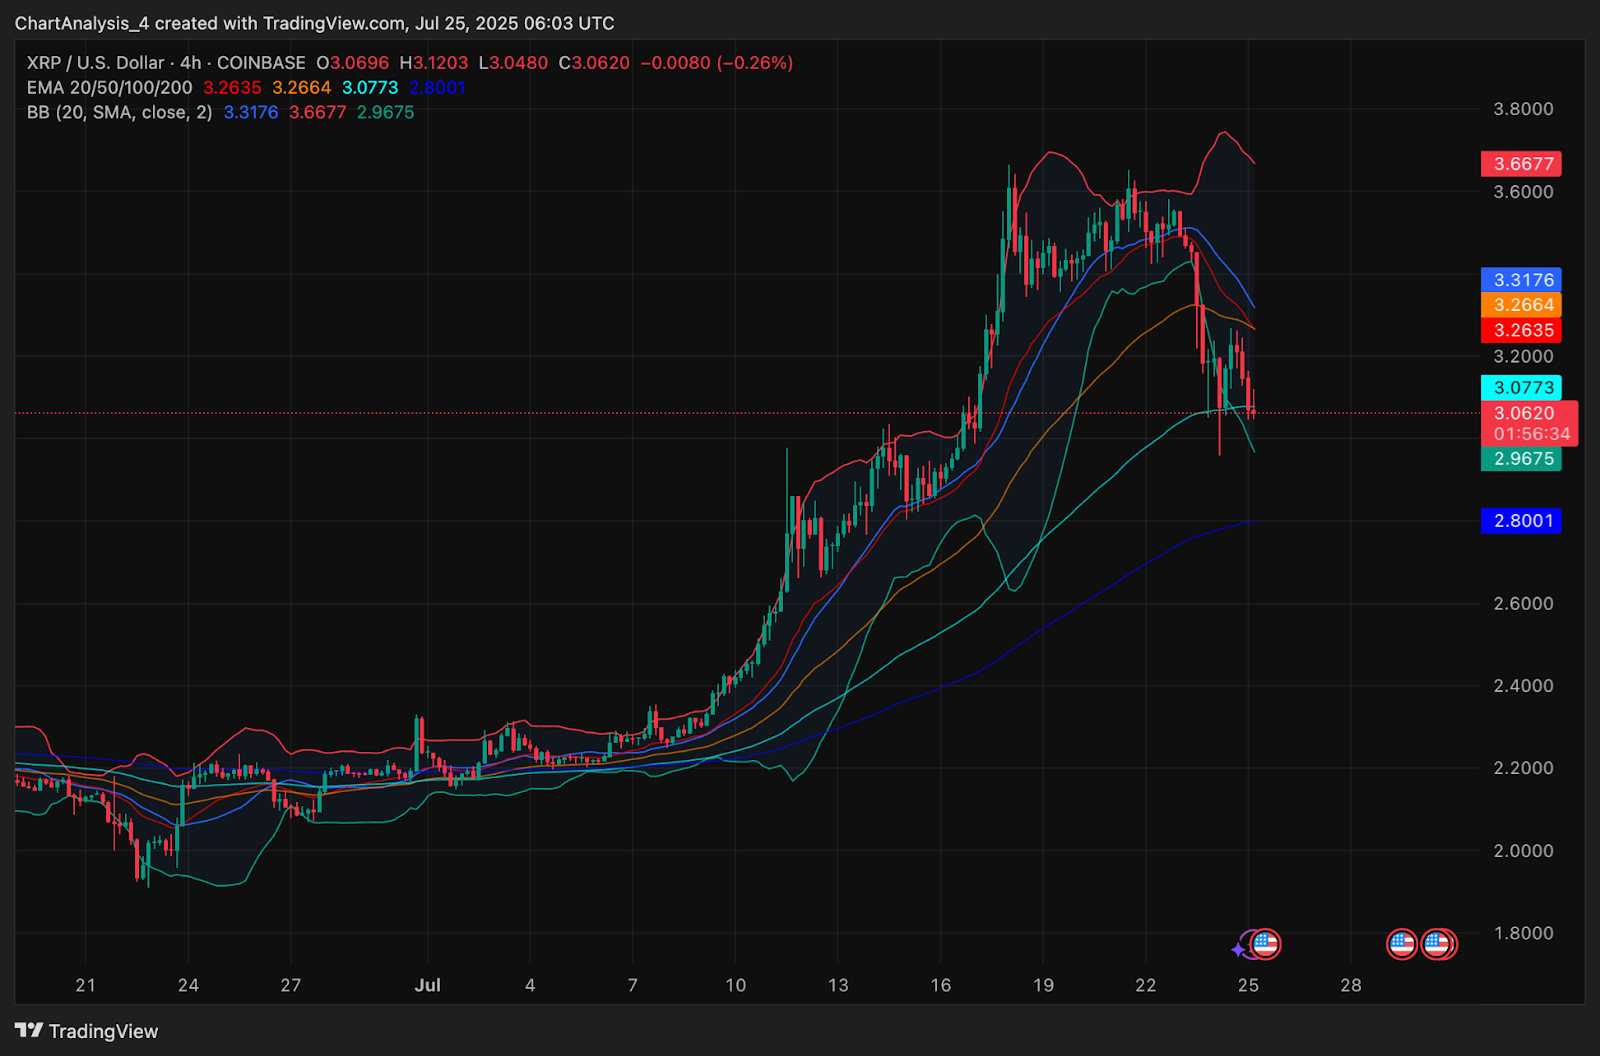
EMA clusters on the 4-hour chart are beginning to tilt downward. Price is now trading below the 20 EMA ($3.26), 50 EMA ($3.26), and 100 EMA ($3.07). The 200 EMA at $2.80 offers potential medium-term support, but the alignment suggests a bearish cross may form if current pressure persists.
Bollinger Bands are starting to widen, with XRP trading below the median band ($3.31) and leaning on the lower band at $2.96. This confirms rising volatility as price escapes its prior compression phase.
The daily structure remains bullish from a broader perspective, but today’s pullback is part of a larger correction that began after XRP touched multi-month highs. The immediate support lies in the $3.00 to $3.04 zone, which was previously a breakout point and may now act as a retest area.
XRP Price Prediction: Short-Term Outlook (24H)
If XRP price today fails to reclaim the $3.20 level in the next 24 hours, bearish continuation toward $3.00 becomes more likely. A decisive break below this threshold could expose $2.80, which aligns with the 200 EMA and lower Bollinger Band on the 4-hour chart.
On the upside, a strong bounce above $3.17 could shift near-term sentiment back toward $3.28 and $3.42, the Supertrend flip level. However, unless momentum indicators reverse and volume supports the move, upside attempts may face rejection.
Traders should closely monitor the $3.00 to $3.04 range. A bounce with bullish volume from this zone could provide a short-term opportunity, but failure to hold this support may trigger a sharper liquidation cascade.
XRP Price Forecast Table: July 26, 2025
| Indicator / Zone | Level / Signal |
| XRP price today | $3.06 |
| Resistance 1 | $3.17 (VWAP and SAR resistance) |
| Resistance 2 | $3.28 (upper EMA zone) |
| Resistance 3 | $3.42 (Supertrend flip level) |
| Support 1 | $3.00 (key psychological level) |
| Support 2 | $2.80 (200 EMA 4H) |
| RSI (1H) | 39.83 (bearish bias) |
| MACD (1H) | Bearish crossover |
| DMI | -DI leads at 39.55 |
| Supertrend (4H) | Bearish below $3.42 |
| Bollinger Bands (4H) | Widening, price below median |
| EMA Cluster (20/50/100, 4H) | Bearishly aligned |
| SAR (30-min) | Bearish (dots above candles) |
| Spot Netflow (July 25, 05:30) | -$11.99M (net outflow) |
Disclaimer: The information presented in this article is for informational and educational purposes only. The article does not constitute financial advice or advice of any kind. Coin Edition is not responsible for any losses incurred as a result of the utilization of content, products, or services mentioned. Readers are advised to exercise caution before taking any action related to the company.


