
After posting an explosive breakout from long-term compression near $2.20, XRP price surged as high as $3.65 before cooling off. The pullback now finds XRP consolidating around $3.18, with the price testing mid-range EMA clusters and reacting around major Fibonacci levels. As momentum fades, traders are closely watching whether short-term support near $3.00–$3.05 will hold.
What’s Happening With XRP’s Price?
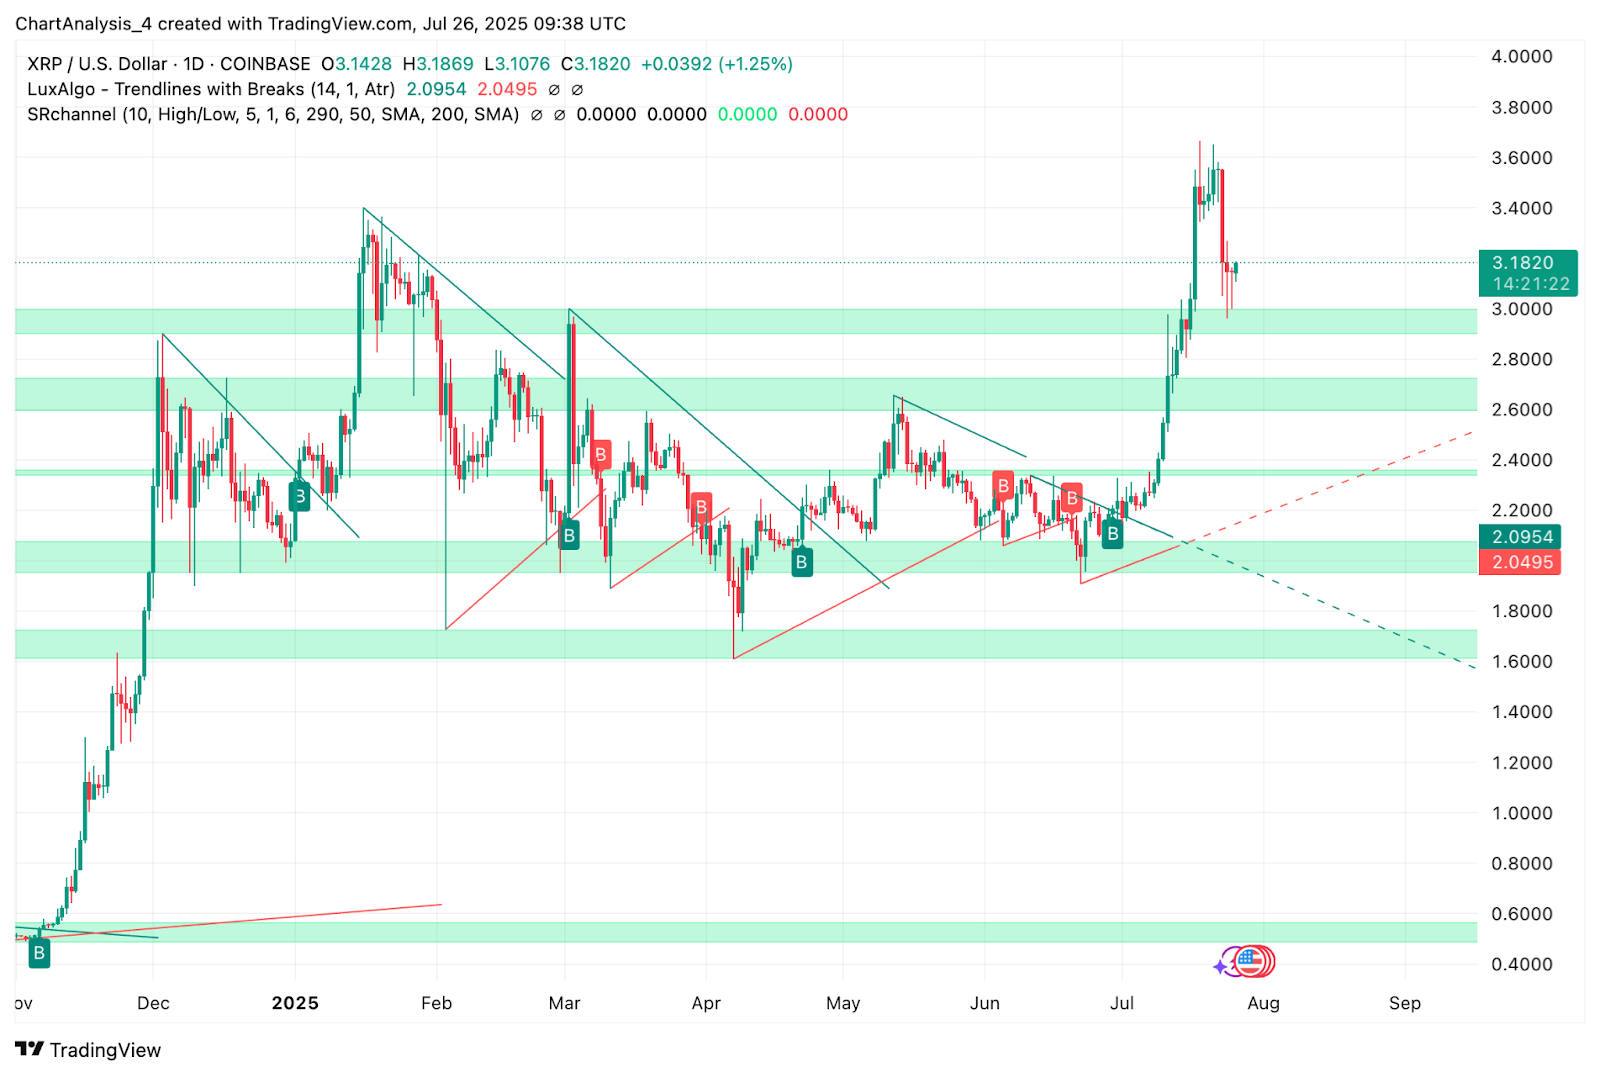
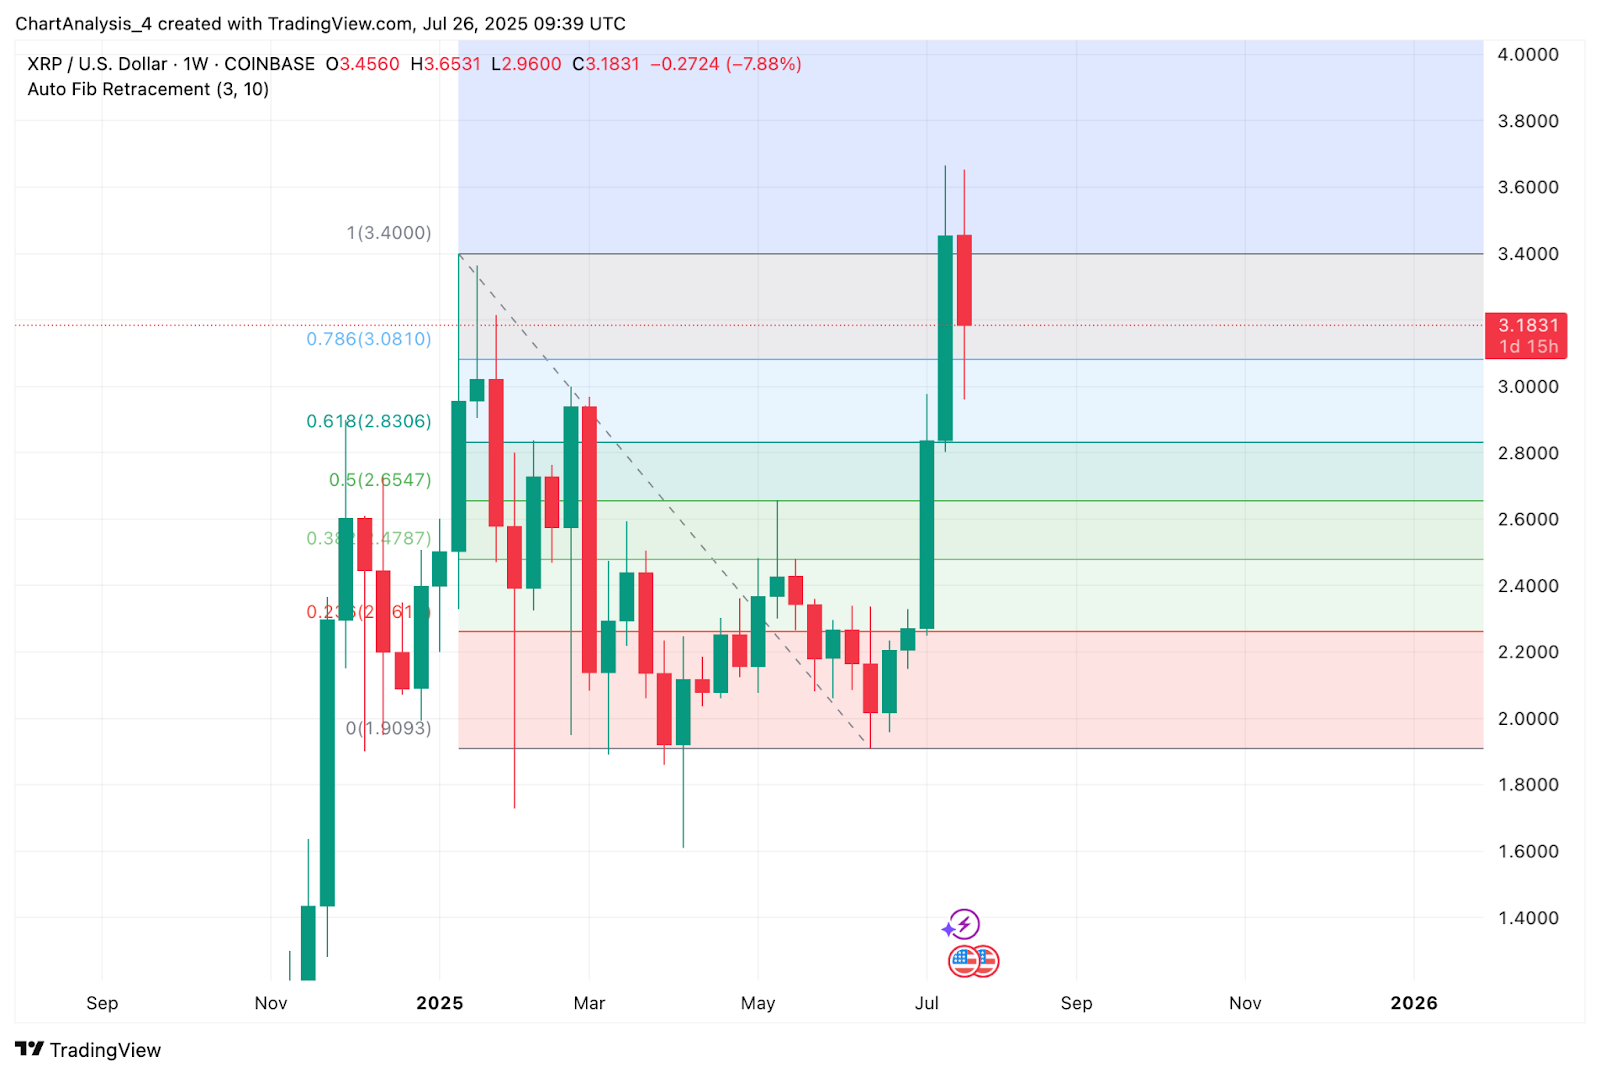
The daily chart shows XRP price respects the breakout zone around $3.00 following a clean upside resolution from a six-month symmetrical triangle. The move saw a price rally over 65% in just two weeks, clearing previous liquidity zones and reclaiming a bullish market structure. However, the rally hit a wall just under the $3.80 zone, which aligns with previous equal highs and a Smart Money “Weak High” label.
The pullback has now stabilized around the $3.18 mark, which sits just above the weekly 0.786 Fibonacci level at $3.08. Price remains above the LuxAlgo-drawn BOS zone and is still structurally bullish on higher timeframes. Trendline support from the July breakout remains intact and has not been retested yet.
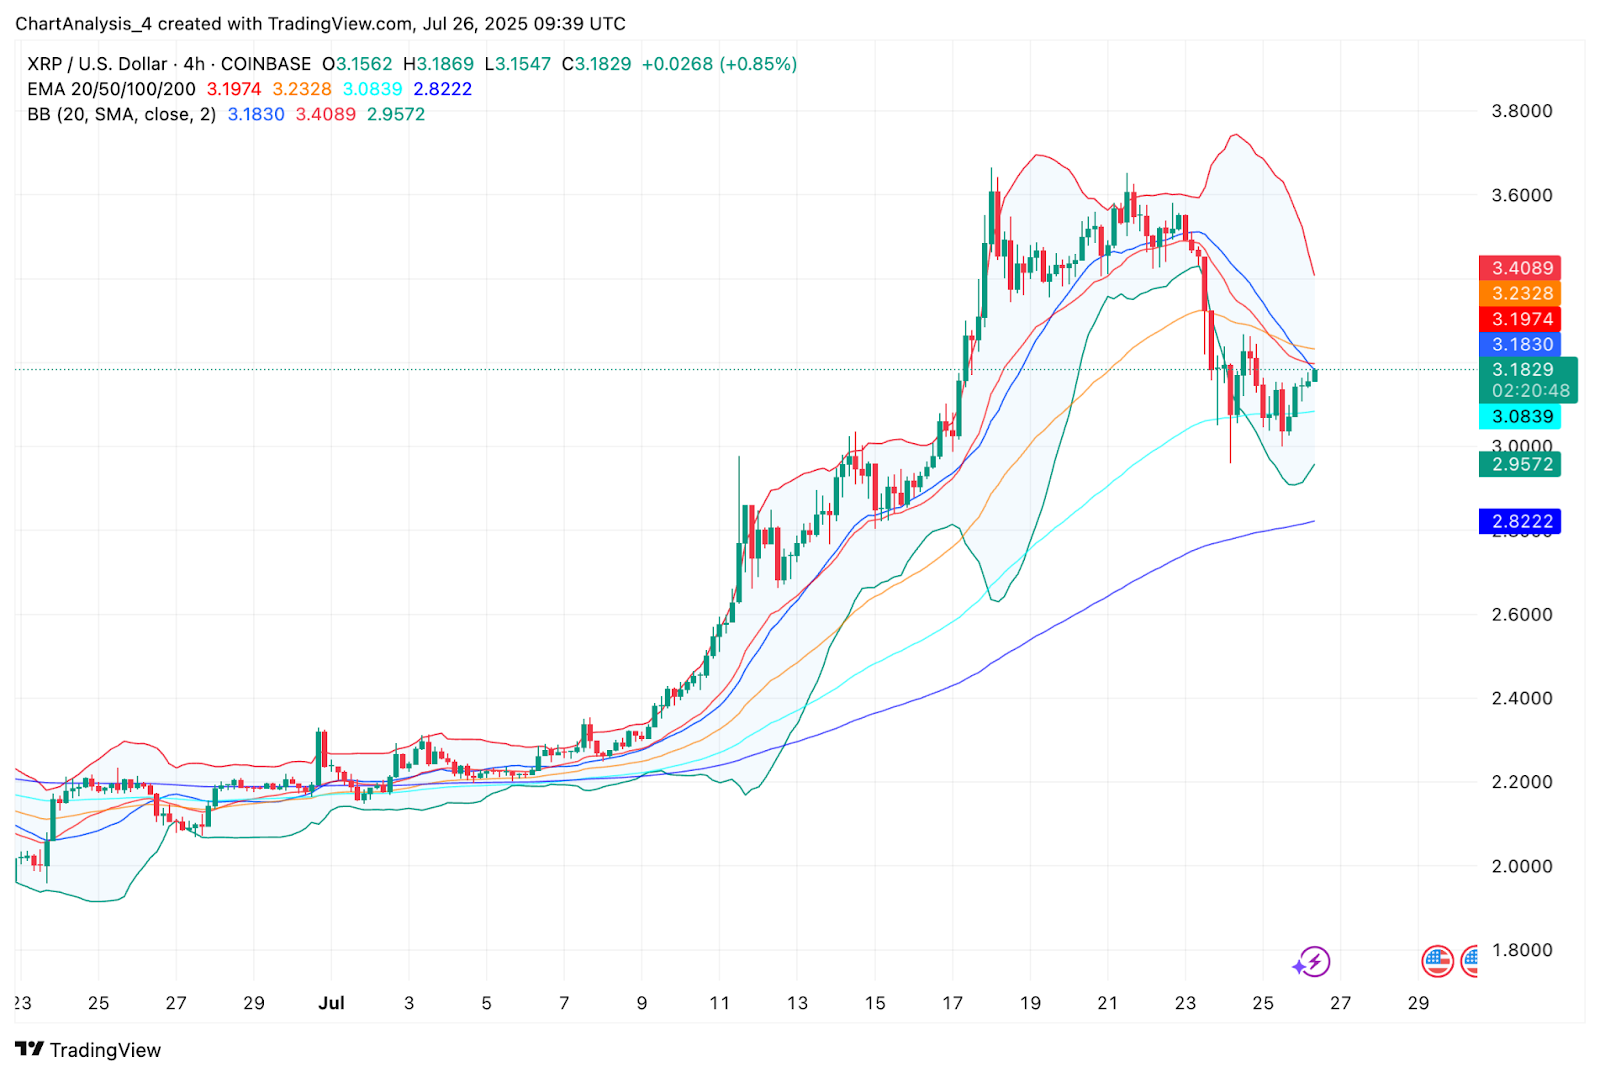
On the 4-hour chart, Bollinger Bands show moderate compression after expansion, with price attempting to regain the mid-band. The 20/50 EMAs now converge near $3.19–$3.23, creating a key intraday resistance band just above current price. The 100 EMA at $3.08 remains the pivot to watch for bulls.
Why Is The XRP Price Going Down Today?
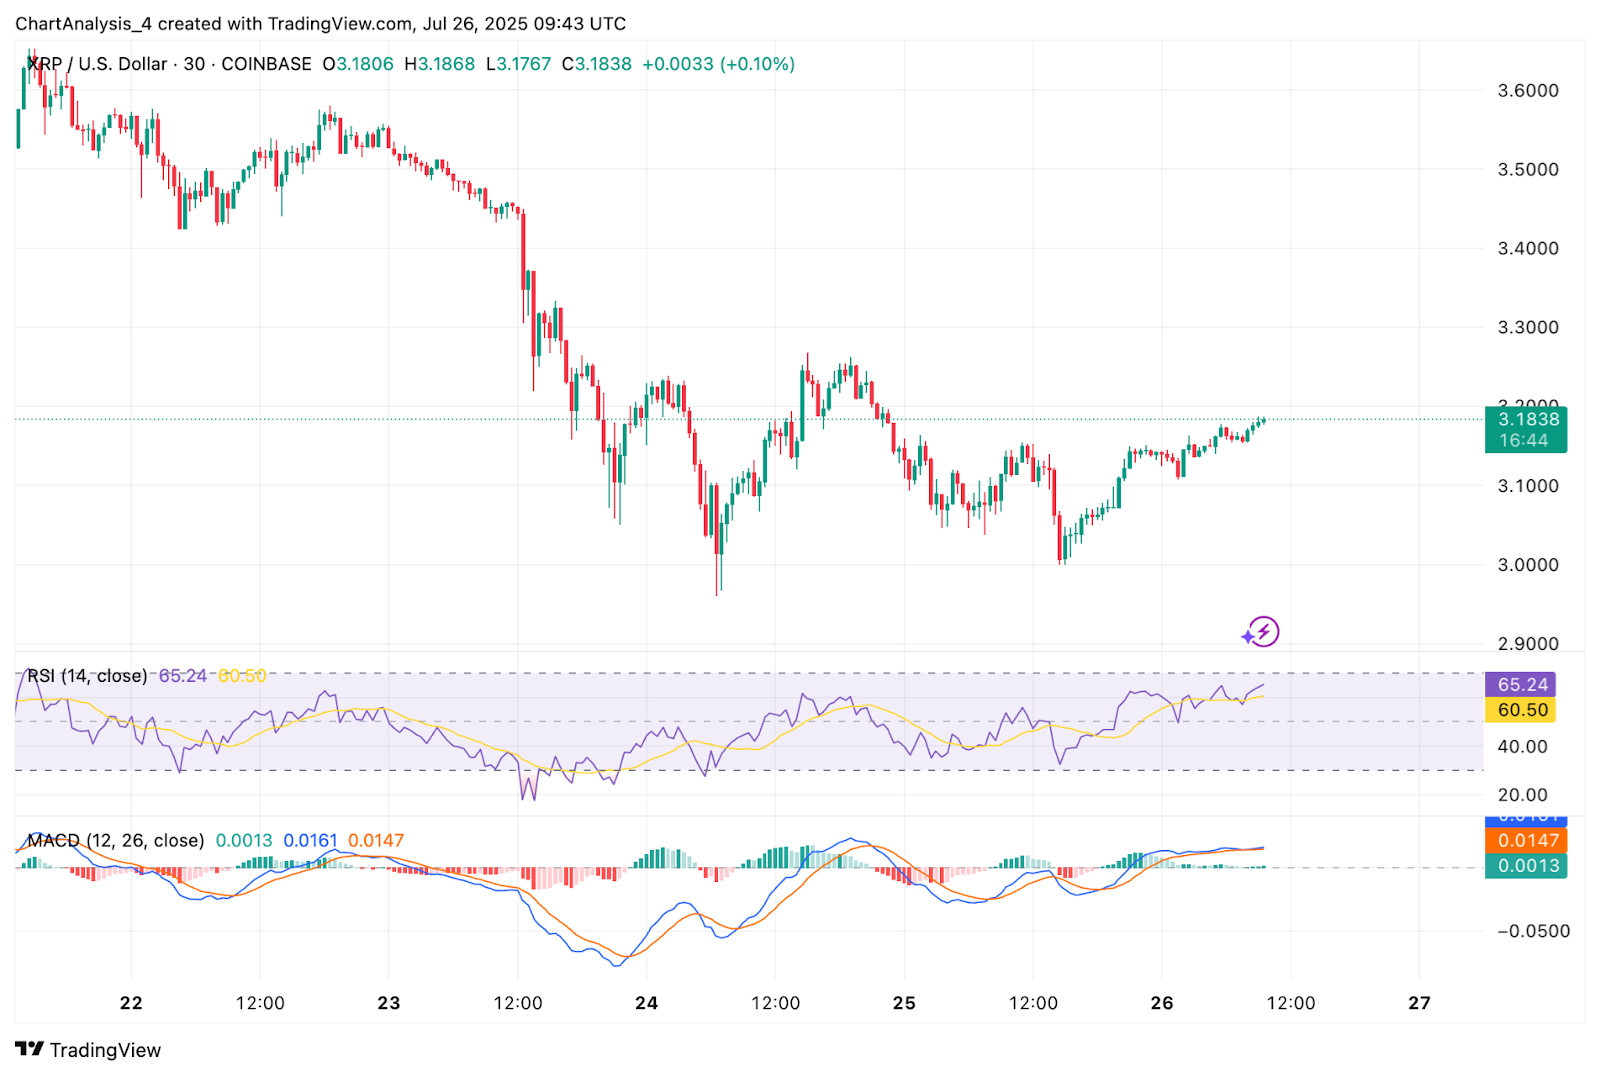
The substantial dip is tied to overextended bullish conditions and profit-taking from overbought zones. The RSI on the 30-minute chart peaked near 85 on July 23 and has since pulled back to 65, reflecting easing momentum without yet turning bearish. MACD has also flipped mildly positive, but remains near the zero line, confirming consolidation rather than trend reversal.
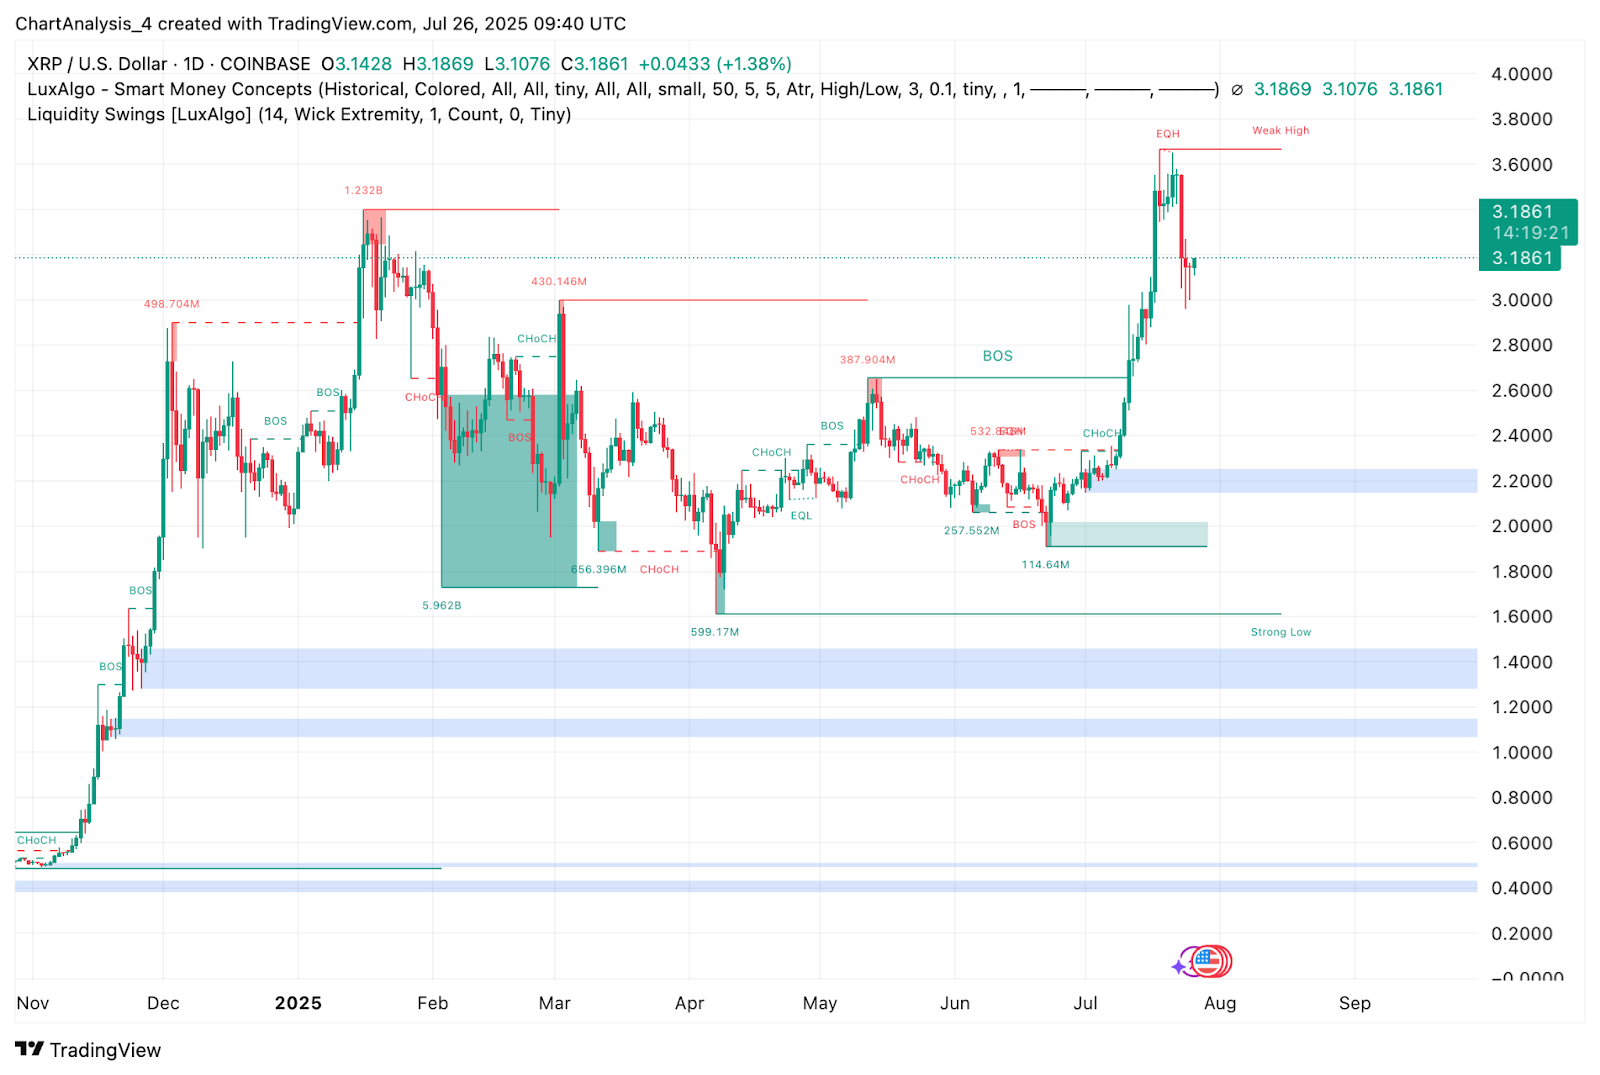
Smart Money Concept signals from the daily chart show that XRP broke structure bullishly near $2.20, and a significant CHoCH occurred near $3.55 after the rally exhausted near EQH levels. The current rejection from that region has led to a redistribution phase, though no major BOS has been confirmed on the downside.
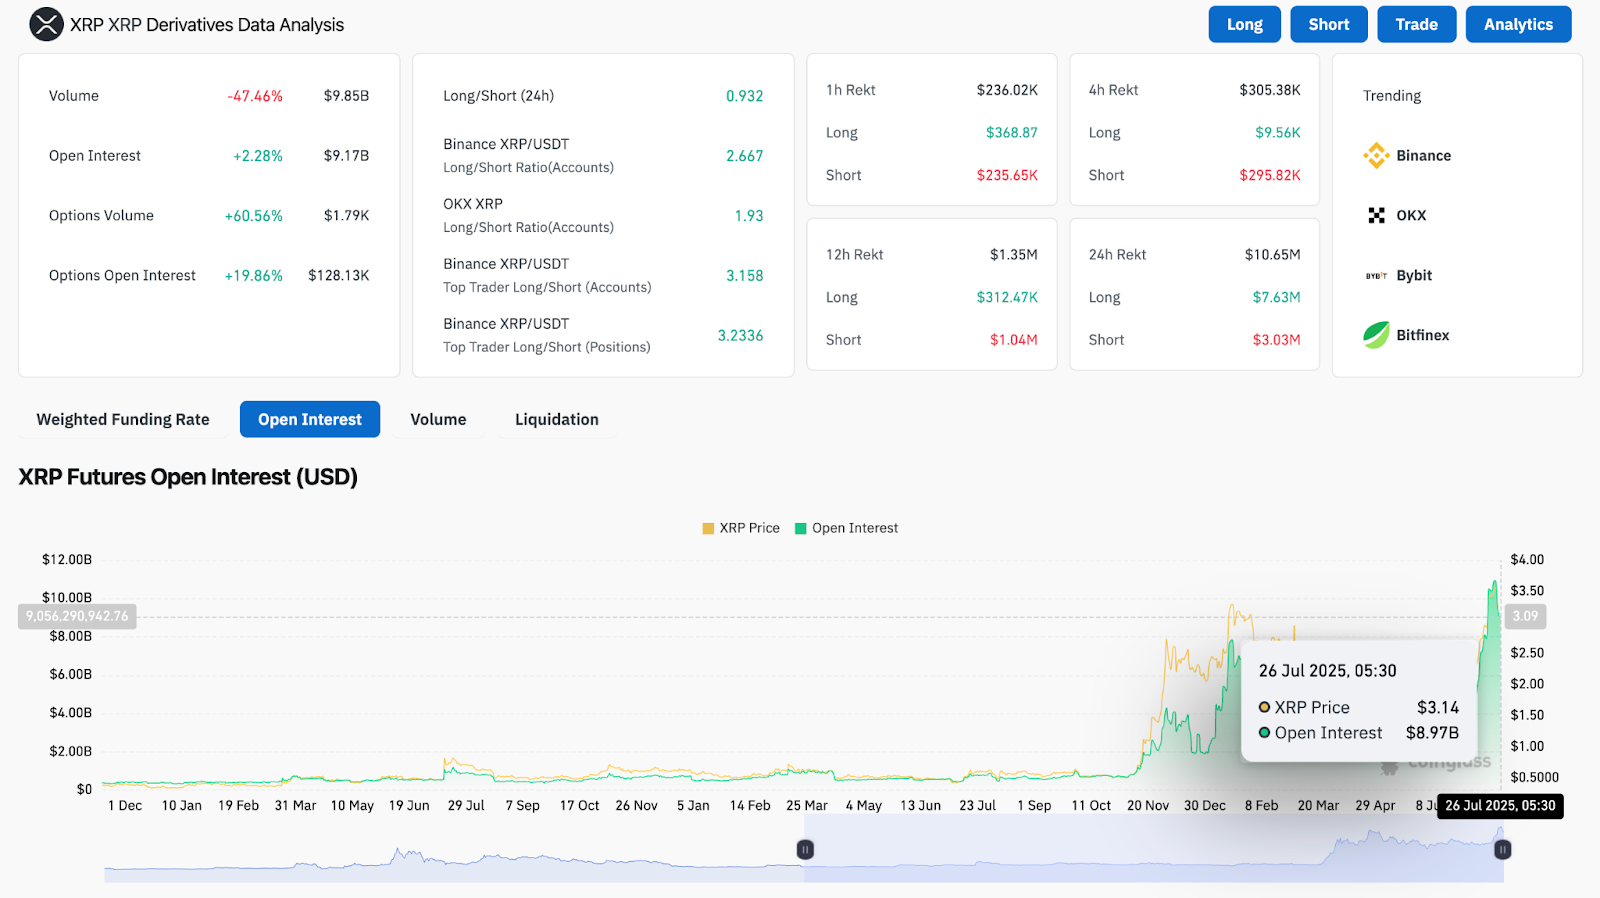
Meanwhile, the Derivatives data from Coinglass shows volume has dropped -47.46% in the past 24 hours, but open interest has risen +2.28% to $9.17B. This signals a build-up of leveraged positions despite lower activity. Binance and OKX long/short ratios remain heavily skewed toward longs (above 2.5), suggesting bullish sentiment is still dominant. However, this imbalance raises the risk of a flush if support at $3.00 breaks.
Price Compression Signals Volatility Ahead
The 4-hour Bollinger Bands are beginning to narrow, indicating a pending volatility spike. Price is coiling just below the 20 and 50 EMA confluence zone around $3.20, while candles print inside a minor range. The $3.08–$3.00 zone is a key decision point, as it aligns with both the lower Bollinger Band and the weekly 0.786 Fib.
On higher timeframes, the weekly chart shows XRP holding above the 0.618 level ($2.83) and well above the 0.5 midpoint retracement at $2.65. As long as these supports remain intact, the macro structure favors continuation toward $3.80 and beyond.
From a momentum perspective, the RSI on lower timeframes is rising toward neutral-bullish levels (currently 65.24), and MACD is crossing back up on the 30-minute view. These signals suggest a possible squeeze setup if $3.23 is reclaimed cleanly.
XRP Price Prediction: Short-Term Outlook (24H)
XRP price is now entering a volatility compression phase, with indicators and structure pointing to an upcoming expansion. If bulls regain control above $3.23, price may revisit the $3.38 level followed by the $3.60–$3.65 resistance band. A breakout from this zone could trigger renewed upside toward $3.80 and even $4.00.
On the downside, if price slips below $3.00, a pullback toward $2.83 (Fib 0.618) becomes likely, with stronger support waiting at $2.65. Below that, the long-term BOS zone around $2.20 is the major invalidation level.
Overall, XRP price today is in a consolidation phase after a sharp rally, with the next 24 hours likely to determine whether the bullish structure can continue or if a deeper retracement unfolds.
XRP Price Forecast Table: July 27, 2025
| Indicator/Zone | Level / Signal |
| XRP price today | $3.18 |
| Resistance 1 | $3.23 |
| Resistance 2 | $3.60 |
| Support 1 | $3.00 |
| Support 2 | $2.83 (Fib 0.618) |
| Weekly Fib Support Zone | $2.65–$2.83 |
| Bollinger Bands (4H) | Tightening |
| EMA Cluster (20/50/100, 4H) | $3.08–$3.23 |
| RSI (30-min) | 65.24 (Neutral-Bullish) |
| MACD (30-min) | Crossover Building |
| Open Interest (Derivatives) | $9.17B (+2.28%) |
| Volume (24h) | $9.85B (-47.46%) |
| Long/Short Ratio (Binance) | 2.667–3.158 (Long-heavy bias) |
| Smart Money Structure | CHoCH at $3.55, BOS at $2.20 |
Disclaimer: The information presented in this article is for informational and educational purposes only. The article does not constitute financial advice or advice of any kind. Coin Edition is not responsible for any losses incurred as a result of the utilization of content, products, or services mentioned. Readers are advised to exercise caution before taking any action related to the company.


