 Price Prediction for July 9, 2025")
After weeks of low volatility and consolidation, XRP price has pierced through the bull market support band and is testing the apex of a year-long triangle. XRP price today stands at $2.26, with bulls pushing to reclaim $2.30 – a level that may determine whether this breakout attempt holds or stalls.
What’s Happening With XRP’s Price?
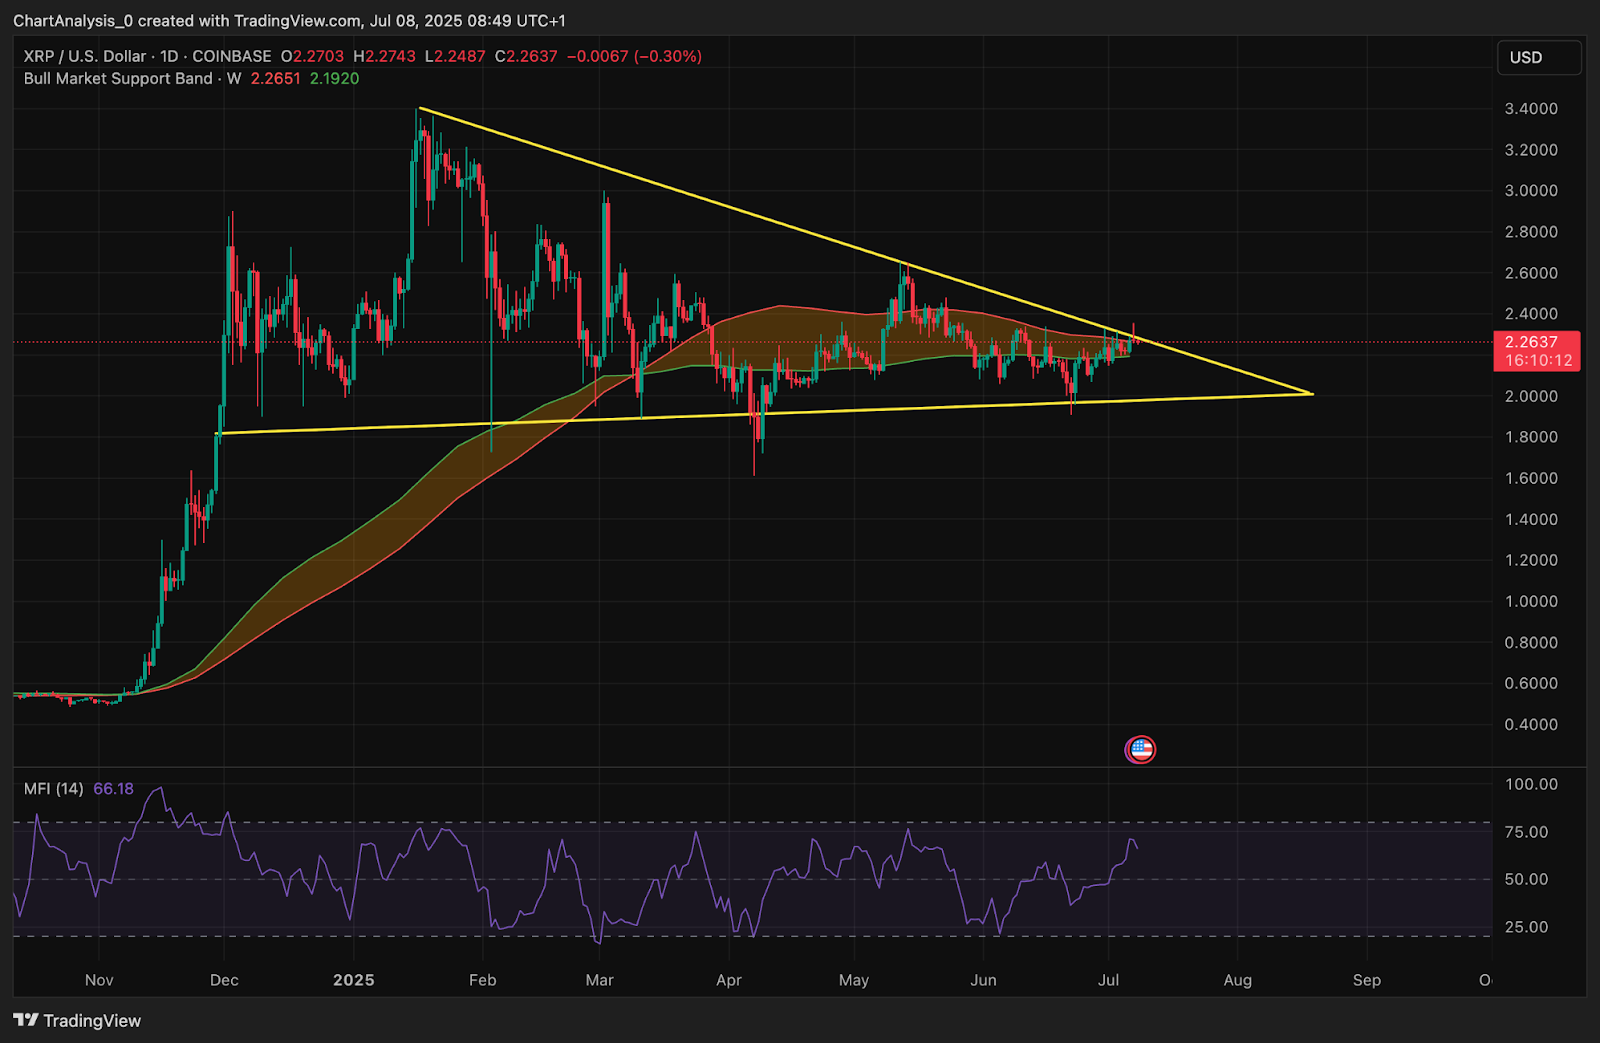
On the daily chart, XRP has spent the past few months compressing inside a symmetrical triangle pattern, bounded by descending resistance near $2.35 and rising support just above $2.00. The latest candle is nudging above the triangle’s upper boundary, testing key supply near $2.30–$2.3458.
The bull market support band, composed of weekly EMA20 and EMA21, has just been reclaimed. This is a major structural shift from previous rejections and could mark the start of a trend reversal if sustained. Meanwhile, Volume Profile shows heavy accumulation just below $2.20, and Value Area High aligns closely with the breakout zone — reinforcing its importance.
Market structure is currently neutral-bullish, but upside conviction will depend on a decisive move above $2.345 and weekly close beyond $2.36.
Why Is The XRP Price Going Up Today?
Why XRP price going up today can be attributed to a combination of volume expansion, derivative positioning, and momentum signals triggering near a major compression zone.
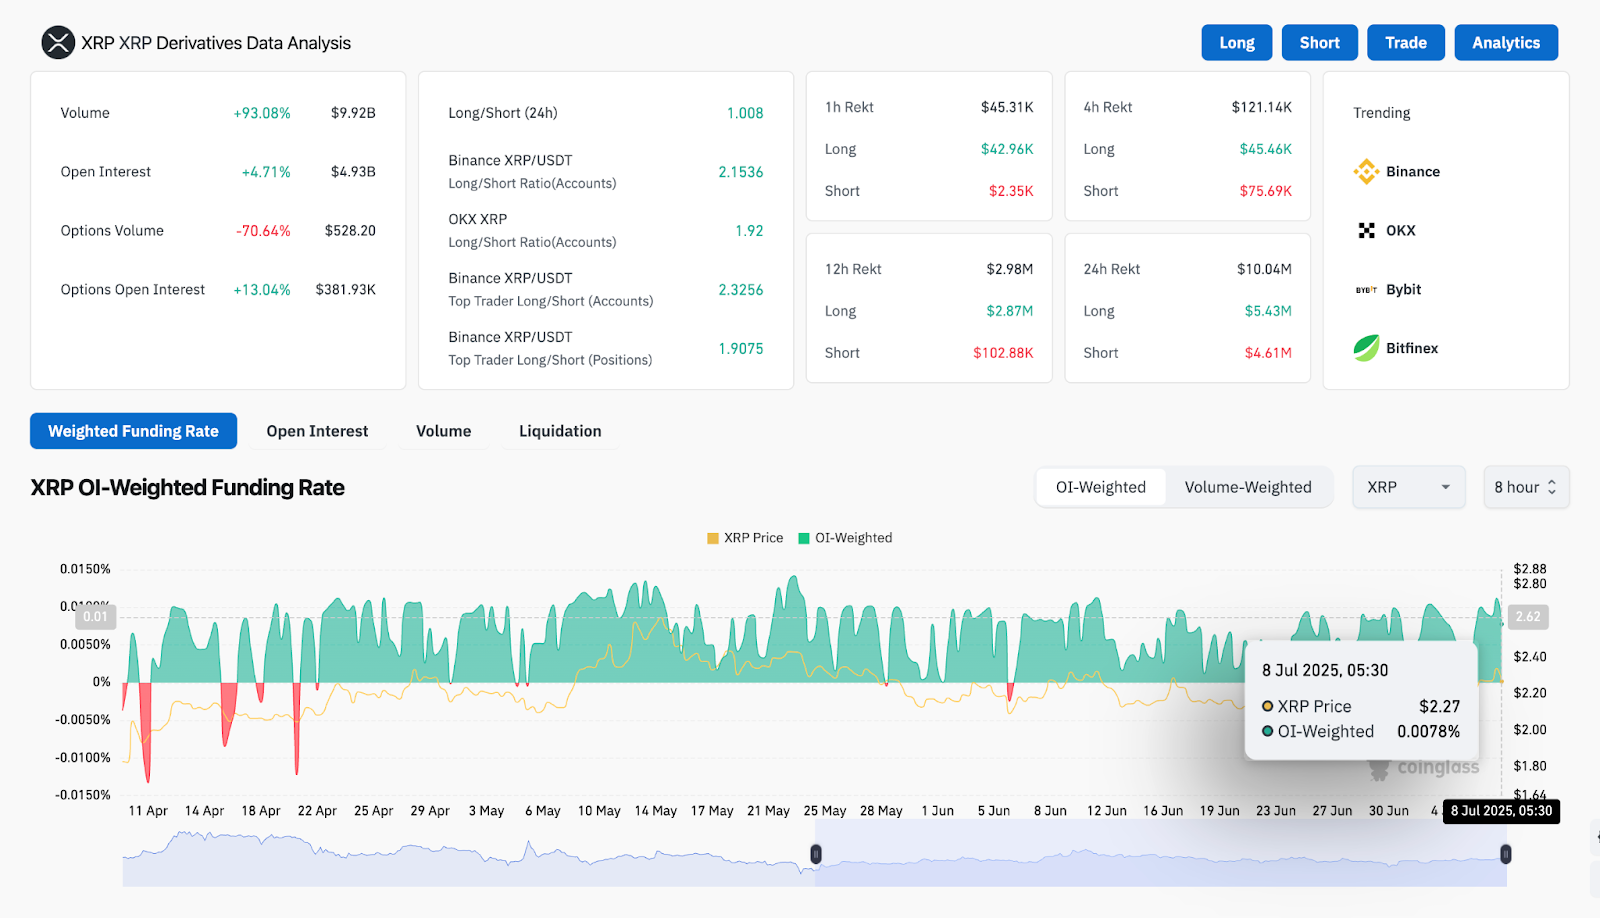
Derivatives data from Coinglass shows a 93% surge in 24-hour volume to $9.92B and open interest climbing 4.7% to $4.93B, indicating new capital flow into the XRP market. Notably, Binance long/short ratios remain long-heavy, with top trader positioning skewed 2.3:1 on the long side. This supports the idea that institutional and whale interest is building near the breakout zone.
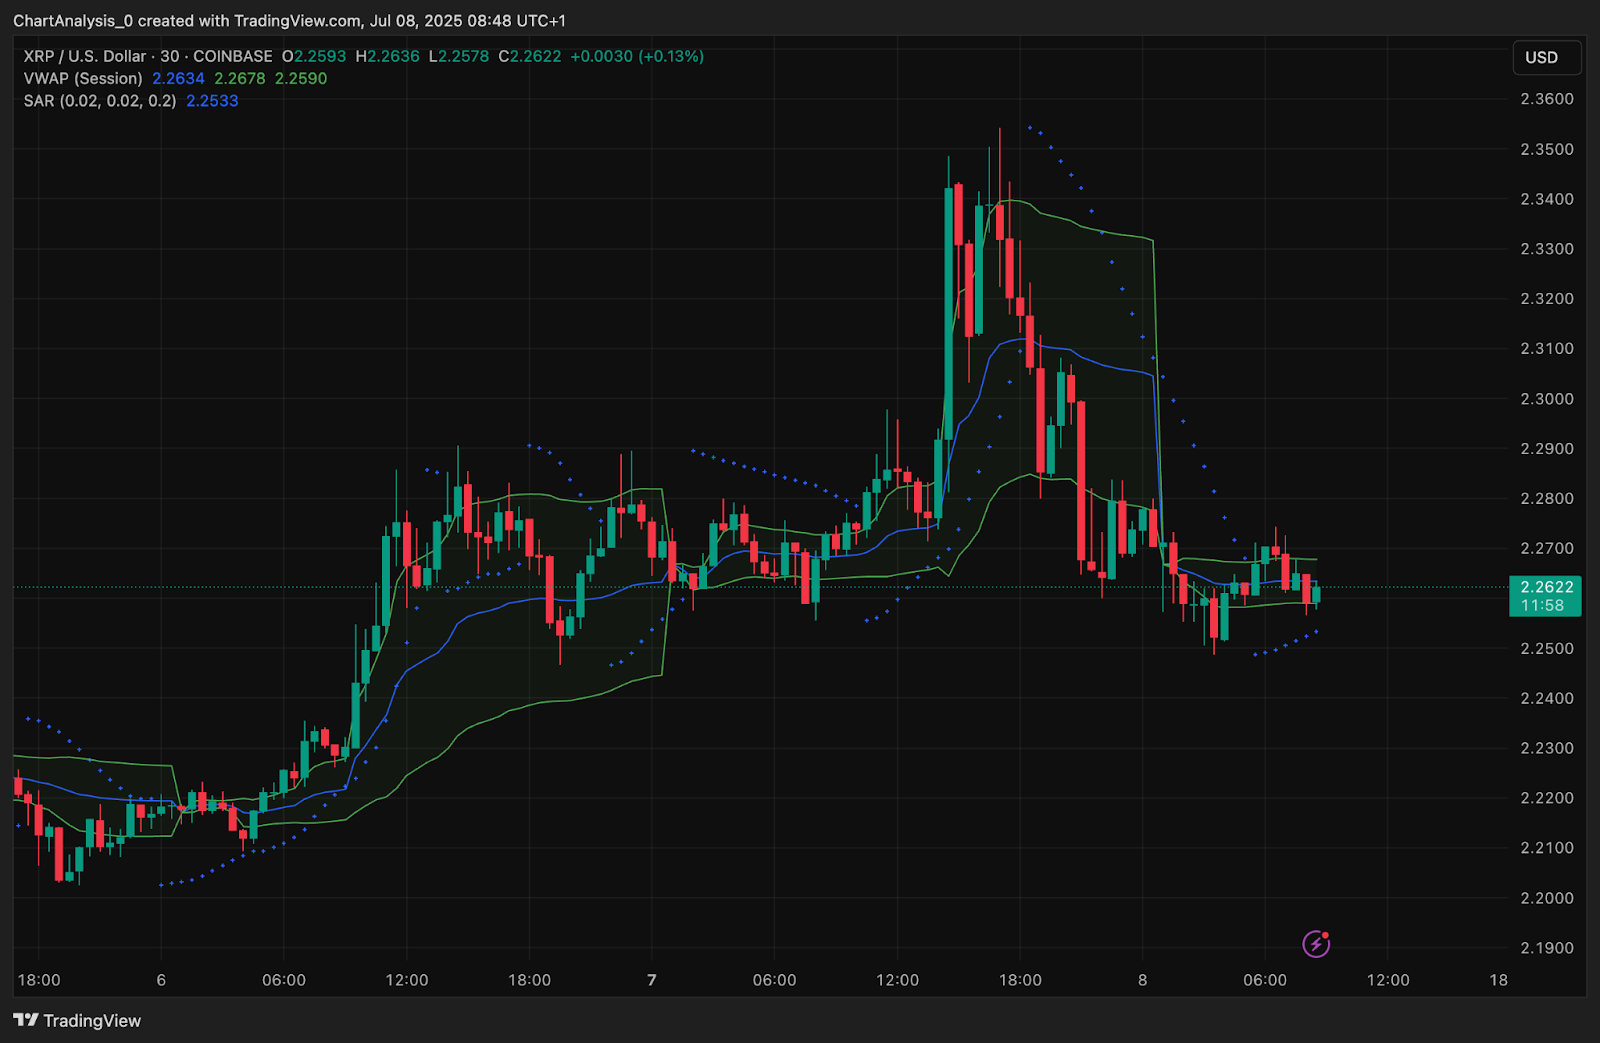
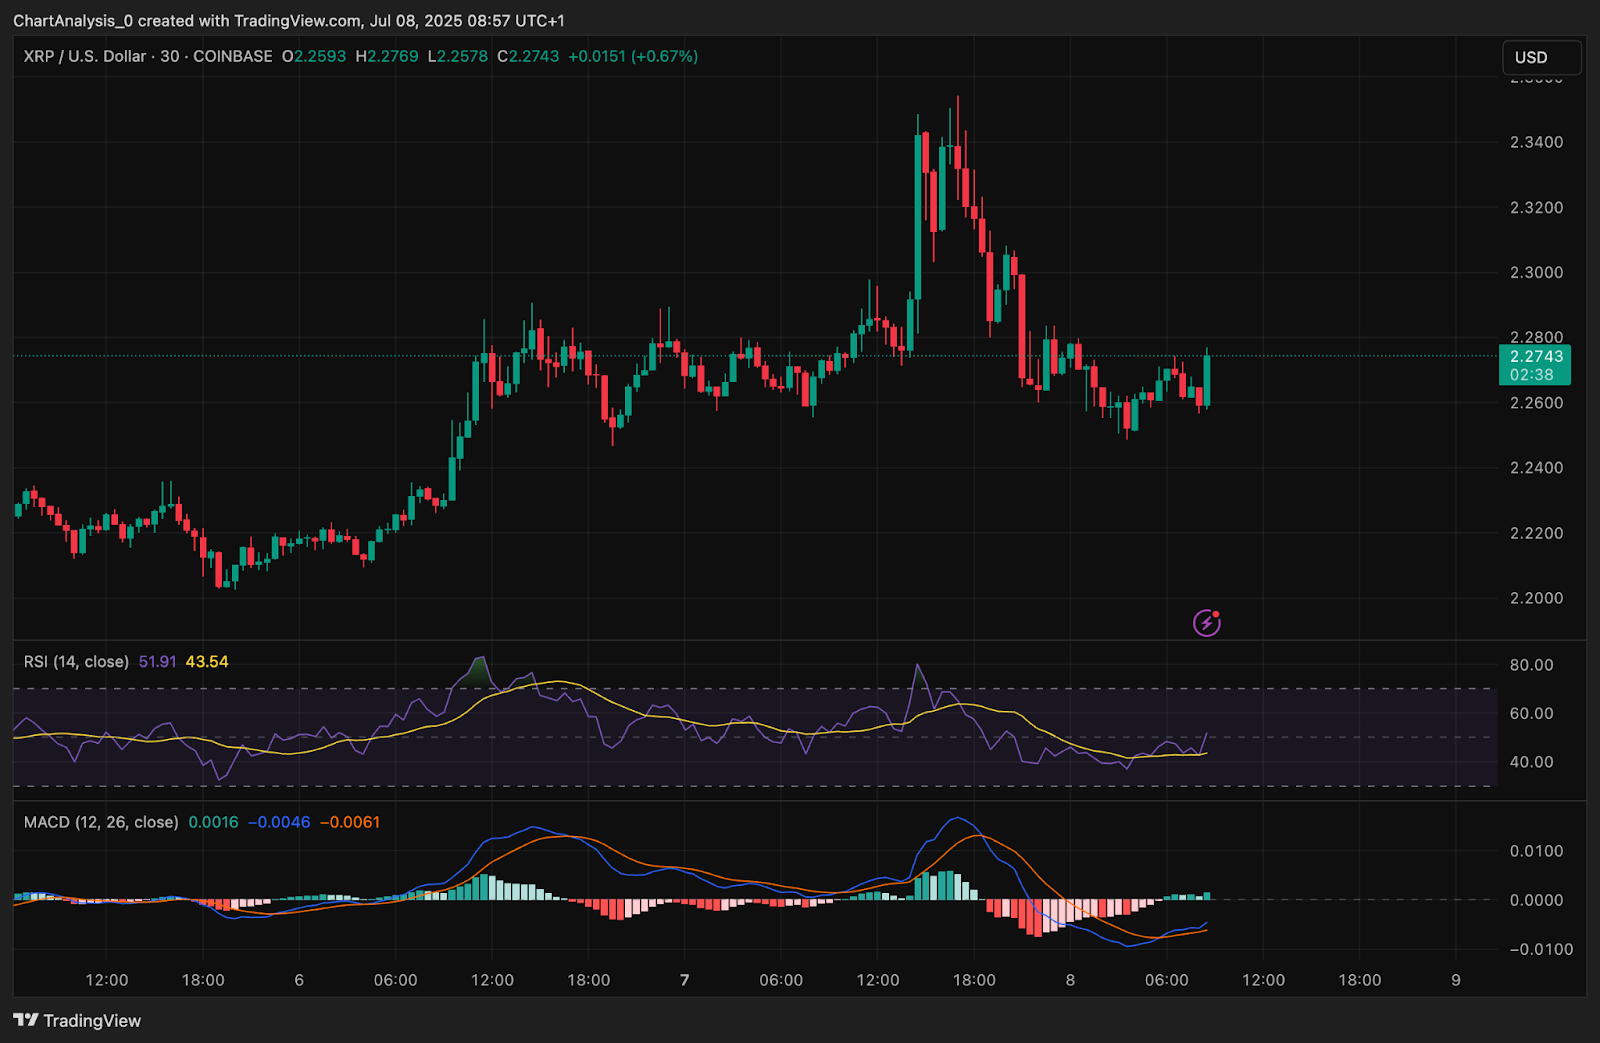
On the 30-minute chart, XRP is holding just above session VWAP ($2.26) with a recent SAR flip below price, a short-term bullish signal. The Bollinger Bands are beginning to expand again, hinting at a new volatility cycle.
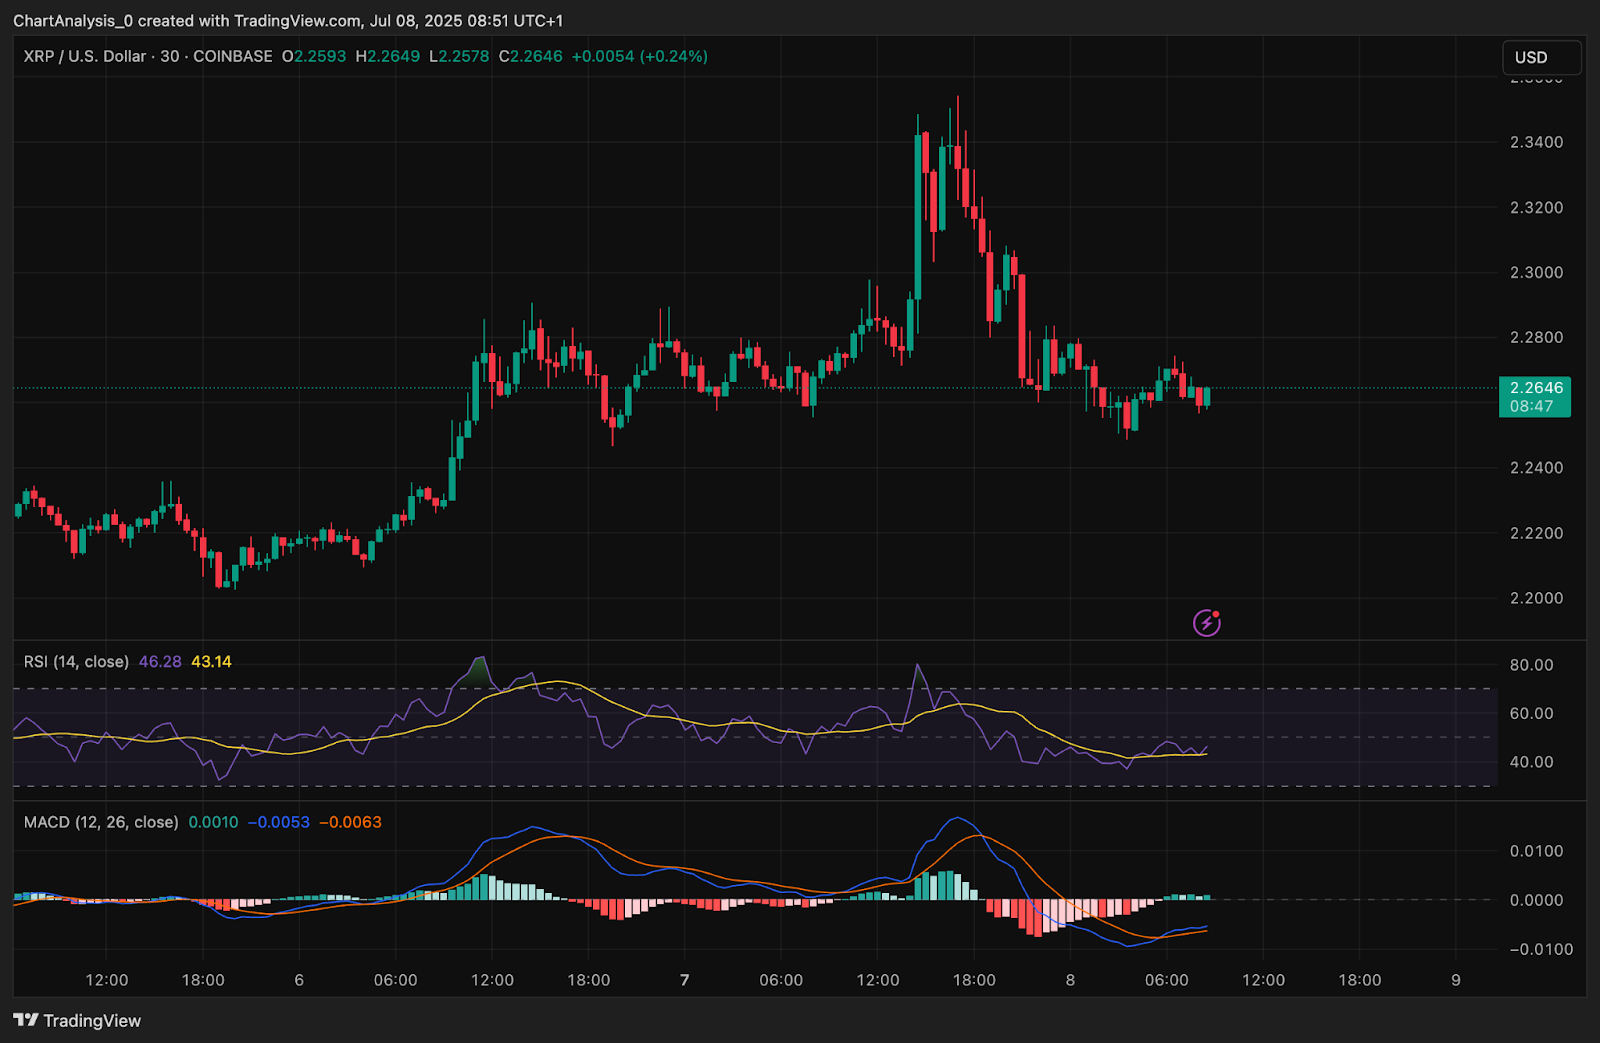
However, RSI remains mixed at 46.2, and MACD shows a narrowing bearish histogram, implying that while momentum favors bulls, confirmation is still pending a breakout retest and strong volume continuation.
XRP Technical Indicators Show Compression and Support Alignment
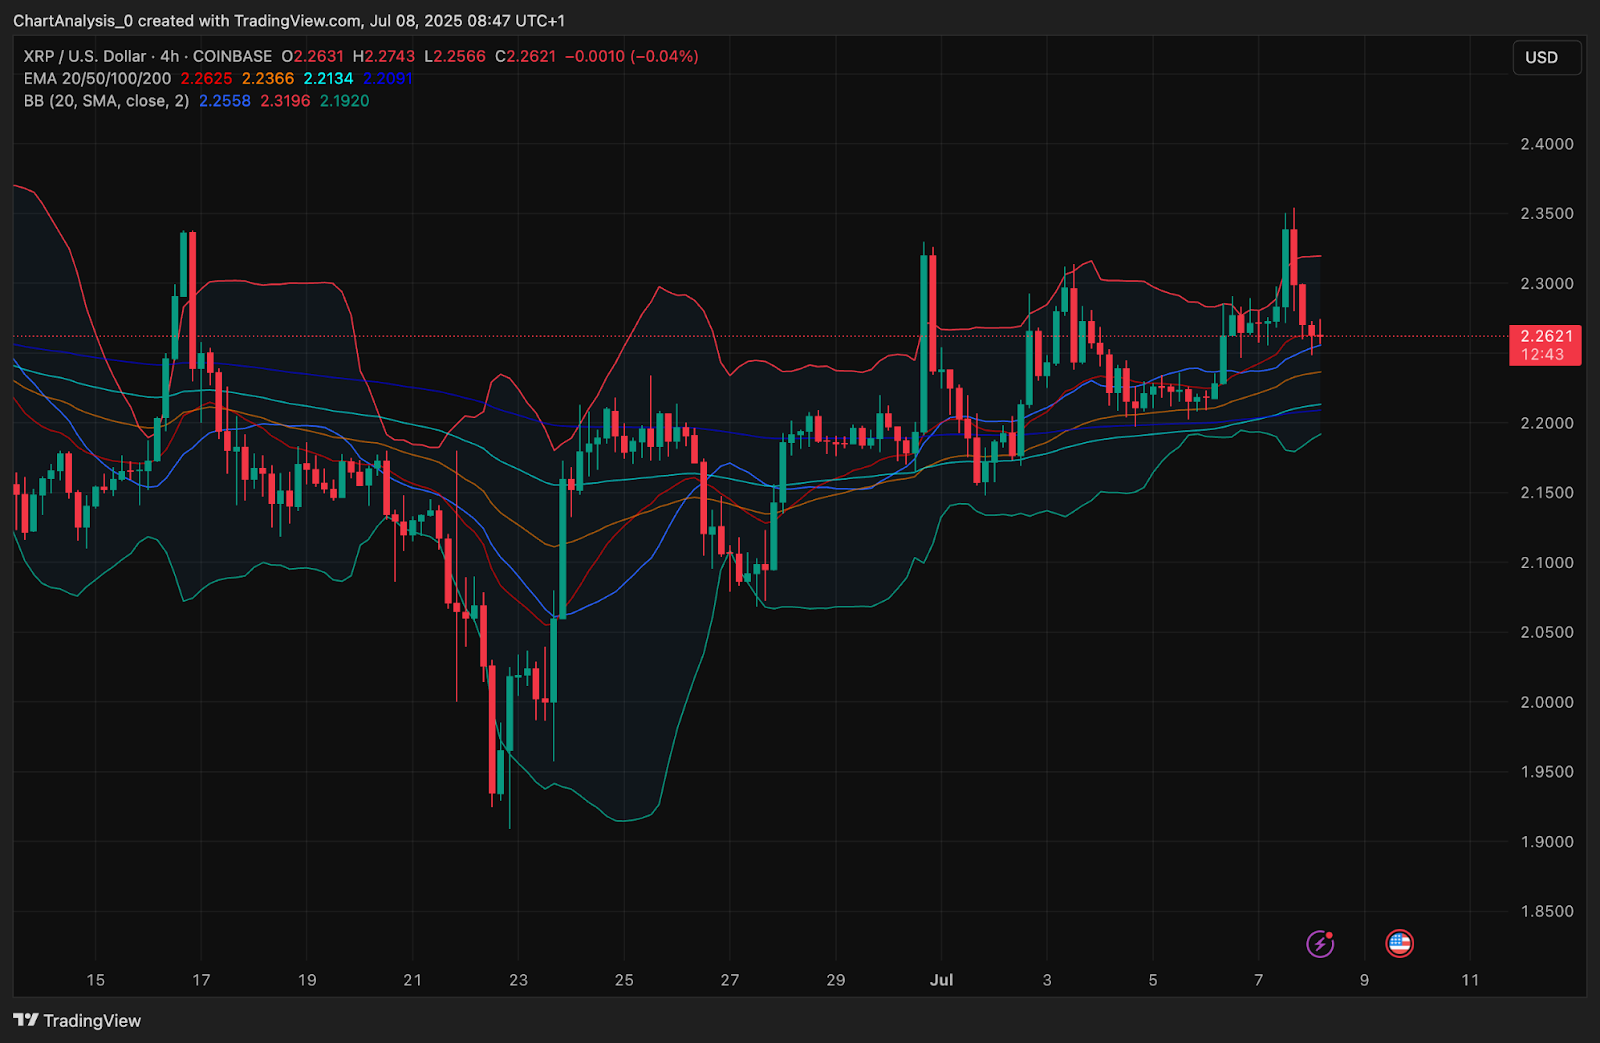
The 4-hour chart reveals a full alignment of the 20/50/100/200 EMA cluster below current price. This rare bullish stack provides strong dynamic support between $2.21 and $2.24. The most recent rejection from $2.35 pushed XRP back into the mid-band, where Bollinger Bands are now coiling tightly. This sets up a potential squeeze breakout if buyers return.
On the daily timeframe, Chande Momentum Oscillator prints a reading near 20.5, while the Directional Movement Index (DMI) shows +DI leading slightly with ADX strengthening — typically a sign of trend development.
The Money Flow Index (MFI) stands at 66.1, nearing overbought territory. This suggests inflows are strong, but traders should watch for any exhaustion above $2.30. Overall, momentum indicators are in favor of continuation but require a breakout above $2.345 to confirm trend shift.
XRP Price Prediction: Short-Term Outlook (24H)
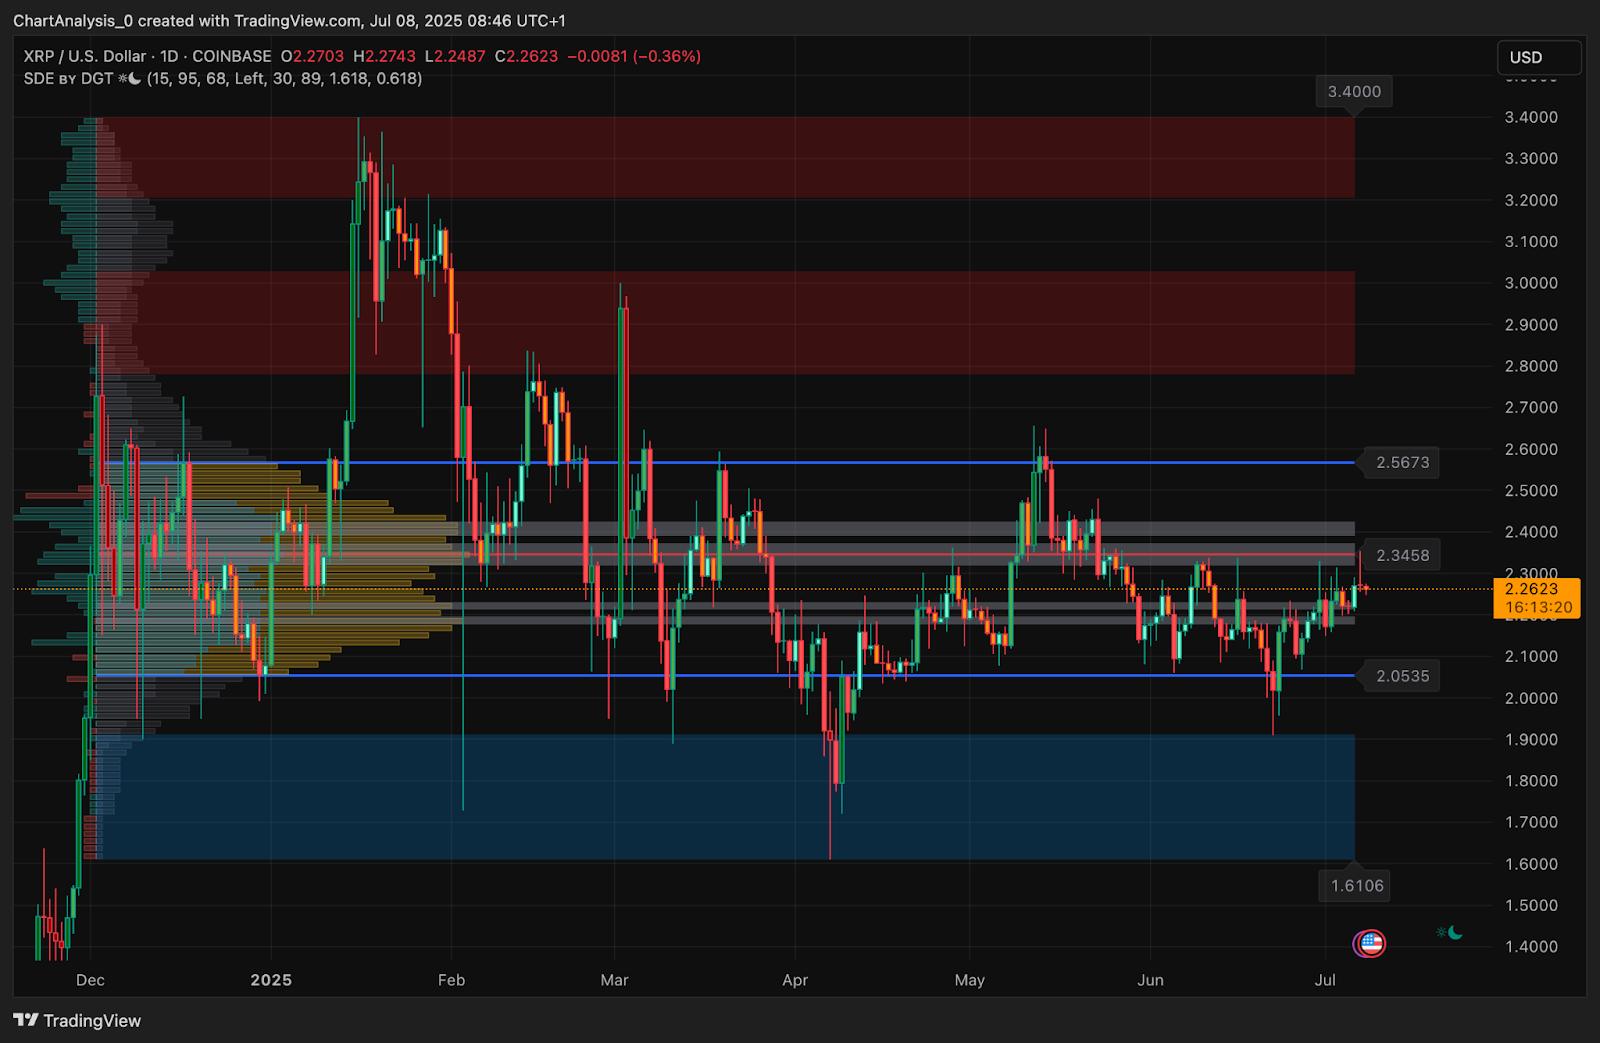
XRP price is now at a technical inflection point. A clean breakout above $2.345 could send the pair toward $2.567 — the upper boundary of the supply zone. Beyond that, the next resistance lies at $2.70, followed by the major supply band near $3.00.
If rejection persists and XRP price today falls below $2.20, a retracement into the $2.10–$2.0535 range becomes likely. That zone includes prior lows and volume profile support. Deeper breakdowns could target $1.90 if the triangle breakout fails entirely.
That said, given the current breakout pressure, long-heavy derivatives bias, and bullish EMA alignment, the near-term bias remains constructively bullish as long as XRP holds above $2.20.
XRP Price Forecast Table: July 9, 2025
| Indicator/Zone | Level / Signal |
| XRP price today | $2.26 |
| Resistance 1 | $2.3458 |
| Resistance 2 | $2.567 |
| Support 1 | $2.200 |
| Support 2 | $2.0535 |
| MACD (30-min) | Bearish, flattening |
| RSI (30-min) | 46.2 (Neutral to Weak) |
| Parabolic SAR | Bullish (dots below price) |
| Bollinger Bands (4H) | Tightening near upper mid-band |
| EMA Cluster (4H) | 20/50/100/200 Bullish Stack |
| ChandeMO | 20.56 (Building Momentum) |
| MFI (1D) | 66.1 (Strong inflows) |
| DMI (1D) | +DI leads, ADX rising |
| Derivatives Volume | $9.92B (+93%), Long-Biased |
| Open Interest | $4.93B (+4.7%) |
| VWAP (30-min) | $2.263 (Near Price) |
| Options IV (July 25, $2.30) | 66.6%, Put Open Interest 5170 |
Disclaimer: The information presented in this article is for informational and educational purposes only. The article does not constitute financial advice or advice of any kind. Coin Edition is not responsible for any losses incurred as a result of the utilization of content, products, or services mentioned. Readers are advised to exercise caution before taking any action related to the company.


