
The XRP price today is trading around $2.159, down 0.3% on the day, as the market cools off following a failed breakout above the $2.30 zone. After a recent rally that lifted prices to $2.35, sellers have reclaimed control near major resistance clusters. A rejection near the R3 level at $2.236 and loss of bullish pressure have pushed XRP back toward the median pitchfork line around $2.11.
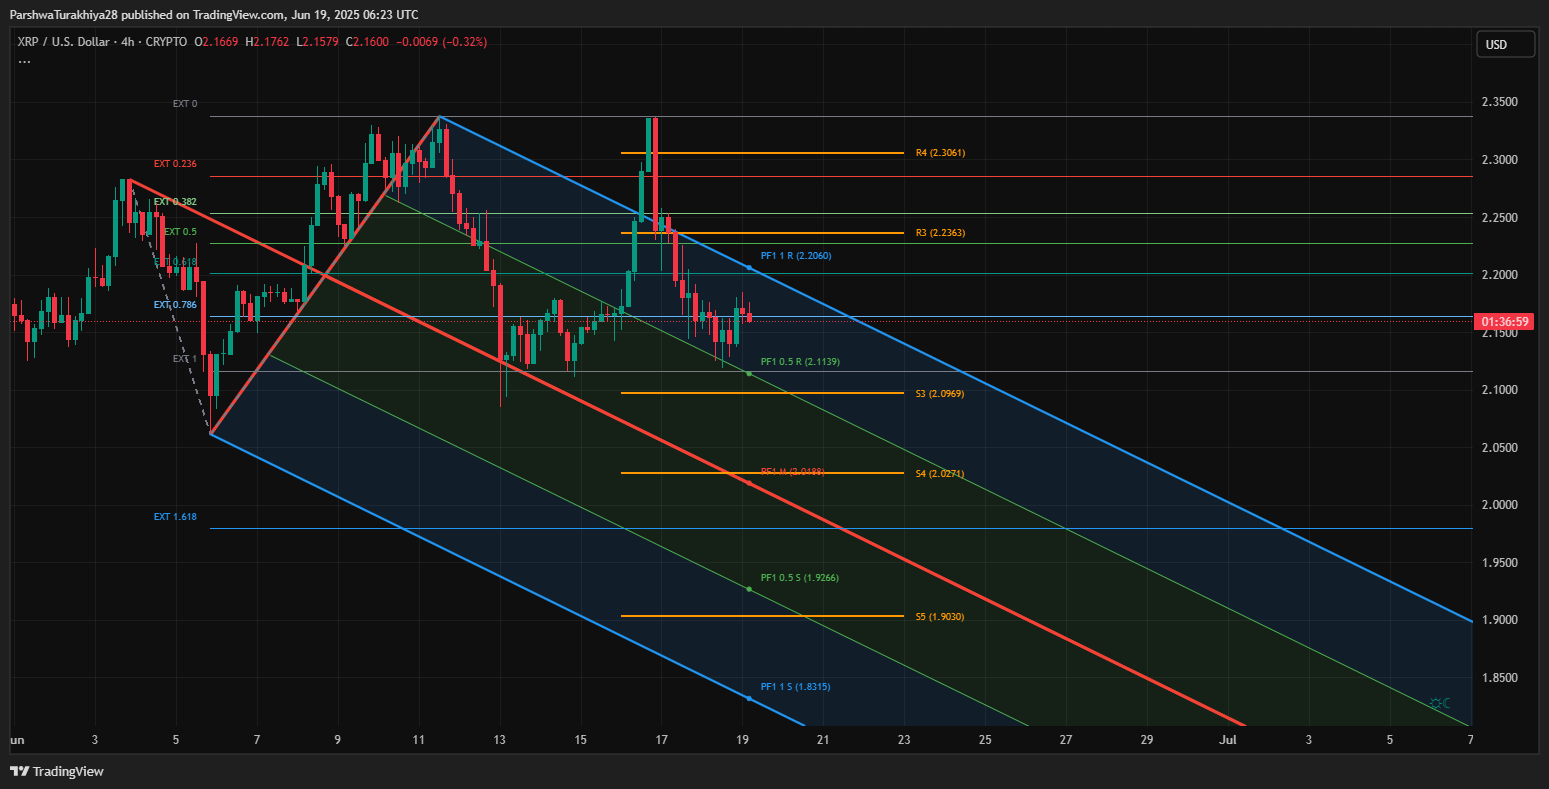
On the 4-hour chart, XRP has re-entered a bearish pitchfork descending channel after briefly spiking above its upper boundary. Price action is now caught between Fibonacci pivots and declining EMA bands, signaling rising uncertainty. The immediate range is defined between $2.113 (mid-support) and $2.206 (resistance).
What’s Happening With XRP’s Price?
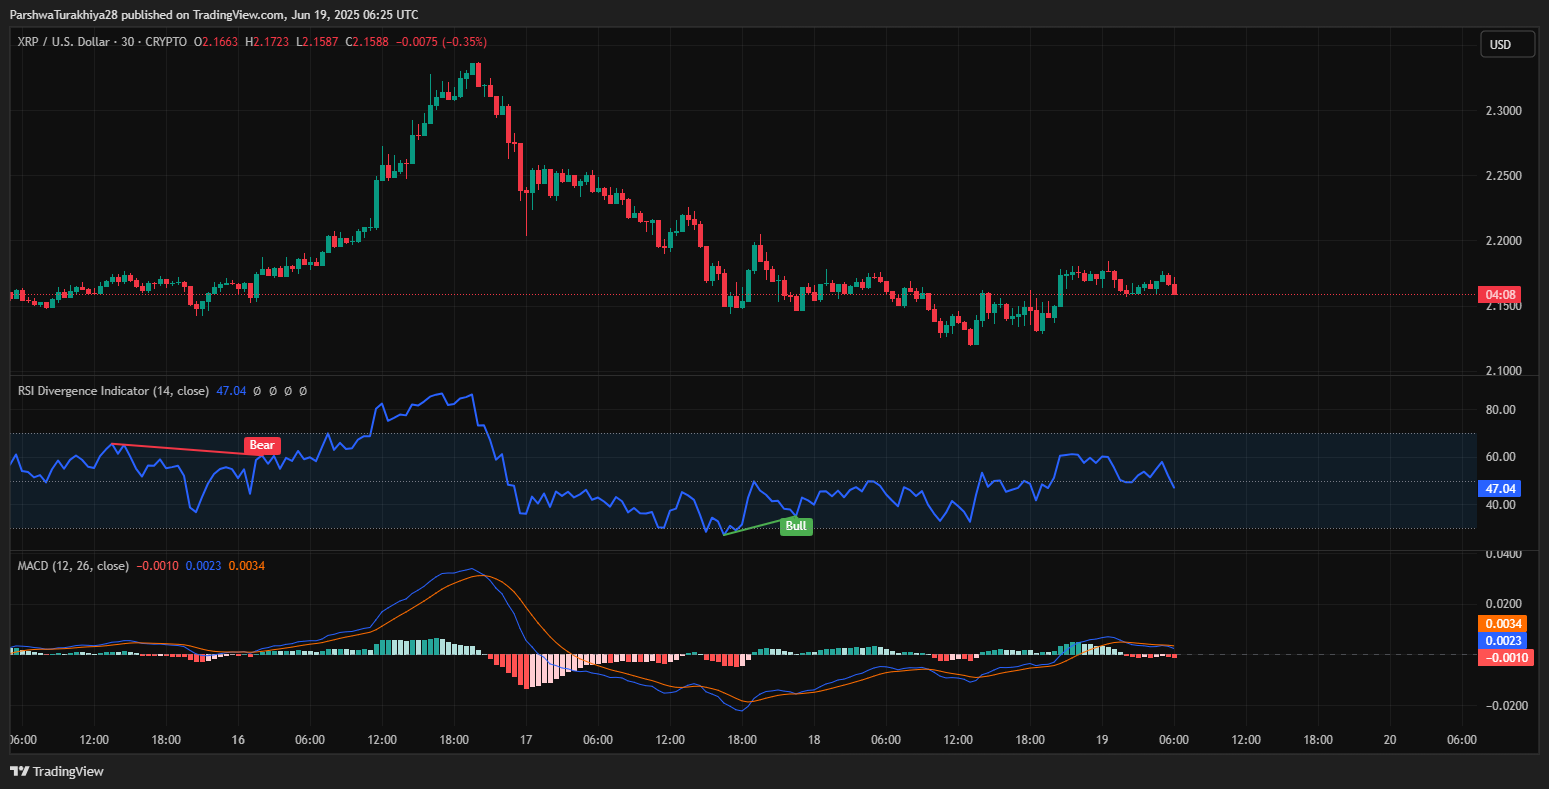
The short-term XRP price action reveals a slow bleed after the post-rally high near $2.35. Momentum indicators like the 30-minute RSI (47.04) remain neutral, showing little directional bias. MACD has flattened with a weak bullish crossover that lacks follow-through, while the TSI (Trend Strength Index) holds deep in negative territory at -0.76.
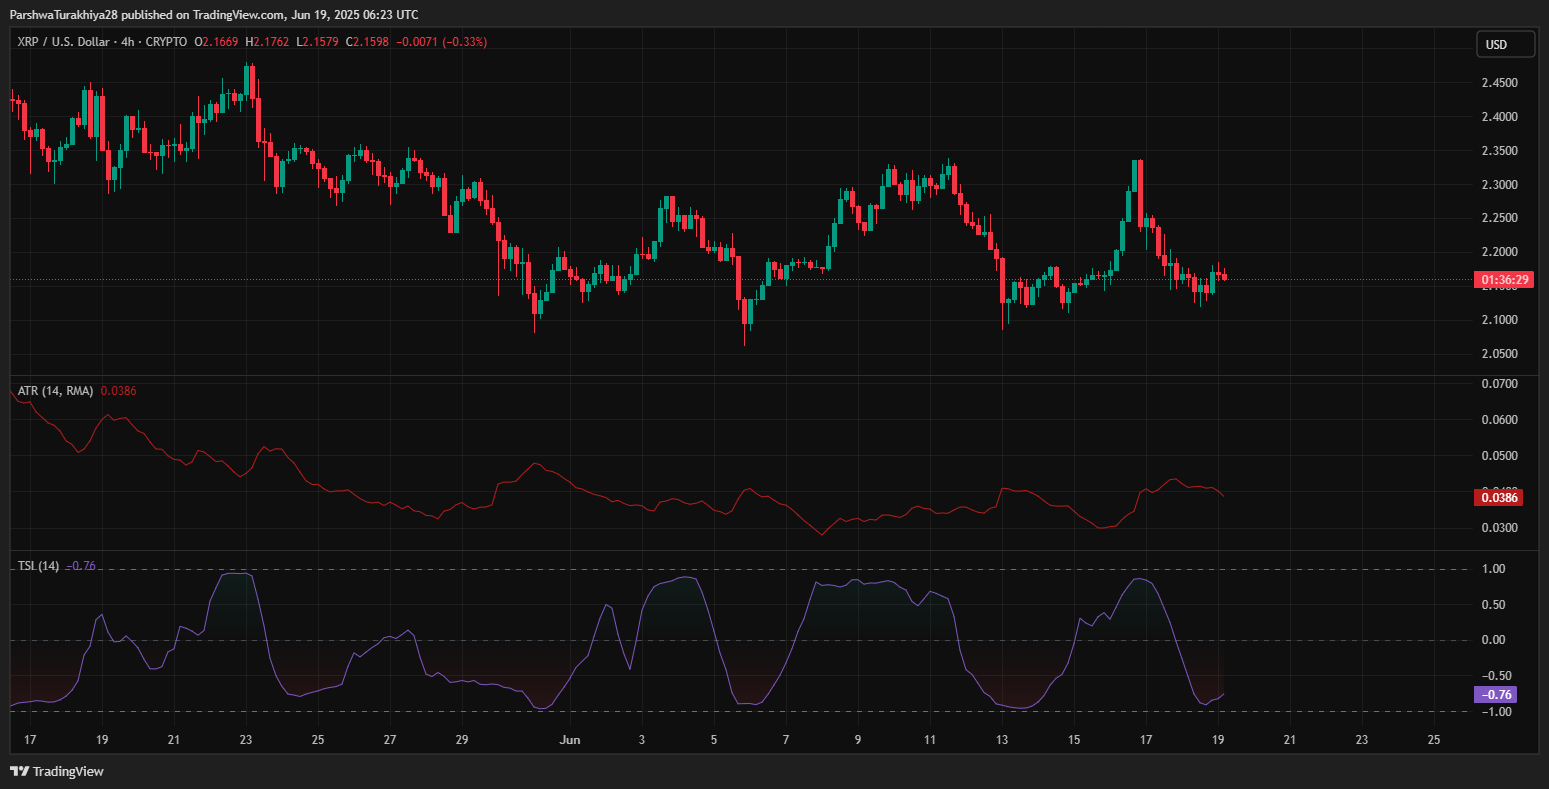
Notably, the ATR (14) continues to fall, reaching 0.0386, indicating contracting volatility. This aligns with narrowing candles and tighter Bollinger/Keltner channel ranges. XRP is currently hovering just above the Keltner midline ($2.16), hinting at balance but lacking momentum to break higher.
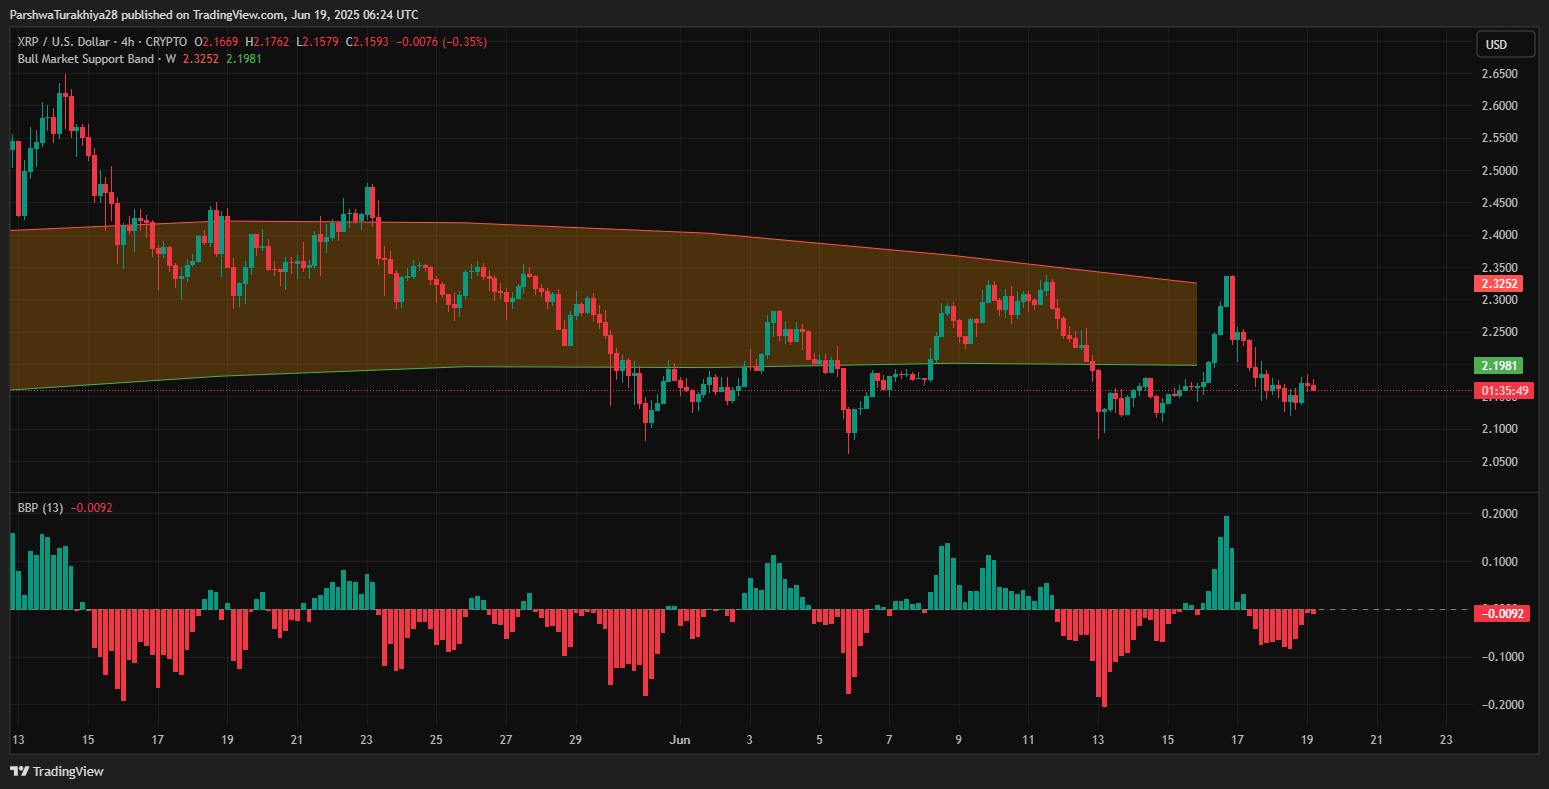
The BBP (Bull Bear Power) has turned slightly negative again (-0.0092), while the price hovers beneath the bull market support band ($2.1981–$2.3252), suggesting bullish structure is weakening.
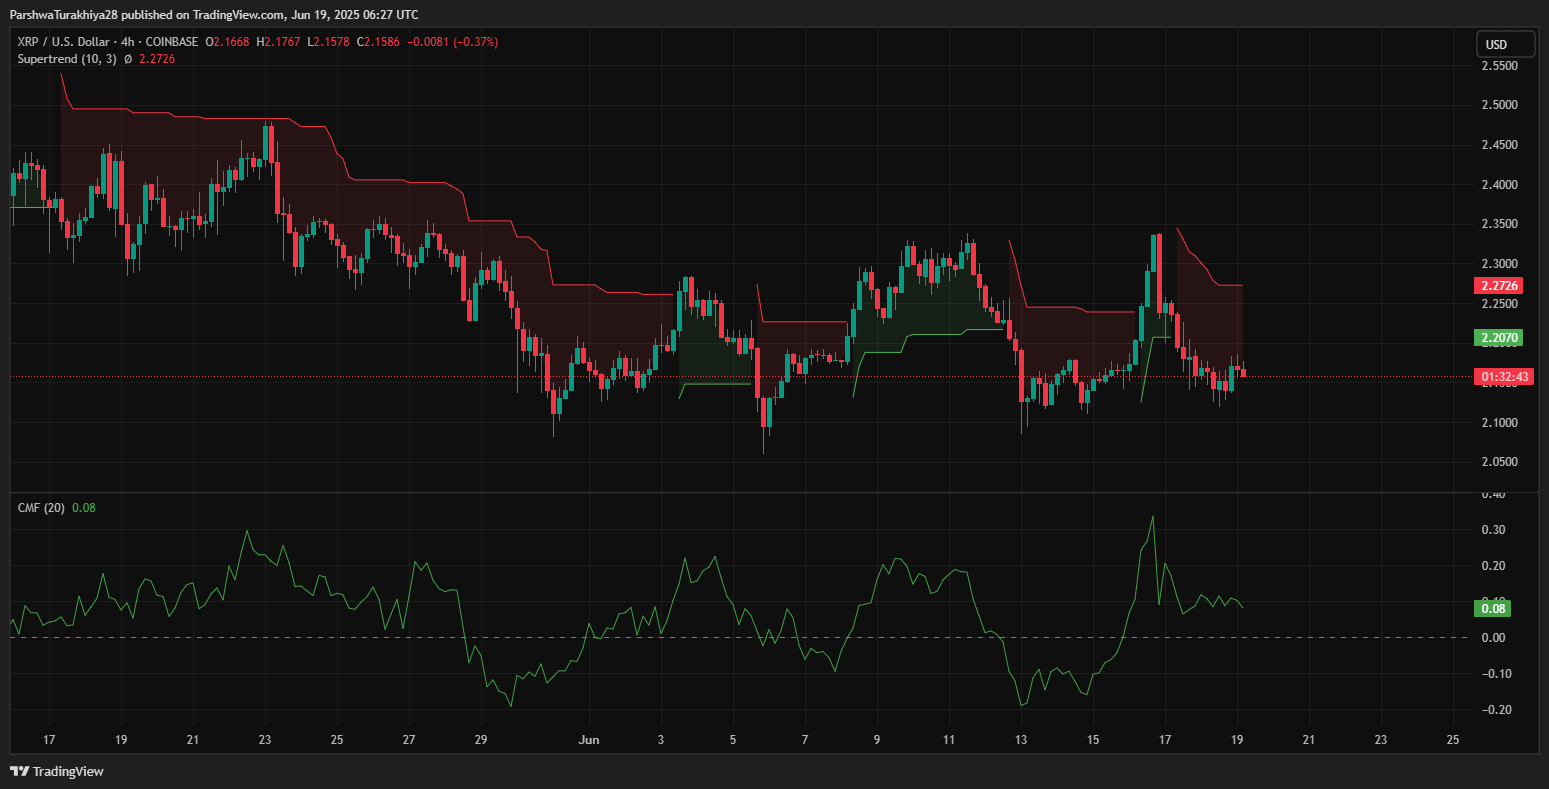
The Supertrend indicator has flipped bearish as well, with its trend zone now positioned above the current price near $2.27, reinforcing downside pressure. On the volume side, the Chaikin Money Flow (CMF) remains slightly positive at 0.08, implying marginal accumulation. However, the uptick is not strong enough to suggest a sustained buying trend.
Why is the XRP Price Going Down Today? Loss of Smart Money Momentum
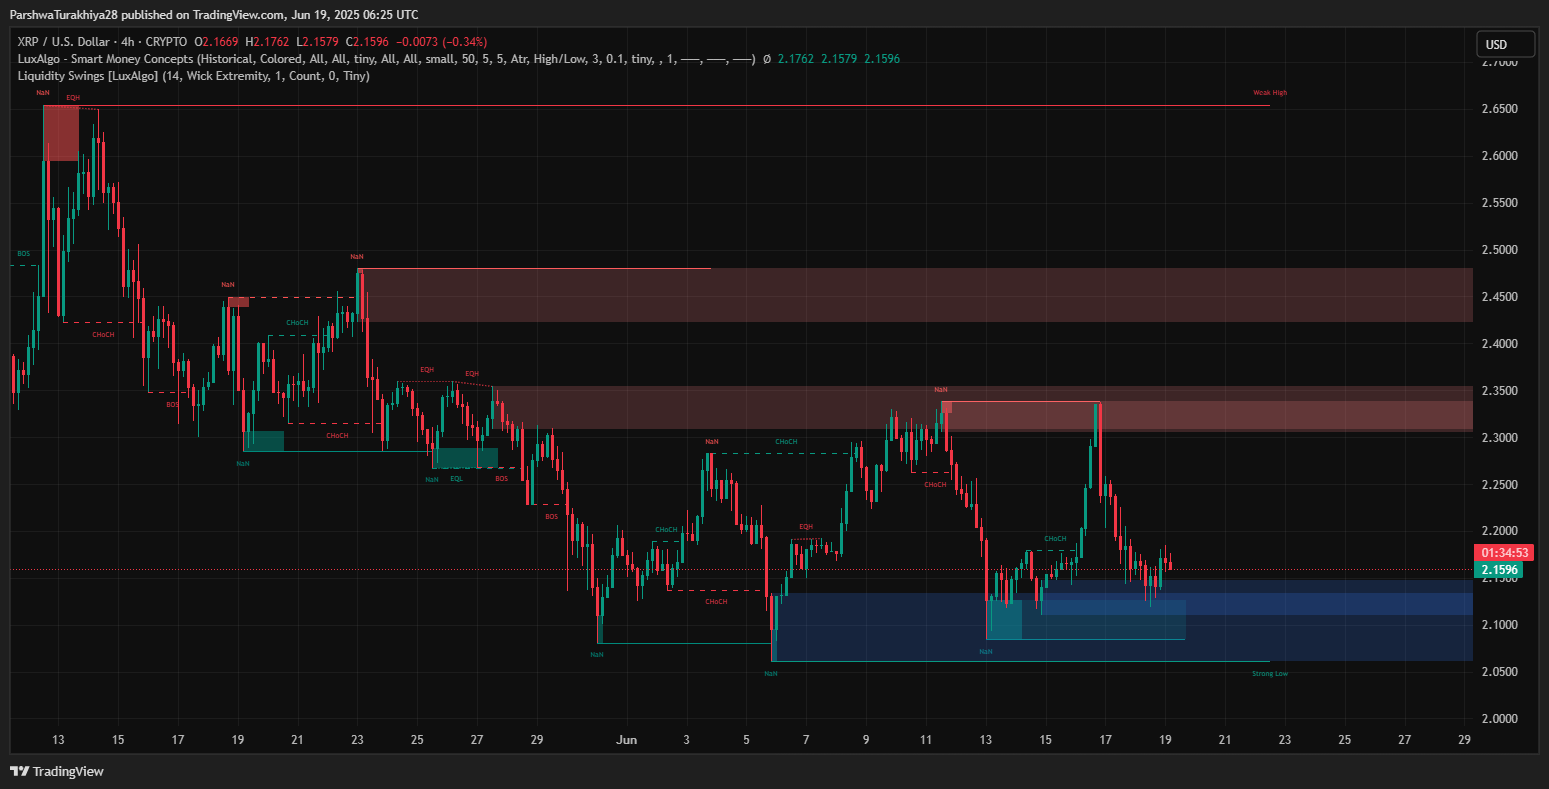
A closer look at liquidity structures reveals that XRP failed to sustain its breakout from a CHoCH zone, followed by a sharp drop into a demand block near $2.10. This area now acts as temporary support, but the inability to push higher from this zone shows weakening smart money intent.
The RSI divergence chart confirms this shift: after a clear bearish divergence before the drop, no new bullish divergence has emerged. MACD, while showing a slight recovery, is still hovering around the baseline with minimal volume.
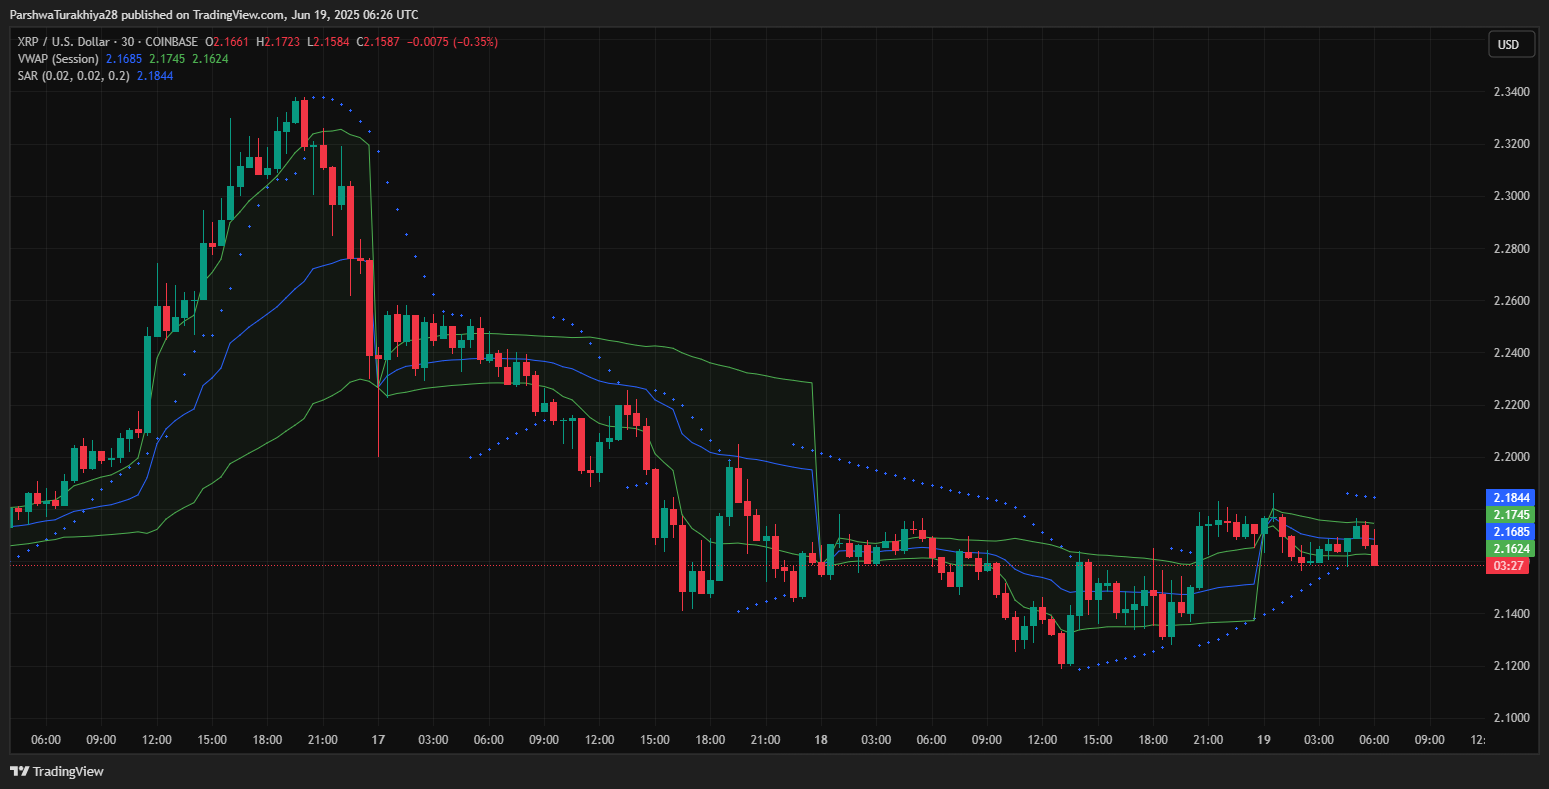
Adding to bearish bias, the VWAP ($2.1745) and Parabolic SAR ($2.1844) both sit above the current price, reinforcing intraday resistance. The 30-minute Supertrend is also in sell mode with the threshold at $2.27. Collectively, these indicators reflect why XRP price going down today despite recent spikes.
Short-Term Outlook: Can XRP Reclaim $2.20 Or Will It Break Lower?
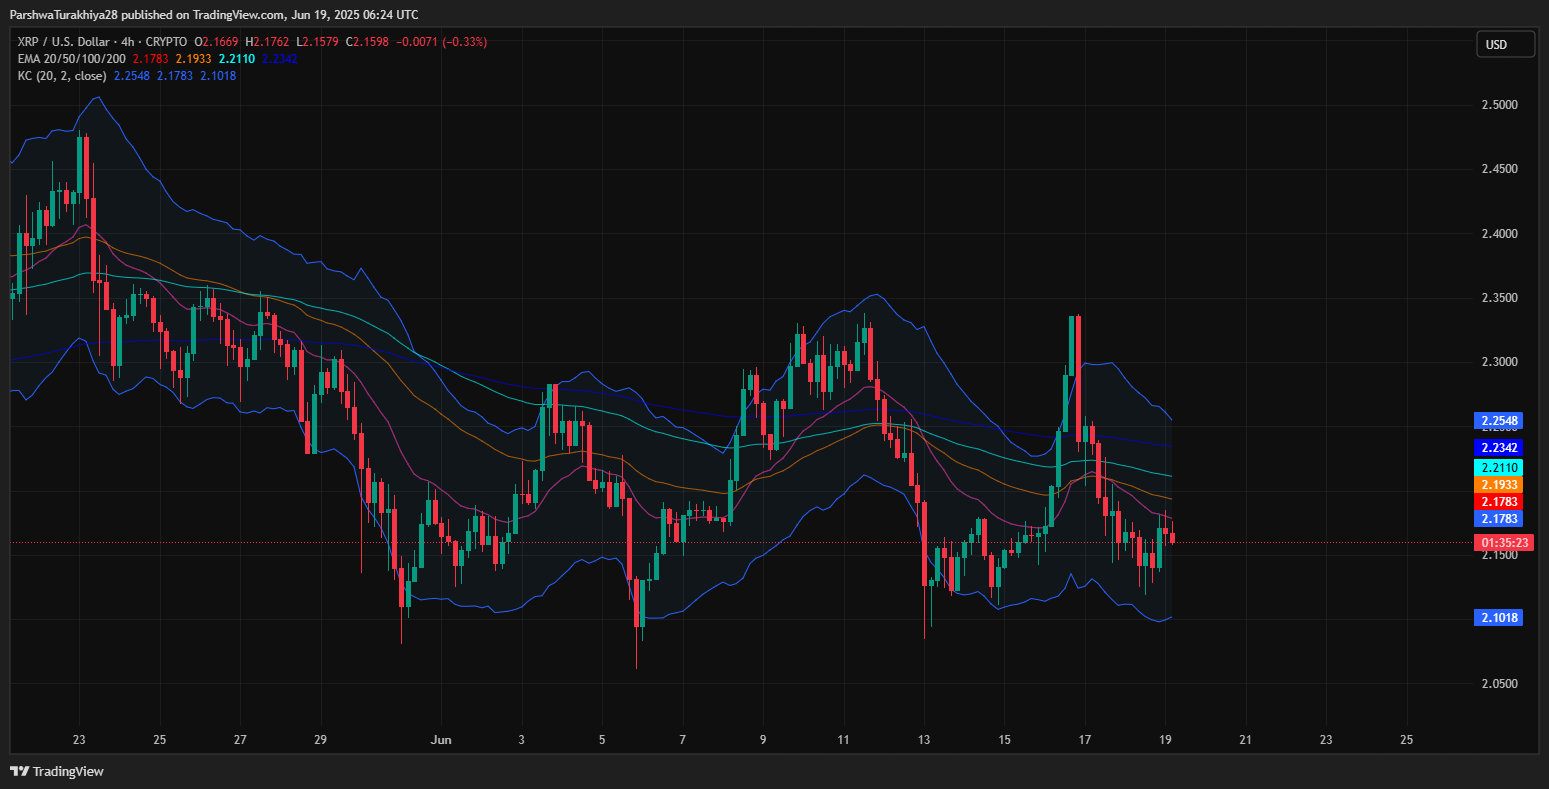
For bulls to regain control, XRP must close above $2.206 (R1 pivot) and break past the confluence of 20/50 EMA levels around $2.18–$2.21. A successful breach of $2.236 (R3) could open the path toward $2.306 (R4) and even the Fib extension level near $2.35.
However, a failure to hold above $2.113 may push XRP back into the lower pitchfork channel, exposing support levels at $2.02 and $1.926. The 1.618 extension at $1.8315 stands as a potential worst-case retracement target if broader market sentiment weakens further.
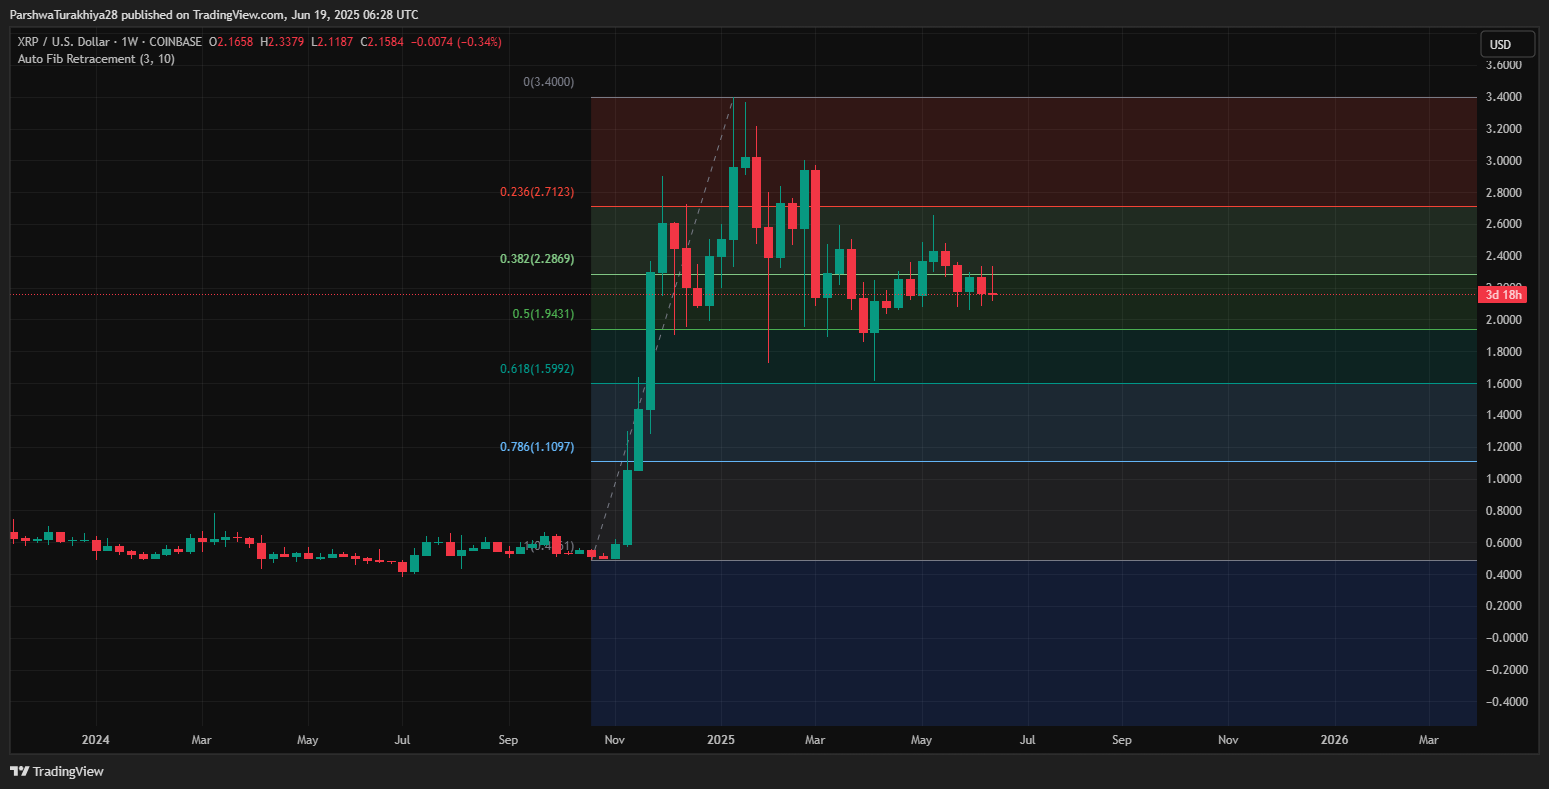
From a higher-timeframe perspective, the weekly structure shows XRP respecting the 38.2% retracement at $2.28 but unable to break higher. If weekly closes remain under this threshold, more downside pressure is likely.
XRP Price Forecast Table: June 20, 2025
| Indicator/Zone | Level (USD) | Signal |
| Resistance 1 (R1 Pivot) | 2.206 | Intraday resistance |
| Resistance 2 (R3 Pivot) | 2.236 | Breakout confirmation |
| Resistance 3 (Swing High) | 2.35 | Short-term top |
| Support 1 (PF Midline) | 2.113 | Key holding zone |
| Support 2 (Demand Block) | 2.02 | Breakdown trigger |
| Support 3 (EXT 1.618) | 1.8315 | Worst-case retracement |
| 20/50/100/200 EMA Avg | 2.178–2.234 | Dynamic resistance cluster |
| RSI (30-min) | 47.04 | Neutral |
| MACD | Flat | Low momentum |
| ATR (14) | 0.0386 | Volatility compression |
| BBP | -0.0092 | Bearish bias |
| VWAP/SAR | Above price | Pressure zone |
Disclaimer: The information presented in this article is for informational and educational purposes only. The article does not constitute financial advice or advice of any kind. Coin Edition is not responsible for any losses incurred as a result of the utilization of content, products, or services mentioned. Readers are advised to exercise caution before taking any action related to the company.


