
The XRP price today is trading around $2.063, struggling to maintain upside momentum after repeated rejections near the $2.18–$2.22 resistance band. Despite broader strength in crypto majors, XRP price action reflects intraday weakness, likely driven by persistent outflows and a sharp cluster of options expiry positioning.
What’s Happening With XRP’s Price?
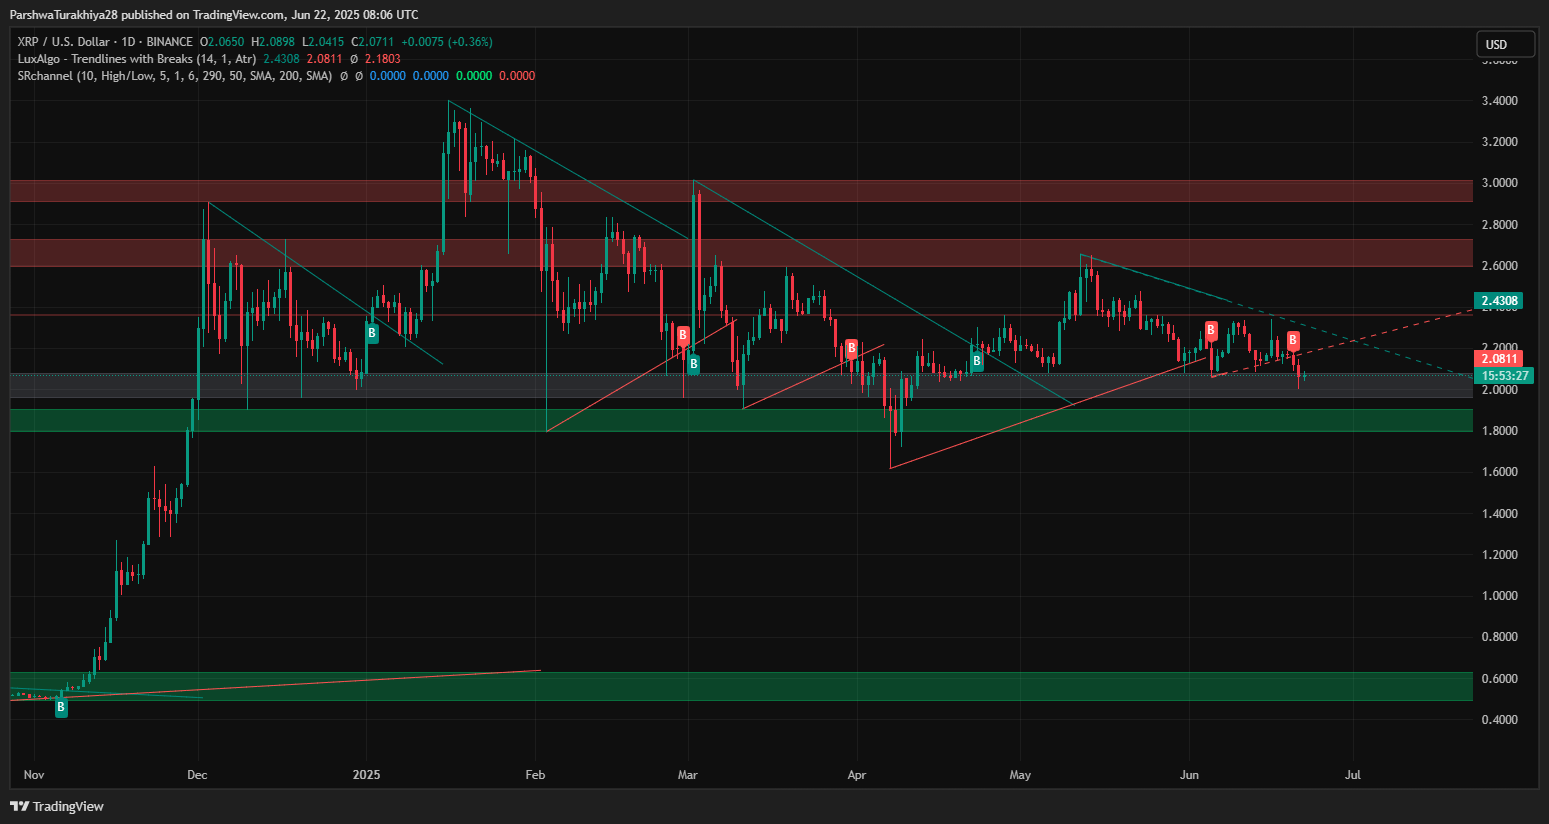
As of June 23, 2025, the XRP price is consolidating near $2.07, stuck between key intraday resistance at $2.081 and support at $2.065 as indicated by the anchored VWAP bands. The daily candle structure has printed minor upper wicks, reflecting rejection from the midline zone and resistance at the 20-day EMA, currently hovering near $2.117.
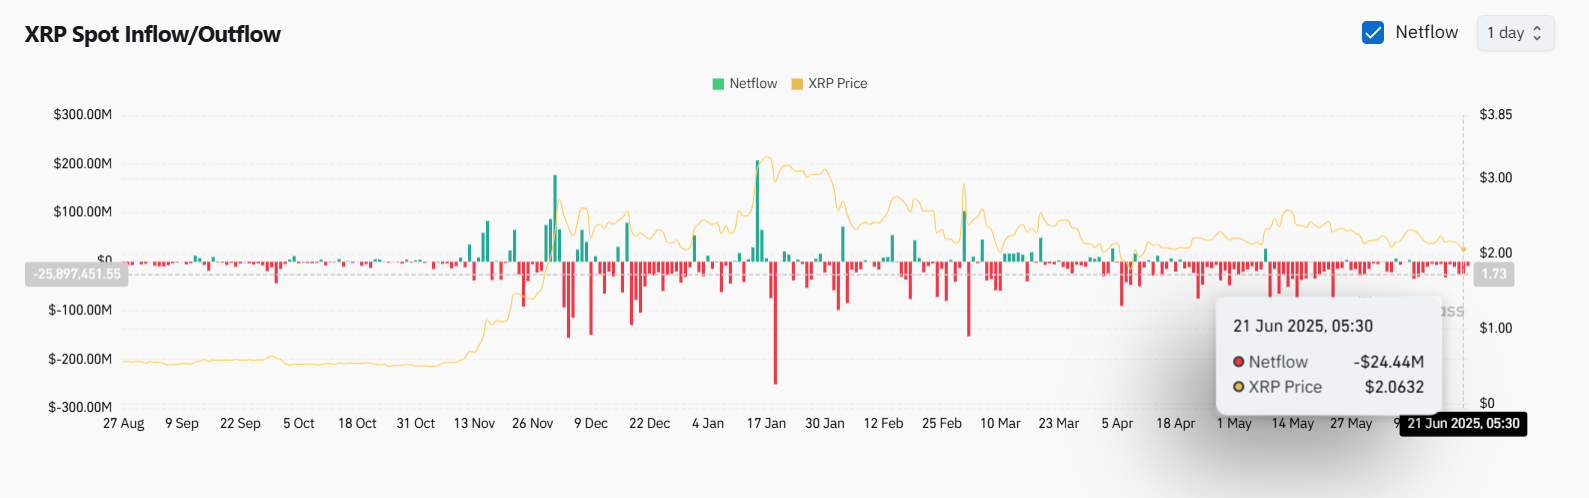
On-chain flows reinforce this weakness. As per June 21 data, XRP saw –$24.44M in net outflows, the largest since May 14, marking a fresh wave of exchange exits. Historically, such deep red netflows have signaled either pre-dump redistribution or position rotation, neither of which suggests strong near-term upside.
VWAP Compression and SAR Flip Signal Market Caution
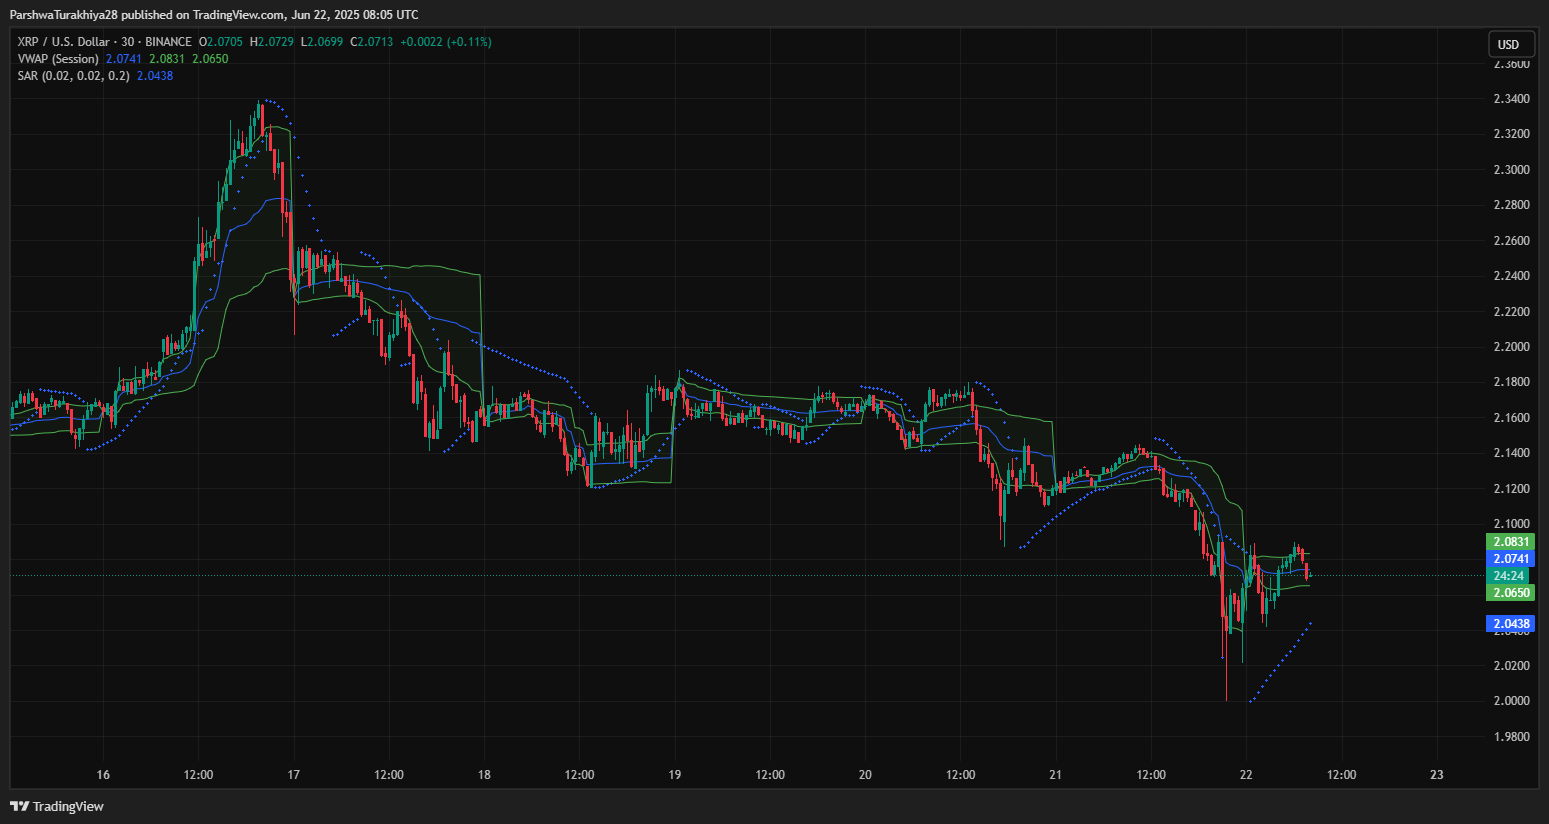
On the 1-hour and 4-hour charts, the VWAP setup shows session anchoring at:
- VWAP High: $2.083
- VWAP Mid: $2.074
- VWAP Low: $2.065
Price is oscillating tightly between these bounds, respecting the VWAP low for now. A clean close above $2.083 could signal short-term breakout potential, but failure to hold $2.065 may expose the price to a sweep toward the recent SAR dot at $2.0438, which flipped bullish on the last 4-hour candle.
The Parabolic SAR print confirms a shift in intraday momentum. While the reversal has occurred at higher lows, confirmation from RSI and MACD is still lacking, keeping buyers cautious.
MACD and RSI Show Indecision As Range Tightens
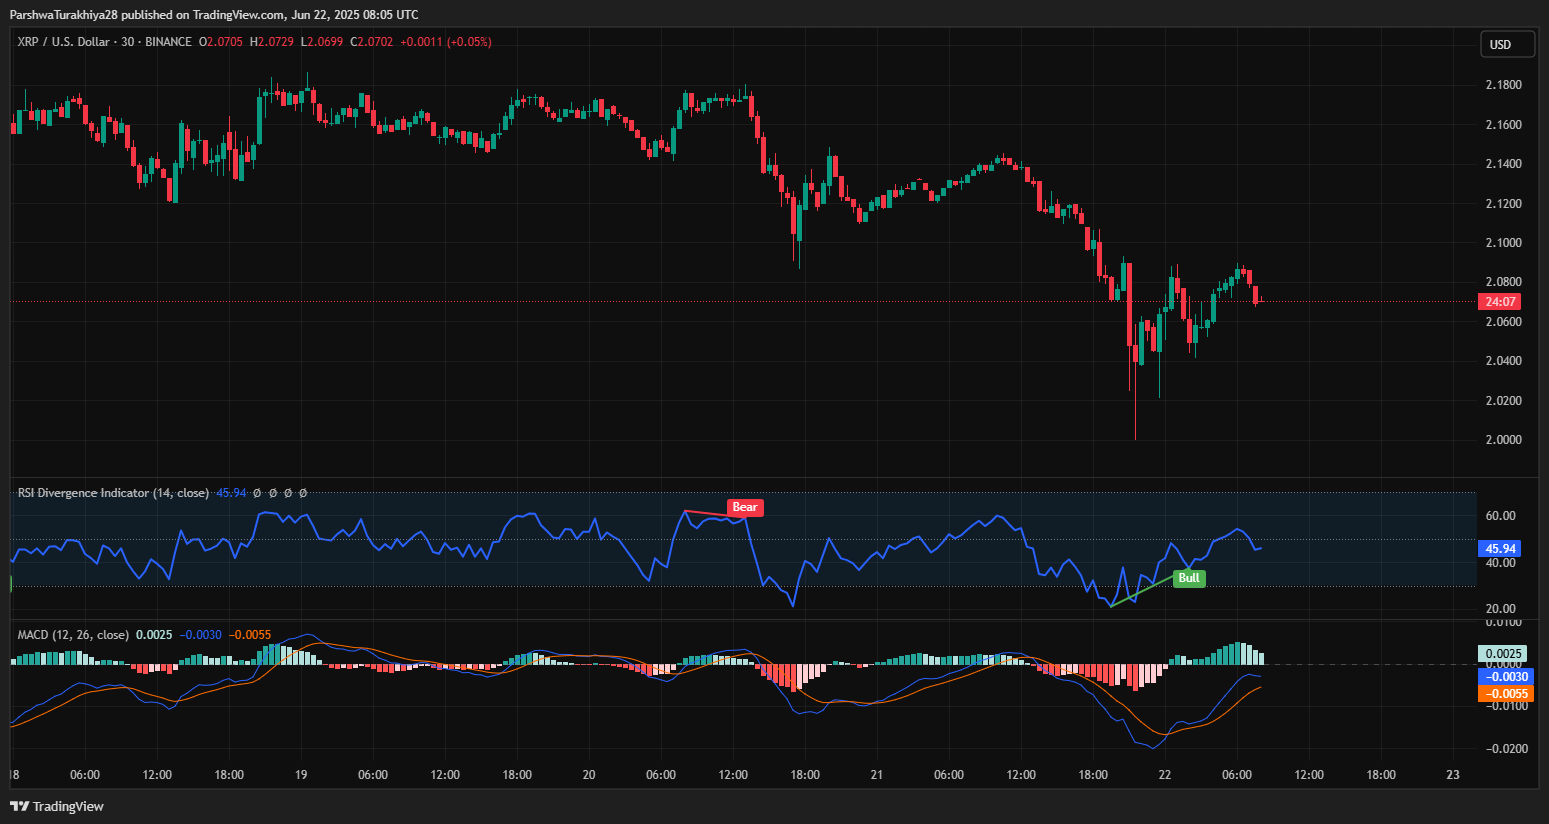
Momentum indicators remain mixed. The RSI (14) on the 4-hour is hovering at 45.94, showing no clear divergence but indicating a slight loss of upward momentum from the weekend session. It remains neutral but lacks confirmation of bullish strength.
The MACD histogram has narrowed slightly, printing around -0.0055, with the MACD line at 0.0025 and the signal line at -0.0030. This suggests waning bearish pressure, but not enough for a definitive shift. A bullish crossover near the zero-line would be key to watch heading into Tuesday’s session.
EMA Cluster and Bollinger Bands Suggest a Compression Setup

XRP is trading below its 20 and 50 EMAs, currently at:
- 20 EMA: $2.117
- 50 EMA: $2.153
- 100 EMA: $2.482
- 200 EMA: $2.290
The price remains pinned between the 20 EMA and lower Bollinger Band, with the current basis line near $2.1268 and lower band support at $2.0510. This zone is forming a narrowing volatility channel — a potential precursor to a directional breakout.
The squeeze in Bollinger range combined with light volume suggests a volatility pop may emerge in the next 24–48 hours, particularly as the options expiry approaches.
Supertrend and DMI Confirm Bearish Momentum Shift
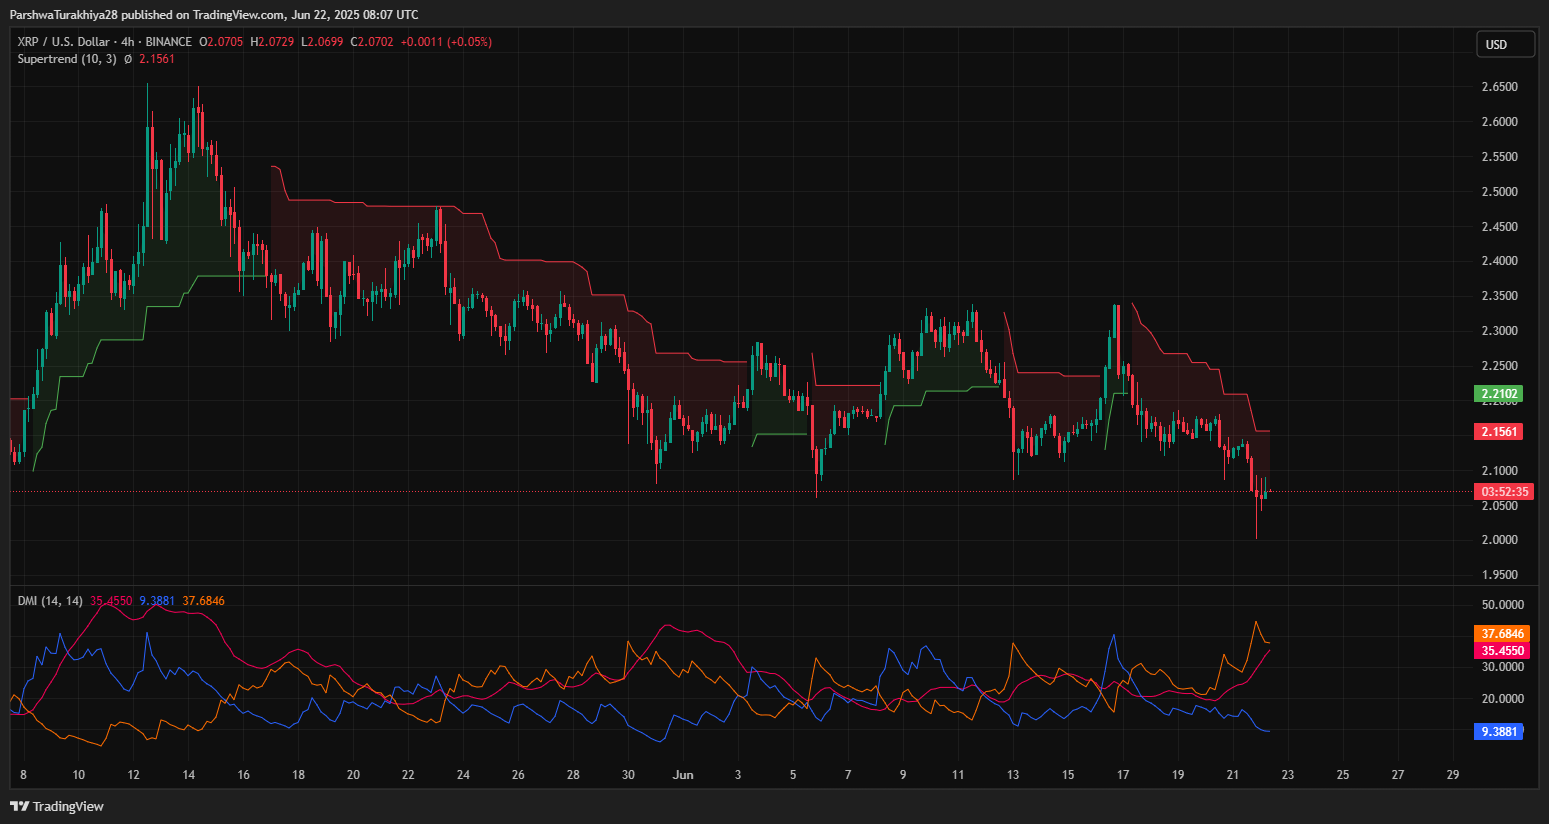
On the 4-hour chart, XRP has flipped decisively below the Supertrend resistance line, which now sits near $2.1561, indicating a short-term bearish setup. This aligns with the earlier rejection zone discussed near $2.16–$2.18.
The Directional Movement Index (DMI) adds weight to the bearish pressure. The -DI (orange) has surged to 37.68, well above the +DI (blue) at 9.38, confirming dominant selling momentum. The ADX (pink) at 35.45 suggests this trend is strong and expanding.
Options Flow and OI Confirm the $2.00–$2.20 Warzone
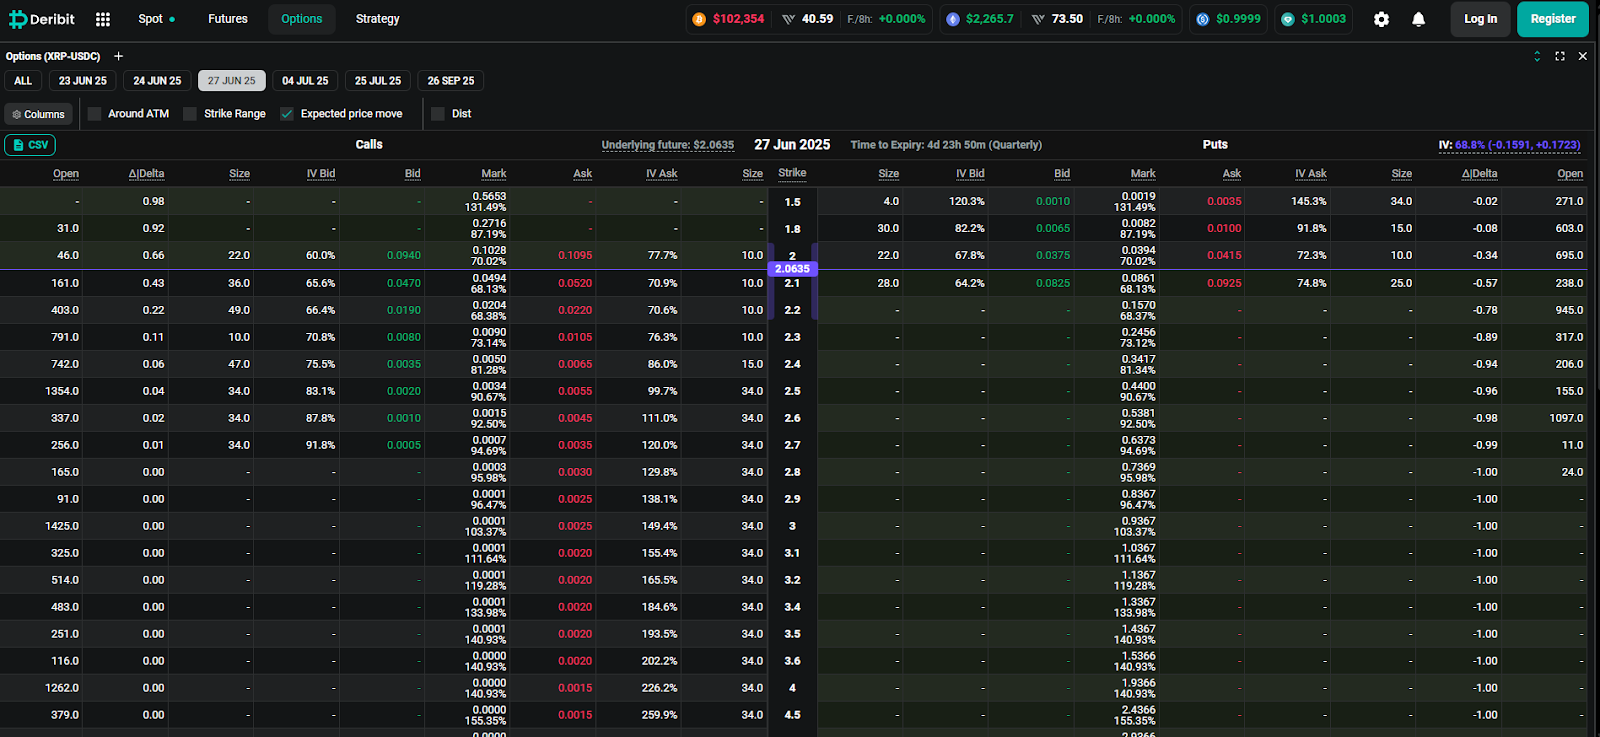
With June 27 expiry just days away, open interest data from Deribit reveals a concentration of calls between $2.10–$2.25, with peak size at $2.10 (28 contracts) and $2.20. Bears, however, are protecting $2.00 and below, with aggressive put skew and large delta negative OI.
The highest implied volatility is priced into strikes beyond $2.30, reflecting market expectation that if XRP breaks above $2.22, a quick expansion could follow. Until then, XRP price volatility is more likely to stay trapped within the $2.00–$2.20 band.
Short-Term Outlook and Forecast

A clean break above $2.083–2.117 opens the door toward the EMA cluster at $2.15 and then possibly toward $2.20, aligning with options gamma squeeze territory. Conversely, losing the VWAP low at $2.065 could send XRP back to $2.043 or even toward the Bollinger lower band at $2.051.
Technical Forecast Table: XRP Levels to Watch
| Indicator | Value / Signal |
| XRP price today | $2.07 |
| VWAP Range | $2.065 – $2.083 |
| Parabolic SAR | $2.0438 (bullish flip) |
| RSI (14) | 45.94 (neutral) |
| MACD Histogram | -0.0055 (flattening) |
| Bollinger Band Support | $2.0510 |
| Bollinger Band Basis | $2.1268 |
| 20 EMA (4h) | $2.117 |
| Options Expiry Bias | Bullish bias above $2.10 |
| Netflow (last 24h) | -$24.44M |
Disclaimer: The information presented in this article is for informational and educational purposes only. The article does not constitute financial advice or advice of any kind. Coin Edition is not responsible for any losses incurred as a result of the utilization of content, products, or services mentioned. Readers are advised to exercise caution before taking any action related to the company.


