
After bouncing sharply from the $2.00 region, the XRP price today is hovering around $2.19, staging a recovery just beneath a significant resistance cluster. While price remains inside a broader consolidation zone, short-term indicators are flashing mixed signals, leaving traders uncertain as to whether momentum favors continuation or correction.
What’s Happening With XRP’s Price?
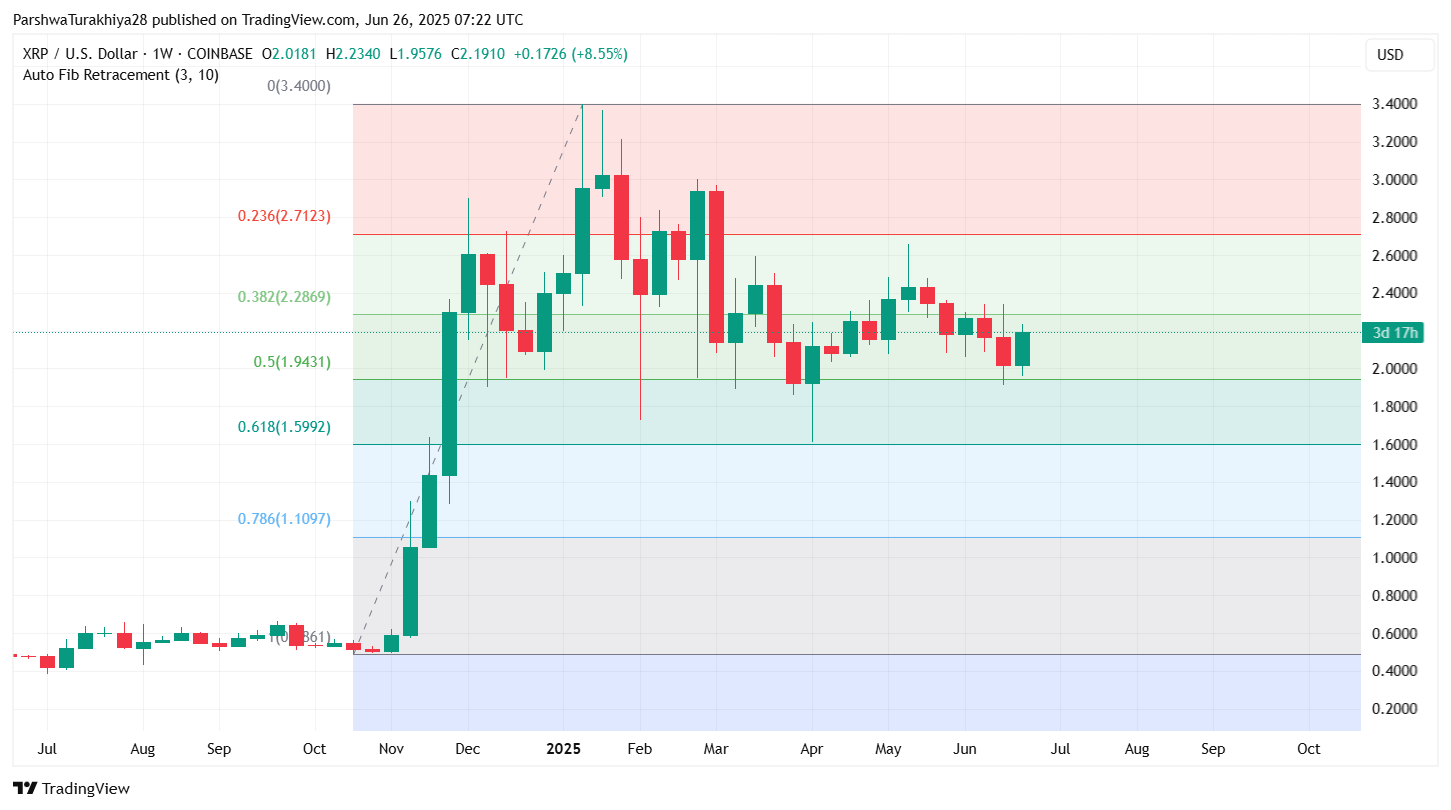
On the weekly chart, XRP price action continues to oscillate between the 0.382 Fibonacci retracement level at $2.2869 and the 0.5 level at $1.9431. After defending the midpoint of this retracement channel for the past three weeks, buyers have managed to push XRP above the $2.15 mark, signaling a modest but notable recovery from local lows.
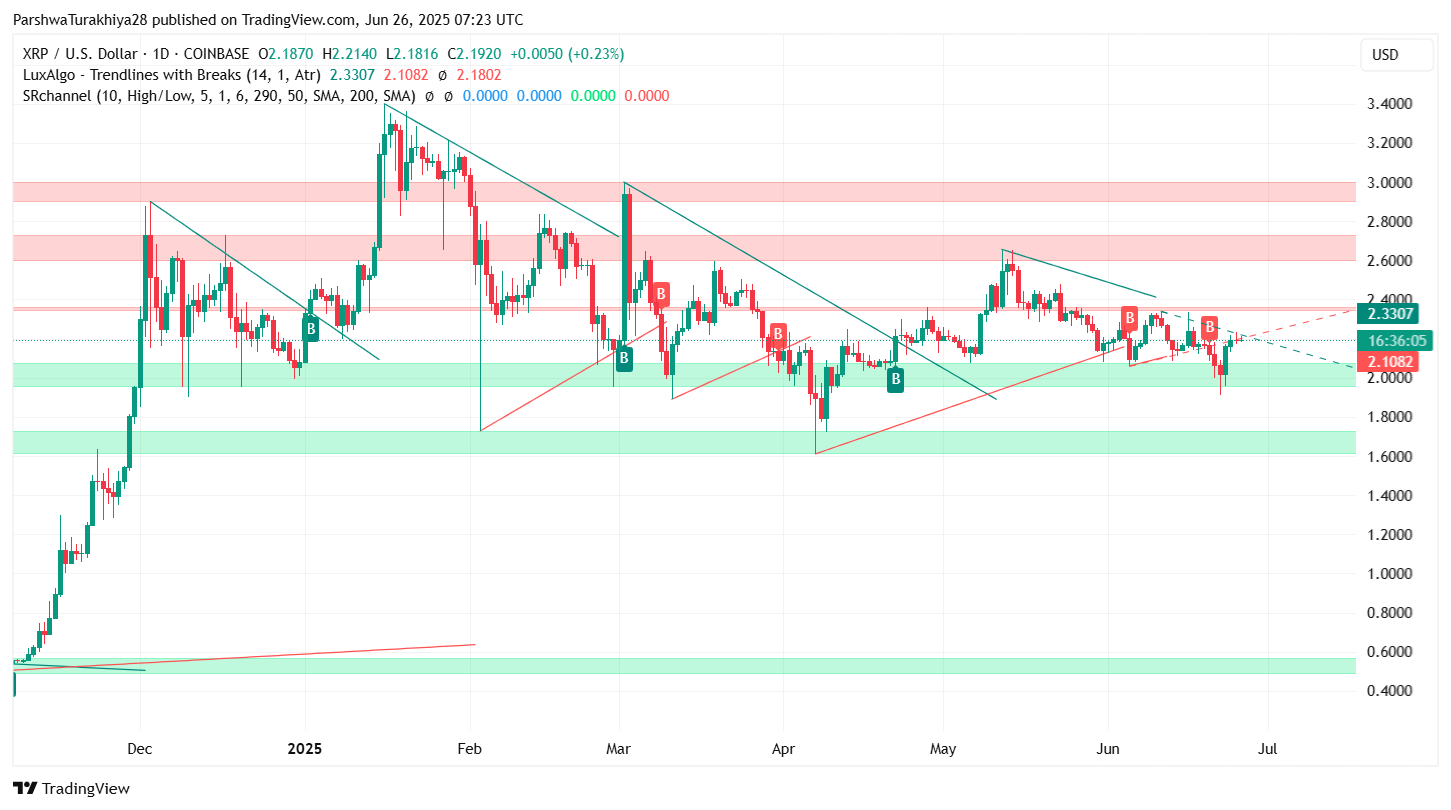
The daily structure shows a narrowing triangle with visible resistance at $2.33 and support at $2.10. Recent candles have formed a tight-bodied range, indicating equilibrium between buyers and sellers near the short-term trendline. A bullish breakout above $2.21 could invalidate the current downtrend setup, opening a move toward $2.30–$2.33.
Why XRP Price Going Up Today?
The reason why XRP price going up today lies in the recent bounce from key liquidity zones between $2.00 and $2.05, where Smart Money Concepts identified strong bullish order blocks. The 4-hour chart reflects a clear change-of-character (CHoCH) above $2.10, flipping local market structure and reviving intraday bullish sentiment.
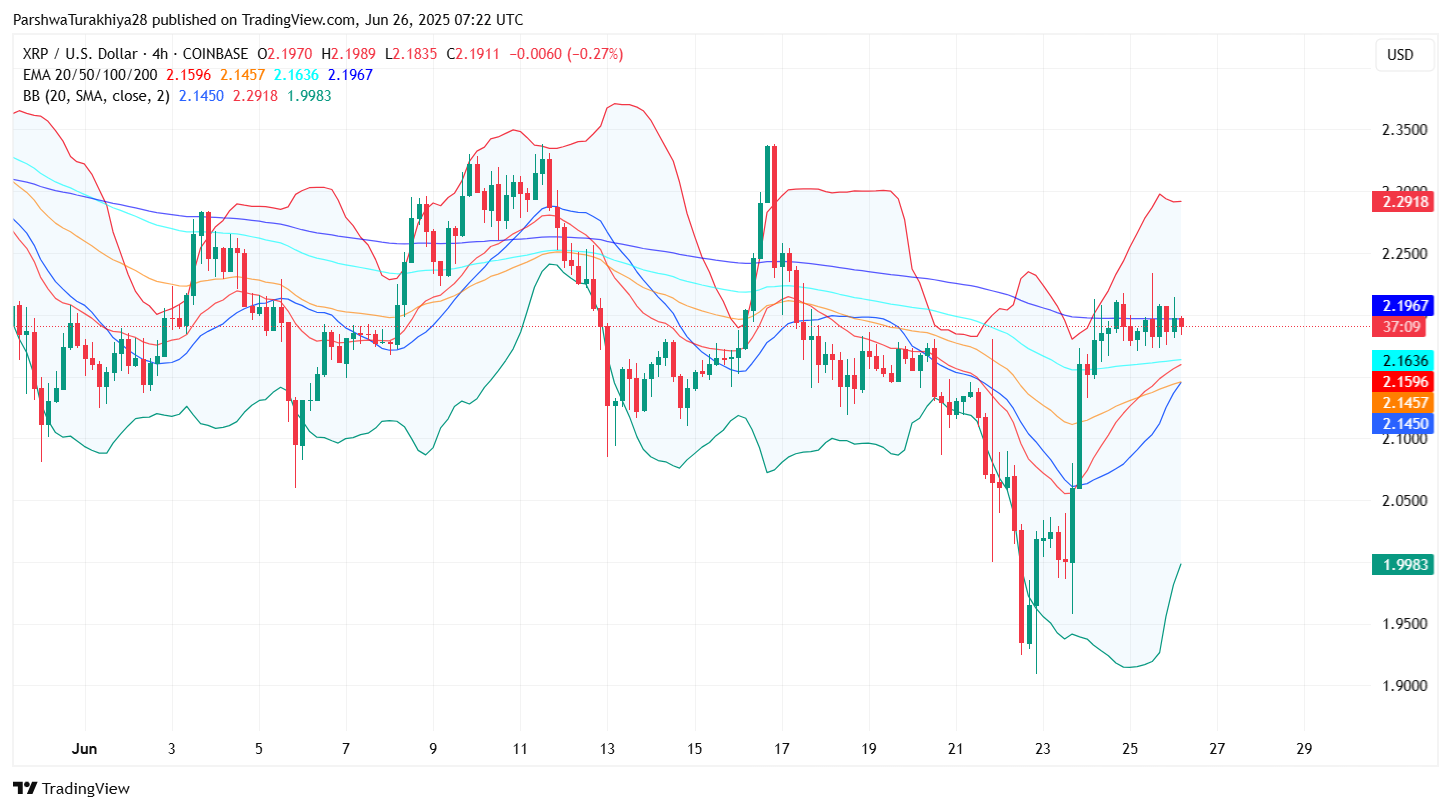
Furthermore, the Bollinger Bands on the 4H timeframe are expanding again after a compression phase, with XRP holding above its 20, 50, and 100 EMAs. This suggests that XRP price volatility may rise as the token builds pressure beneath the $2.21 ceiling.
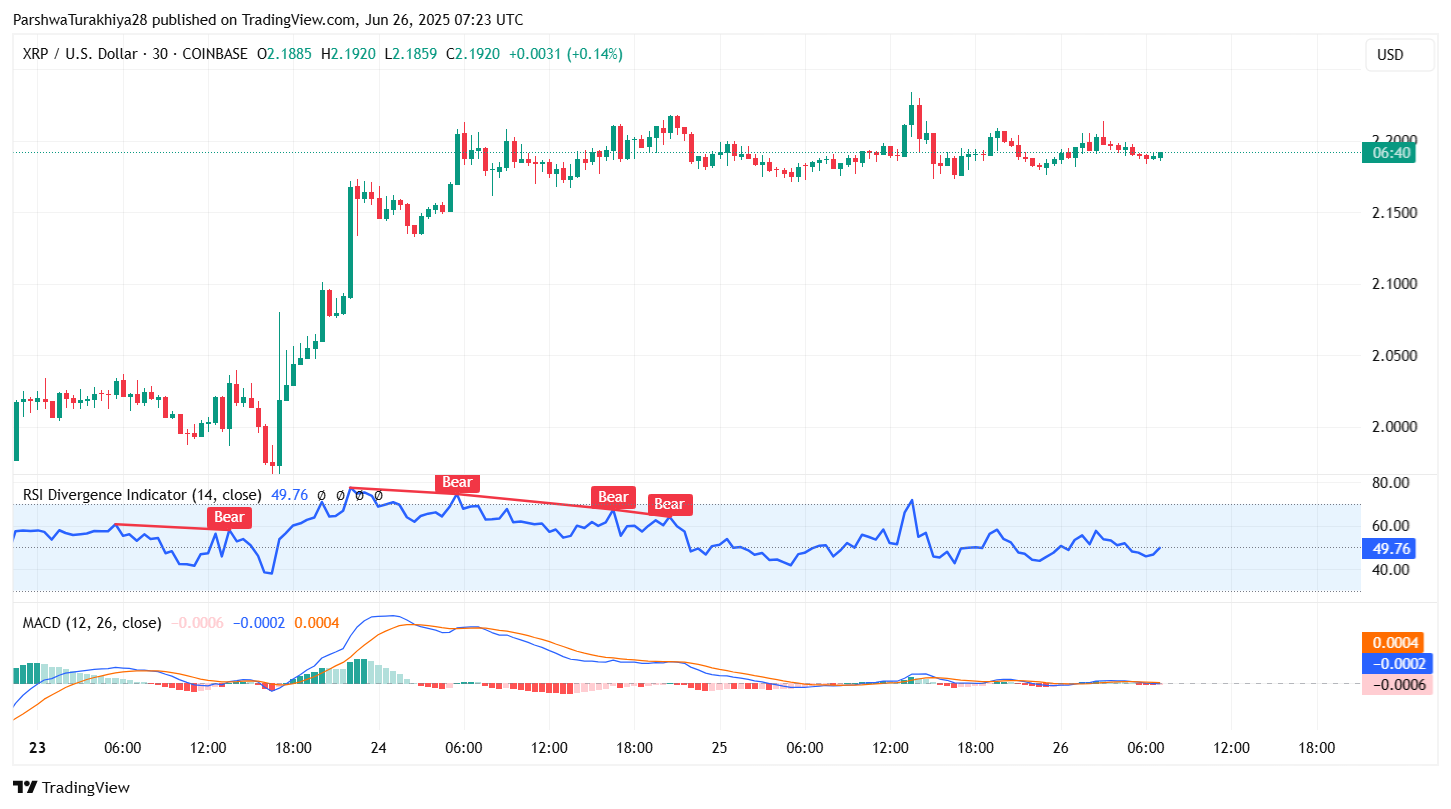
However, a word of caution comes from the 30-minute RSI, which is showing bearish divergence. Despite higher highs in price, the RSI has slipped to 49.76, accompanied by multiple “Bear” signals. The MACD remains flat, with weak histogram prints near the zero line, suggesting a lack of definitive momentum. This divergence could cap near-term upside unless bulls produce volume above $2.21.
XRP Price Structure Shows Squeeze Between Key Liquidity Zones

On the Smart Money Concepts chart, XRP has remained beneath a major “strong high” zone near $2.30, with several equal highs (EQH) formed below this ceiling. This sets up a potential liquidity grab scenario if bulls manage a breakout. Meanwhile, the downside remains protected by a “weak low” liquidity pool near $1.90–$2.00, which has already seen heavy absorption from buyers.
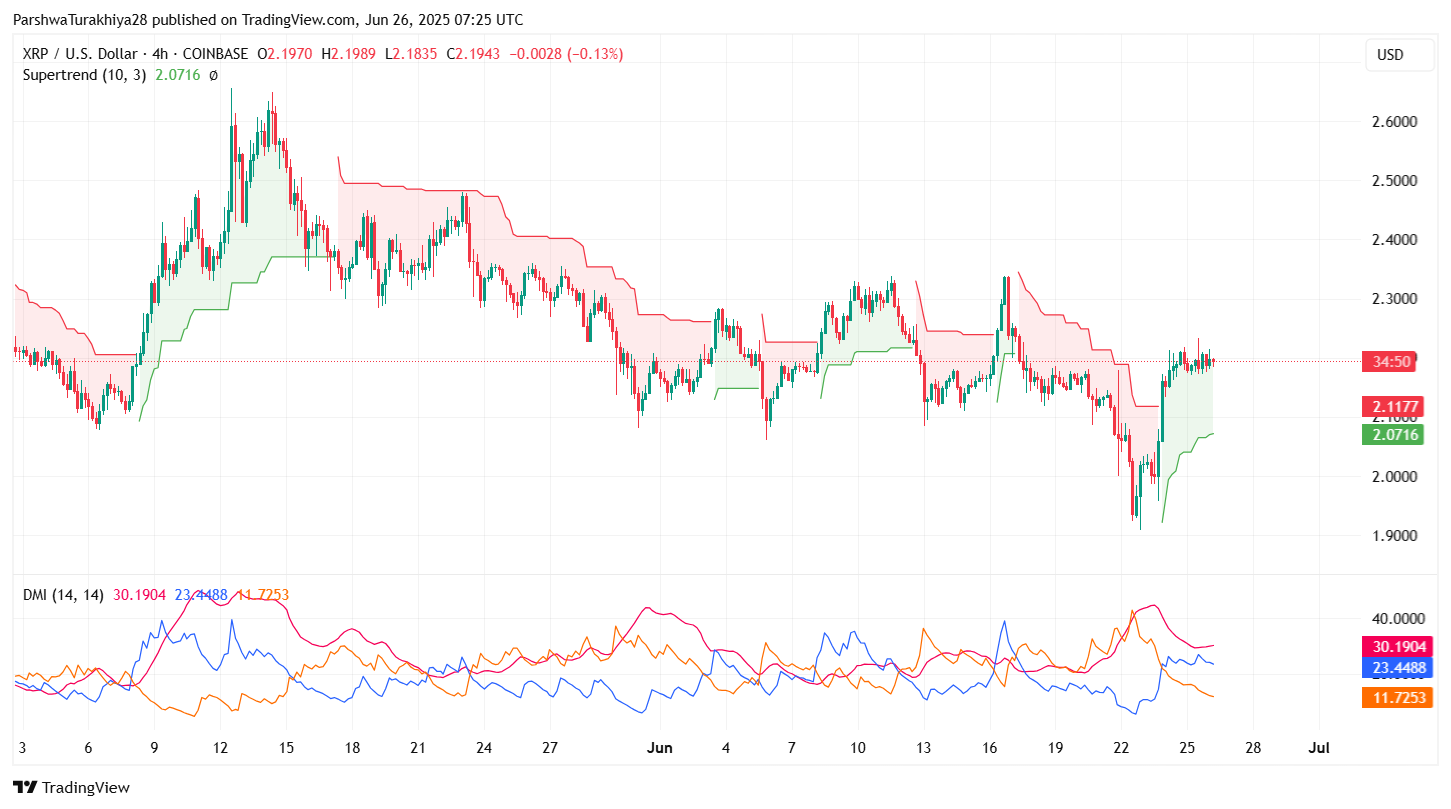
The 4-hour Supertrend indicator has flipped bullish, with the support band now rising from $2.07. However, the Directional Movement Index (DMI) remains neutral, with the +DI and -DI lines converging and ADX weakening—implying low trend strength at the moment. Price is essentially caught in a coil, tightening between overlapping moving averages and volatility bands.
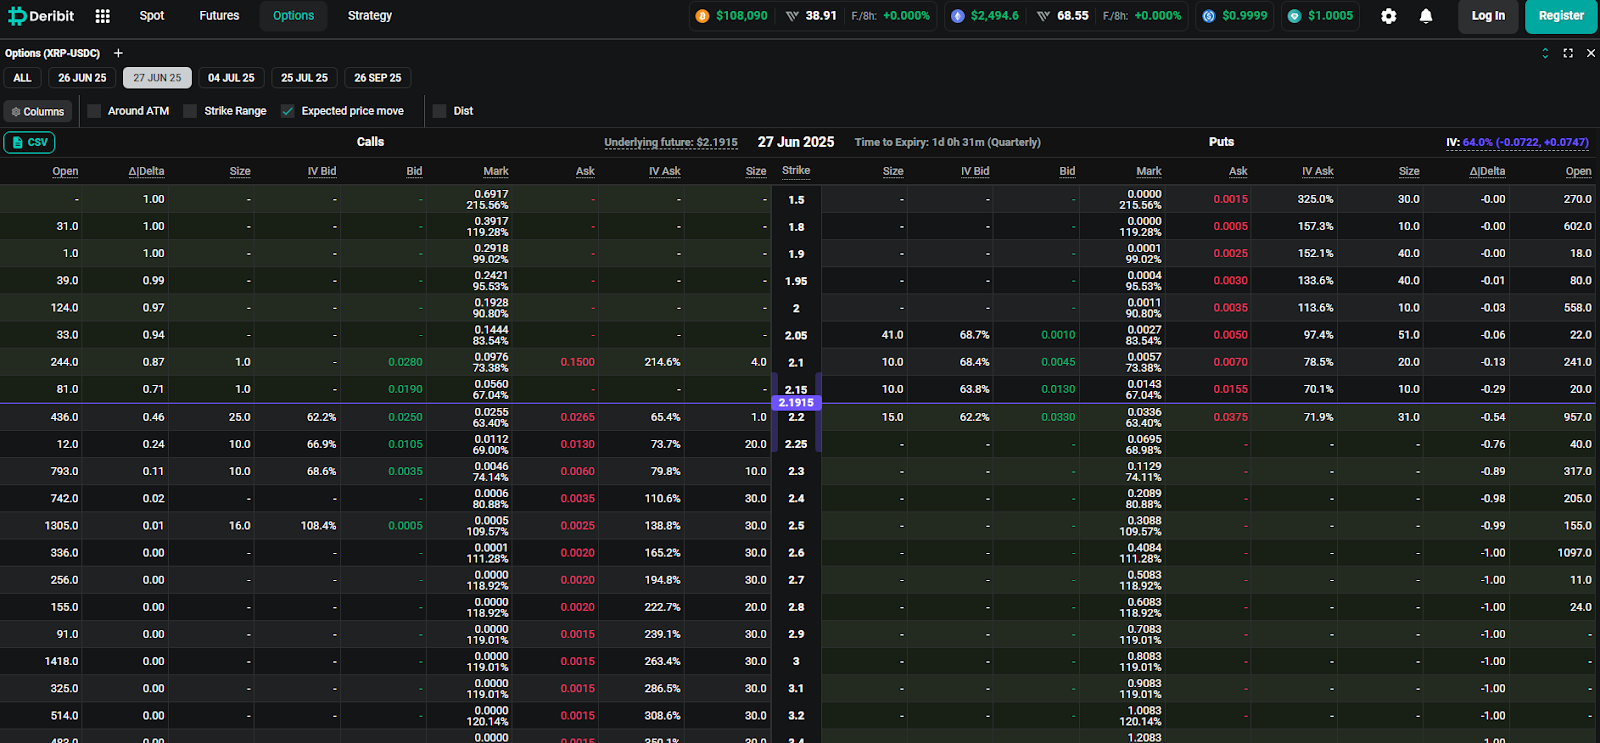
Options data for the June 27 expiry also reveals notable open interest around the $2.20–$2.25 strike range. This implies market participants are watching this zone closely for potential binary movement after expiry.
XRP Price Prediction: Short-Term Outlook (24h)

As of now, XRP is consolidating below resistance at $2.2135, within a symmetrical wedge pattern. A clean breakout above this level, with hourly candles closing above $2.22, could trigger a swift move toward $2.28 and $2.33 — levels that previously hosted heavy sell-side pressure.
On the downside, if XRP breaks below the $2.1450 dynamic support (aligned with the 4H EMA cluster), a retracement back toward $2.08 and potentially $1.9980 becomes likely. This is also in line with the blue demand zone marked on the liquidity chart.
Given that the MACD remains directionless and RSI divergence persists, XRP price spikes in either direction may depend on whether short-term bulls can flip $2.21 into support or lose control of the $2.14–$2.15 region.
XRP Price Forecast Table: June 27, 2025
| Indicator/Zone | Level/Signal | Interpretation |
| Resistance 1 | $2.2135 | Intraday breakout zone |
| Resistance 2 | $2.3300 | Strong high liquidity & rejection zone |
| Support 1 | $2.1450 | EMA cluster zone |
| Support 2 | $2.0000 | Weekly demand & liquidity block |
| RSI (30-min) | 49.76 (Diverging) | Bearish divergence warning |
| MACD (30-min) | Flat near zero | Low momentum |
| Bollinger Bands (4H) | Expanding | Volatility increase likely |
| Supertrend (4H) | Bullish above $2.07 | Upside bias if support holds |
| SMC Liquidity Zones | $2.00–$2.05 (support), $2.30–$2.33 (resistance) | Compression between extremes |
| Options OI (27 June) | $2.20–$2.25 | Key magnet zone for expiry |
The XRP price update for June 27 suggests a balanced tug-of-war near $2.19. While higher time frame support holds, intraday resistance remains stubborn at $2.21. A decisive breakout above this level could invite a push toward $2.30–$2.33. But unless the bearish RSI divergence is resolved, the XRP price today may remain vulnerable to rejection and volatility swings ahead of options expiry.
Disclaimer: The information presented in this article is for informational and educational purposes only. The article does not constitute financial advice or advice of any kind. Coin Edition is not responsible for any losses incurred as a result of the utilization of content, products, or services mentioned. Readers are advised to exercise caution before taking any action related to the company.

 Price Prediction: Can Bulls Reclaim the 0.236 Level?")

 Price Prediction: Can Bulls Break the $329 Barrier?")
