
After a recovery rally from sub-$2.00 levels earlier this week, XRP price today is hovering around $2.18, showing signs of hesitation near a major resistance zone. Despite breaking back above the $2.10 psychological level, XRP now faces a convergence of key indicators that could determine whether upside continuation or a reversal plays out on June 30.
What’s Happening With XRP’s Price?
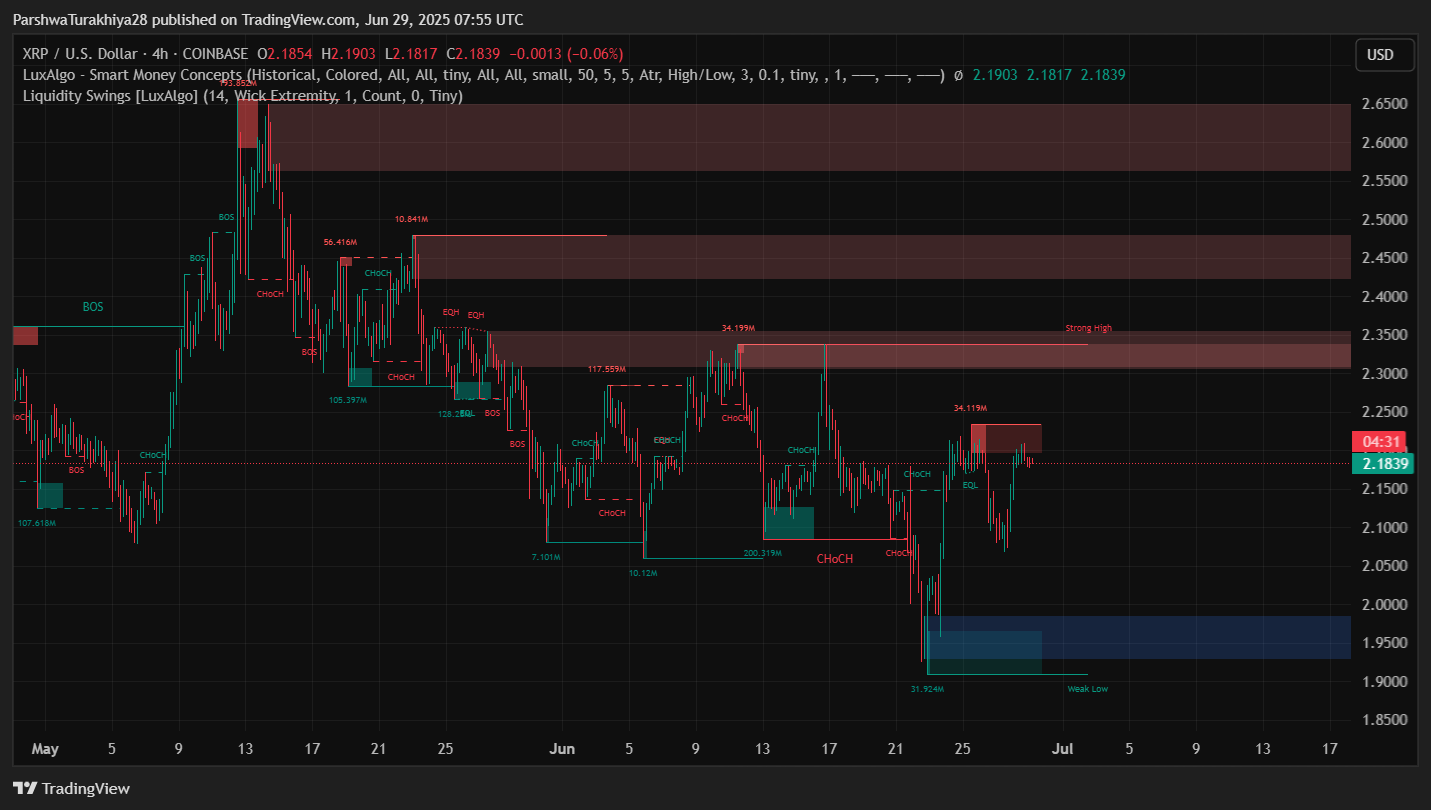
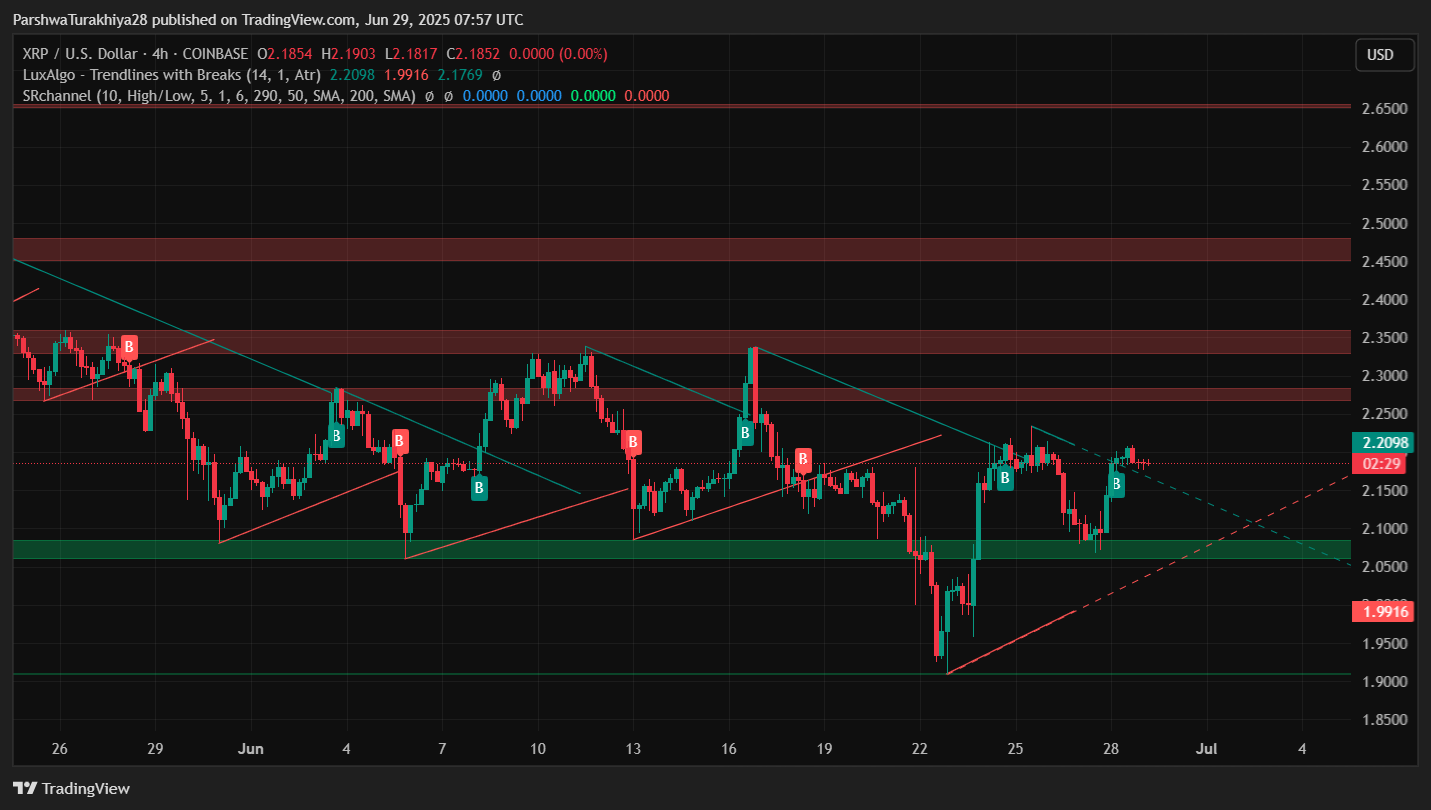
XRP has rebounded into a multi-layered resistance cluster between $2.18 and $2.25, marked by supply zones from Smart Money Concepts, previous CHoCH levels, and multiple failed breakouts. The 4-hour chart reveals price attempting to reclaim the descending channel resistance, but rejection from the $2.21–$2.23 zone remains a key barrier.
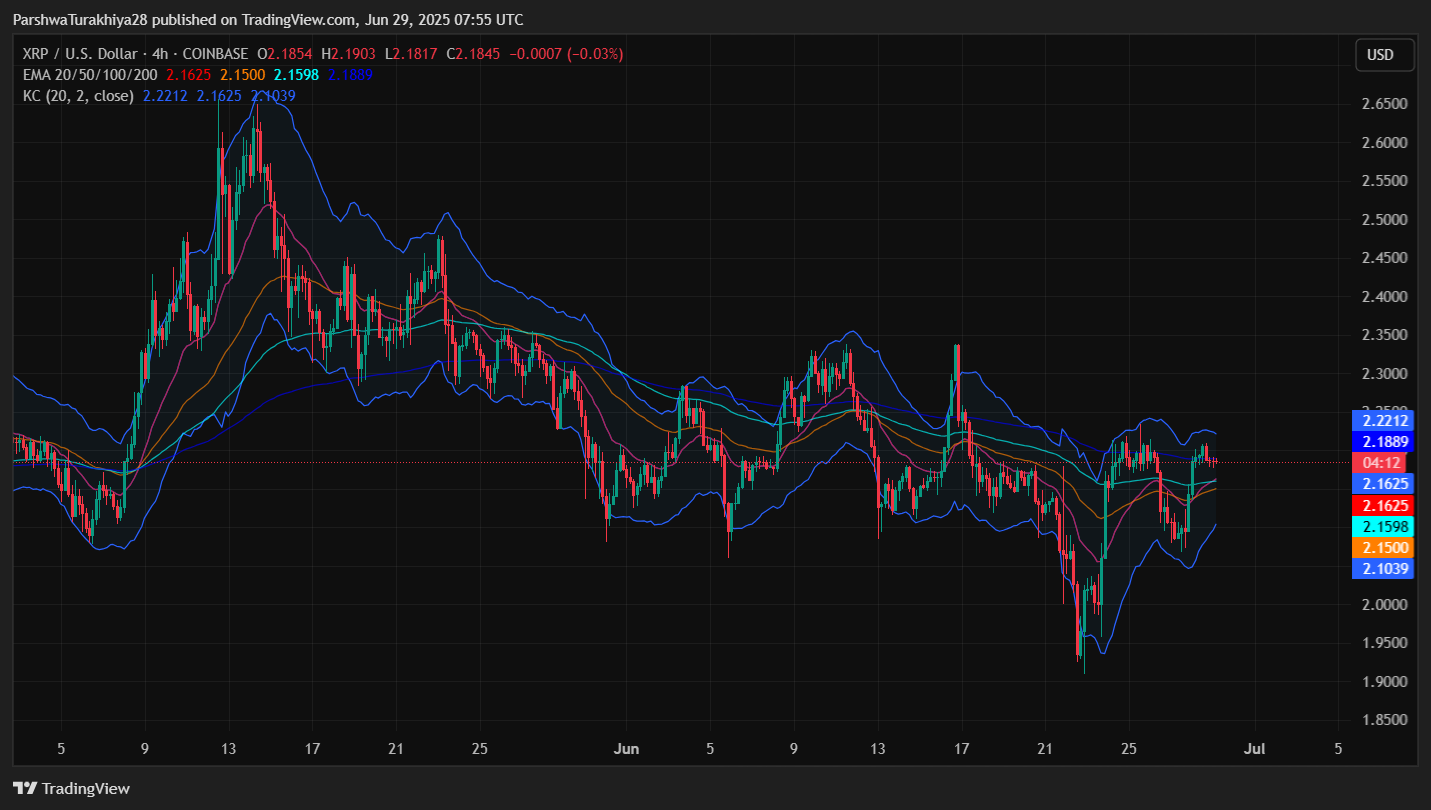
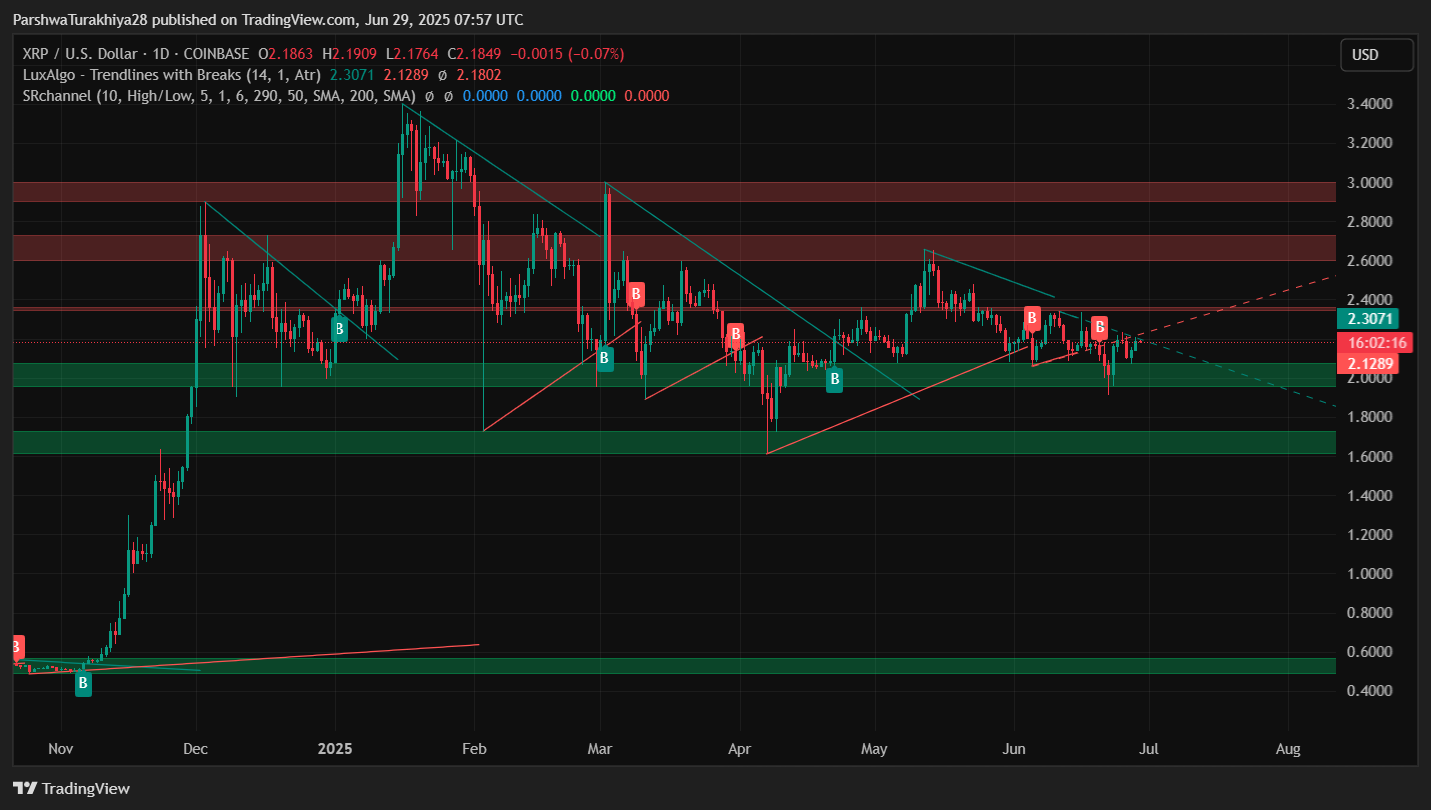
Price is currently trading above the 20, 50, and 100 EMA lines (now clustered between $2.15–$2.18), showing short-term bullish structure. However, it remains below the 200 EMA ($2.1889), which aligns closely with Keltner Channel midline resistance. The daily chart shows a descending wedge pattern still active, with XRP struggling to decisively break above the upper trendline near $2.20.
Smart Money data also reflects caution. The most recent CHoCH rejection near $2.23–$2.25 coincides with a historical EQH zone that triggered multiple structural breakdowns in June. Until that ceiling is cleared, upside remains limited.
Why Is the XRP Price Going Down Today?
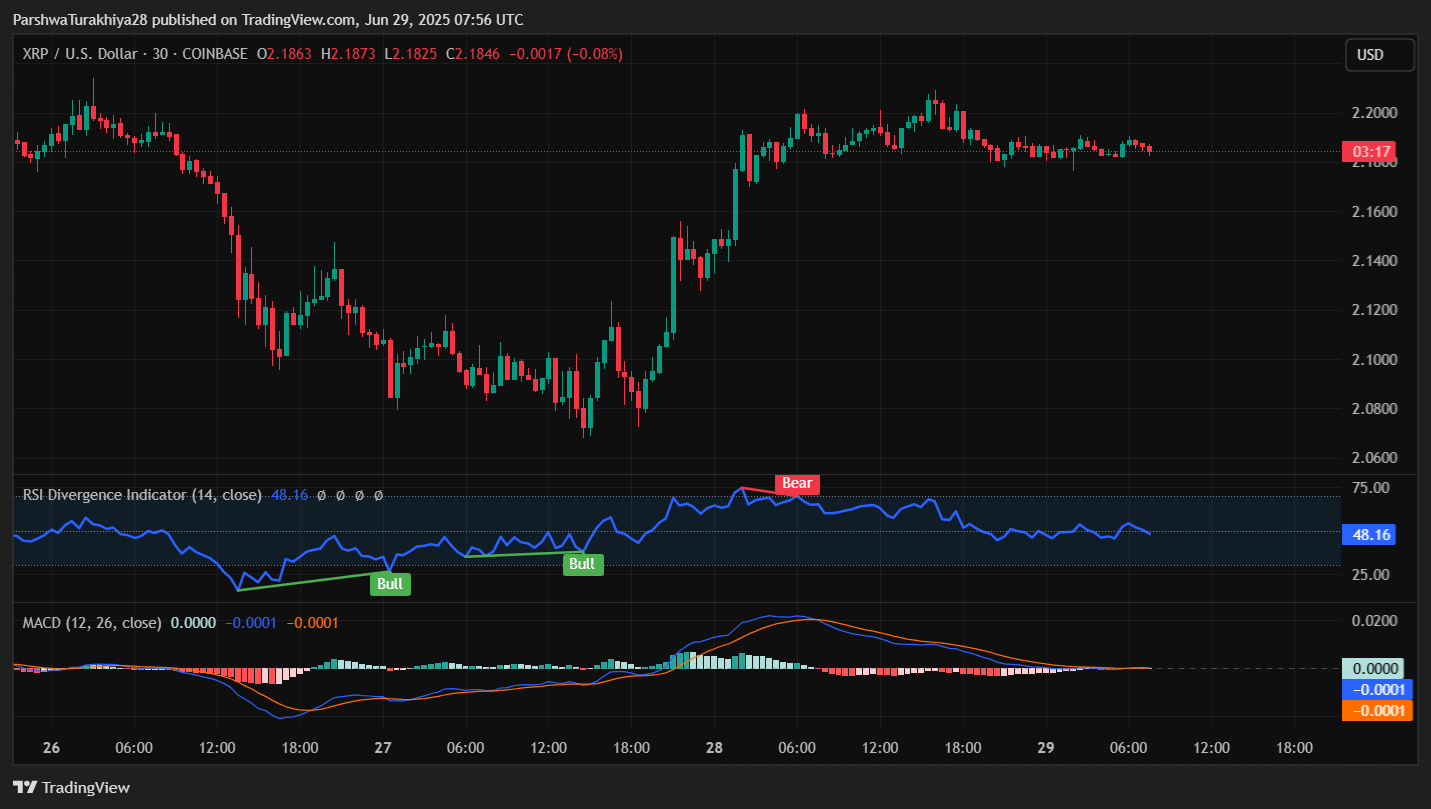
The recent decline from $2.20 is primarily due to momentum exhaustion and overhead pressure from high-volume liquidity zones. The 30-minute chart shows the RSI diverging with price, printing a bearish signal near 48.1. This coincides with a rejection from VWAP resistance at $2.1848, while the MACD histogram has flattened with no bullish crossover confirmation.
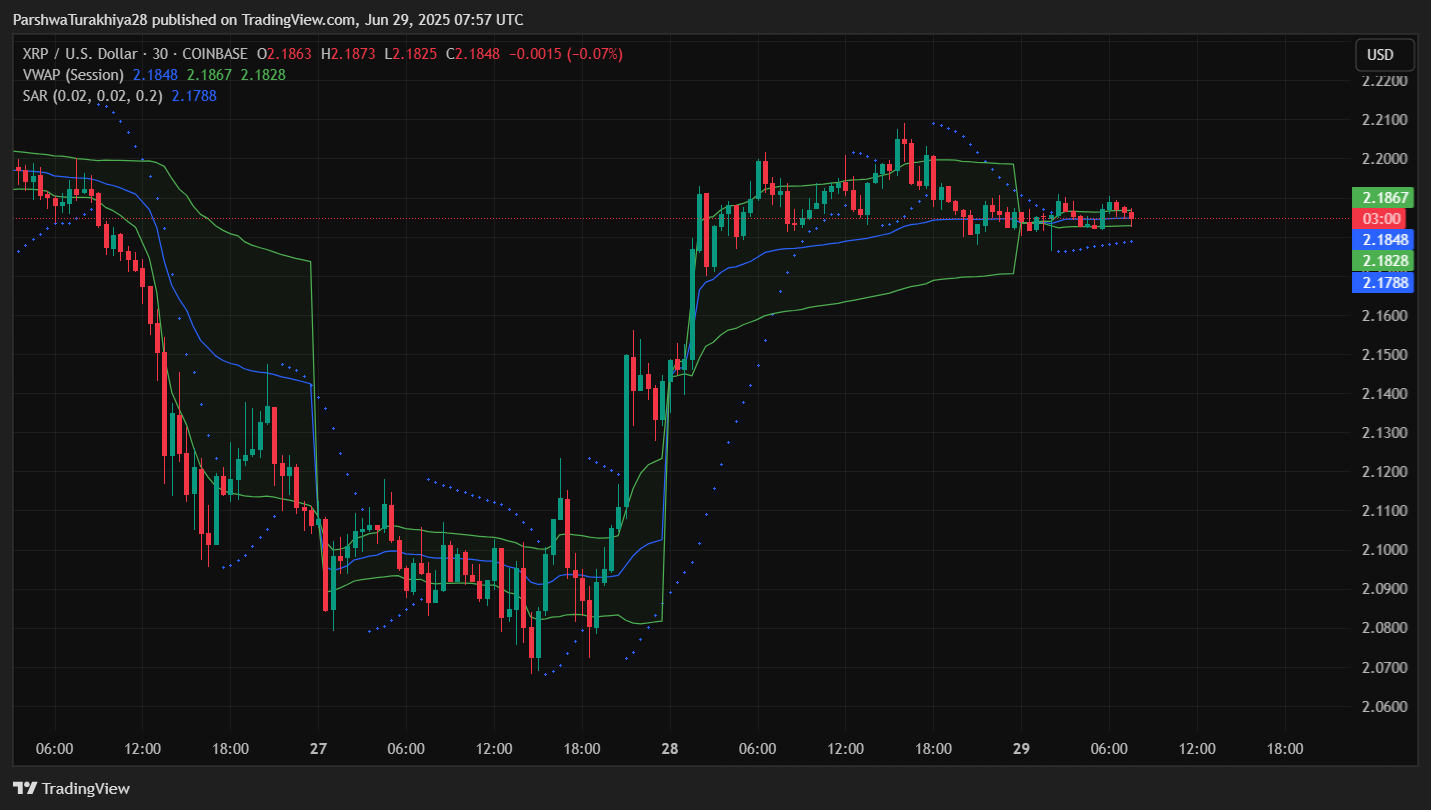
Parabolic SAR dots have flipped above price, further reinforcing a potential intraday downtrend. The 4-hour Supertrend remains bearish below $2.11, and despite short-term attempts to flip bullish, the signal has not yet fully confirmed an uptrend resumption.
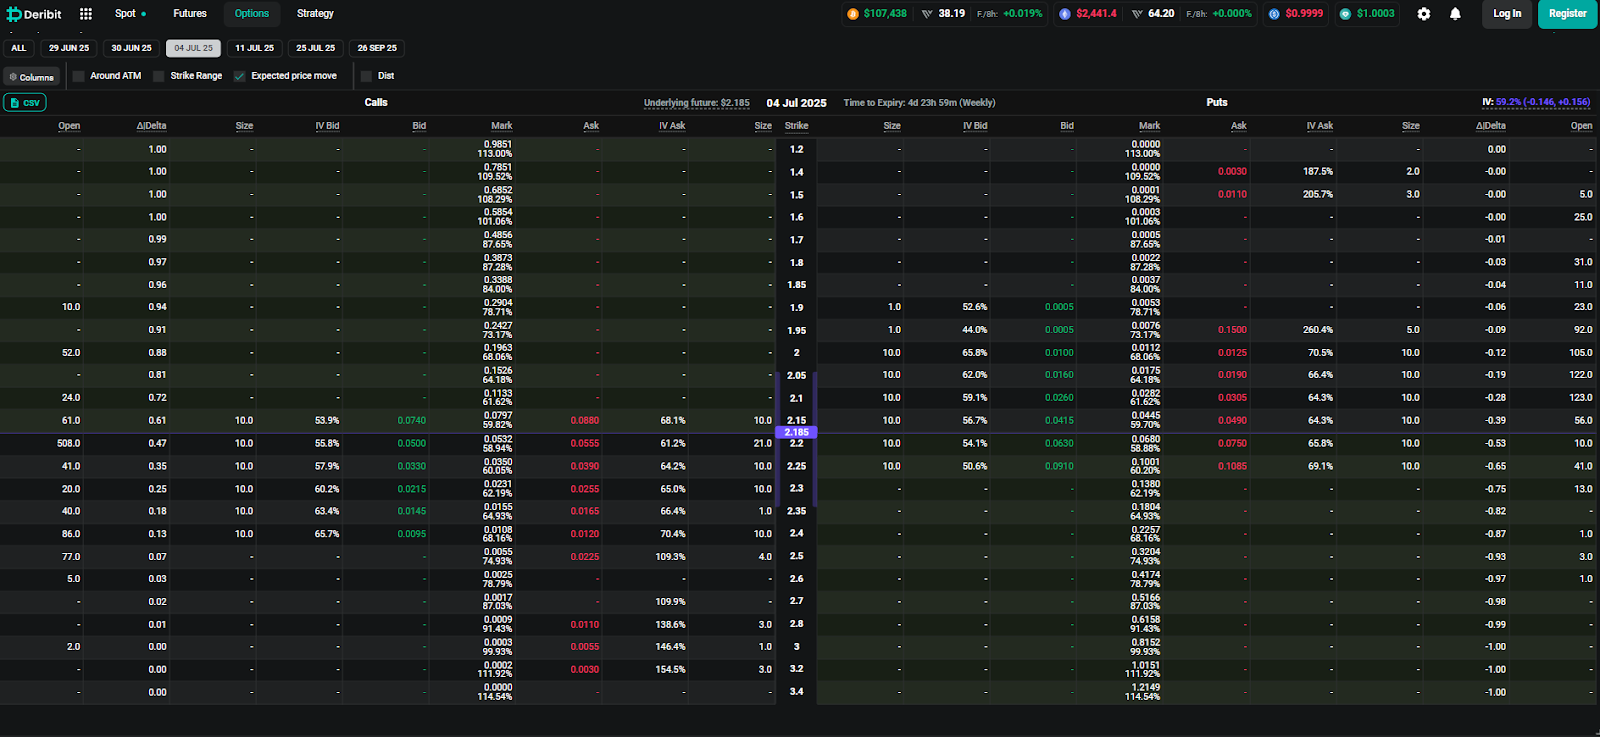
Additionally, option market data from Deribit indicates heavy call interest at the $2.20–$2.25 strikes for the July 4 expiry. Implied volatility remains subdued near 59%, suggesting that traders are pricing in limited upside unless $2.25 is breached with momentum.
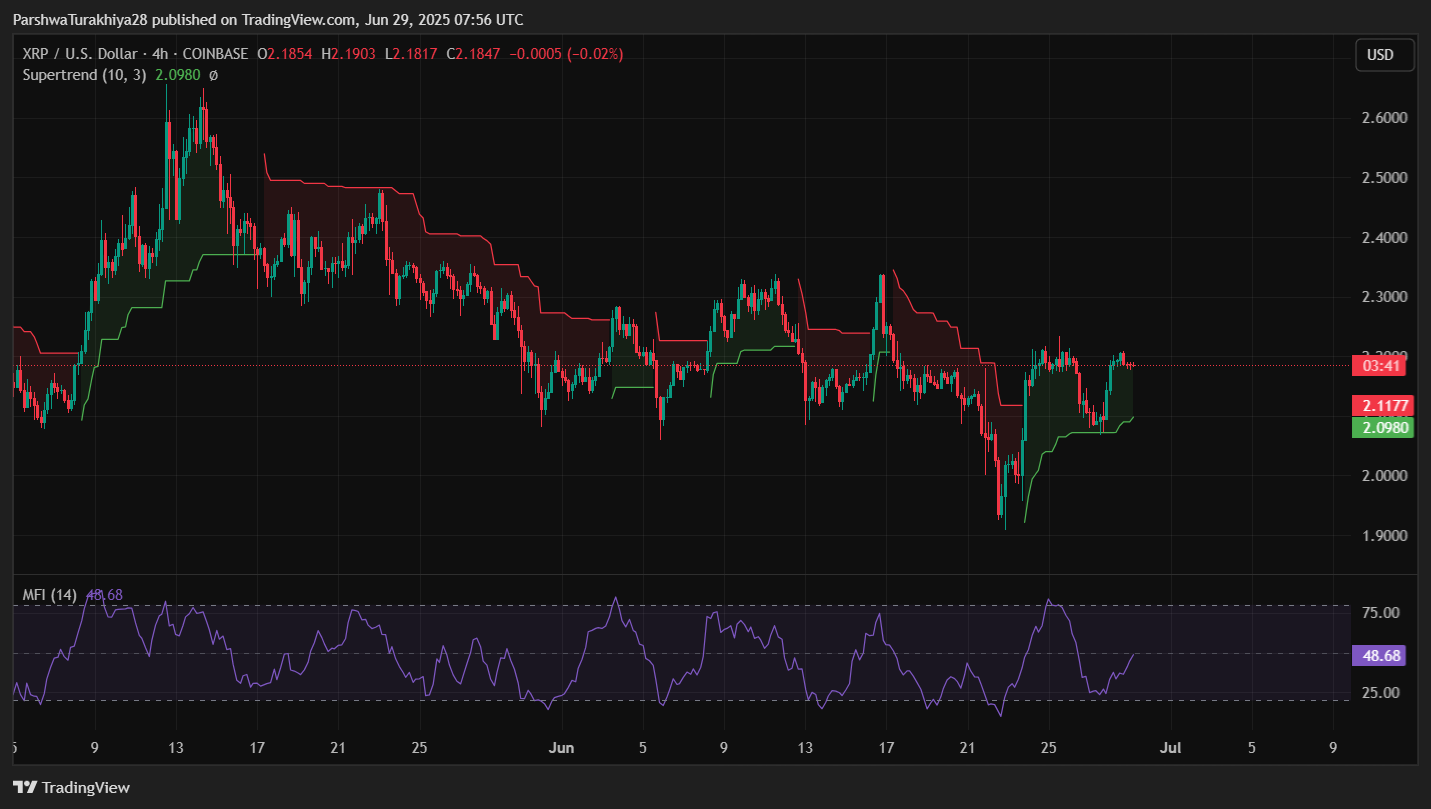
On the order flow side, MFI is hovering at 48.6, showing neutral inflows, while the RSI on higher timeframes remains below 50 — signaling that bulls still lack conviction.
Key Indicators Signal Compression at Resistance
XRP is trading within a narrowing range between $2.15 and $2.21, with Bollinger Bands tightening and Keltner Channels showing reduced volatility. This typically precedes a breakout, but direction remains uncertain.
VWAP, SAR, and 200 EMA are all coiling around the $2.18 zone. This convergence makes $2.18–$2.20 a pivotal level for bulls to reclaim with volume if a breakout toward $2.25–$2.30 is to be achieved.
Failure to do so would open the door for a revisit to the $2.05–$2.00 support band — a liquidity-rich area confirmed by multiple CHoCH and BOS formations on the Smart Money chart.
XRP Price Prediction: Short-Term Outlook (24h)
If XRP price closes above $2.21 with strong volume and RSI pushes back above 50, a rally toward $2.25 and potentially $2.30 becomes likely. This would align with the 1D wedge breakout scenario and confirm a broader bullish reversal.
On the flip side, rejection below $2.18 could drag price toward $2.12 and $2.05, where bullish OB and high-volume support exist. A breakdown below $2.00 would negate the short-term bullish case and reintroduce downside risk toward $1.91.
Given the current convergence of major indicators, the next 24 hours are critical. XRP price volatility is expected to rise as compression reaches its tipping point.
XRP Price Forecast Table: June 30, 2025
| Indicator/Zone | Level (USD) | Signal |
| Resistance 1 | 2.21 | VWAP + upper trendline |
| Resistance 2 | 2.25 | Option wall & EQH zone |
| Support 1 | 2.15 | EMA20/50/100 confluence |
| Support 2 | 2.05 | Smart Money bullish OB zone |
| RSI (30-min) | 48.16 | Bearish divergence |
| MACD (30-min) | Flat | No clear signal |
| VWAP | 2.1848 | Immediate resistance |
| Parabolic SAR | 2.1788 (above) | Bearish intraday |
| Supertrend (4H) | Bearish under 2.11 | Yet to flip bullish |
| Option Strike Wall | 2.25 | Implied cap |
| MFI (4H) | 48.68 | Neutral capital flow |
Disclaimer: The information presented in this article is for informational and educational purposes only. The article does not constitute financial advice or advice of any kind. Coin Edition is not responsible for any losses incurred as a result of the utilization of content, products, or services mentioned. Readers are advised to exercise caution before taking any action related to the company.

 Price Prediction: MemeCore Surges 39% as Momentum Builds Toward $3")


