
XRP price today is trading near $2.73, clinging to support after a week of consistent selling pressure. The token has been sliding along a descending resistance line since mid-August, with repeated failures near $2.95–$3.00 keeping upside momentum capped.
The latest wave of selling coincides with negative flows across exchanges. Coinglass data shows $22.6 million in net outflows on September 1, highlighting continued pressure on liquidity. At the same time, weekly analysts warn that $2.66 and $2.55 represent the next critical support tiers, making this week decisive for bulls attempting to stabilize the market.
XRP Struggles Against Descending Resistance
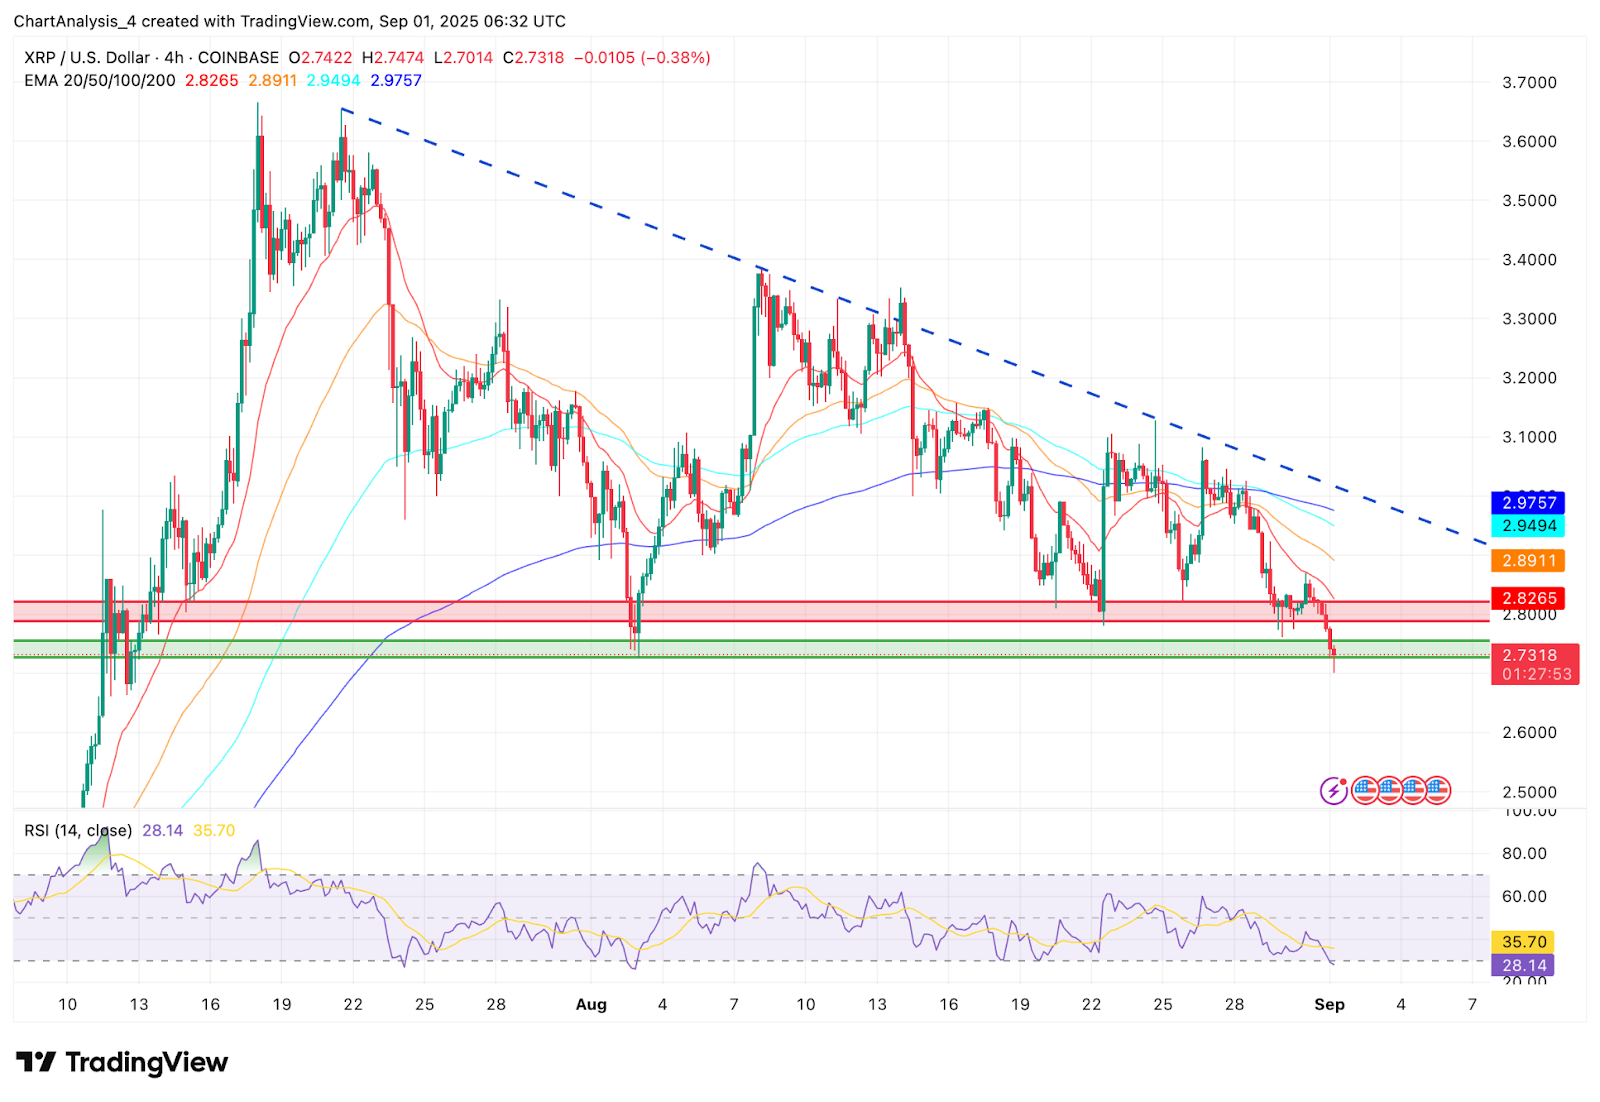
On the 4-hour chart, XRP price action shows a clear descending trendline from early August, with the 20-EMA and 50-EMA reinforcing resistance at $2.82 and $2.89. The 100- and 200-EMA sit higher at $2.94 and $2.97, forming a dense ceiling that buyers must break to reclaim momentum.
Immediate support rests near $2.70–$2.73, but if this floor weakens, downside targets emerge at $2.66 and $2.55. The RSI has slipped to 28, marking oversold territory but also reflecting persistent weakness. Unless price reclaims $2.85 with volume, XRP risks extending its correction in the near term.
Related: Bitcoin (BTC) Price Prediction: Breakout or Breakdown Next?
Weekly Macro Levels Define Bull Market Support
EGRAG Crypto highlights a broader structure on the weekly chart, where the Bull Market Support Band defines the key levels. According to the analysis, Tier 1 support sits at $2.66, while Tier 2 support holds at $2.55. A break below $2.30 would signal the conclusion of the current impulsive move and pave the way for further losses.
Despite near-term caution, EGRAG also reminds followers that this correction remains within macro structures. Unless $2.30 is lost, the bullish thesis remains intact, with $27 flagged as a potential longer-term target if major resistance breaks are confirmed.
Netflows and Supertrend Point to Bearish Pressure
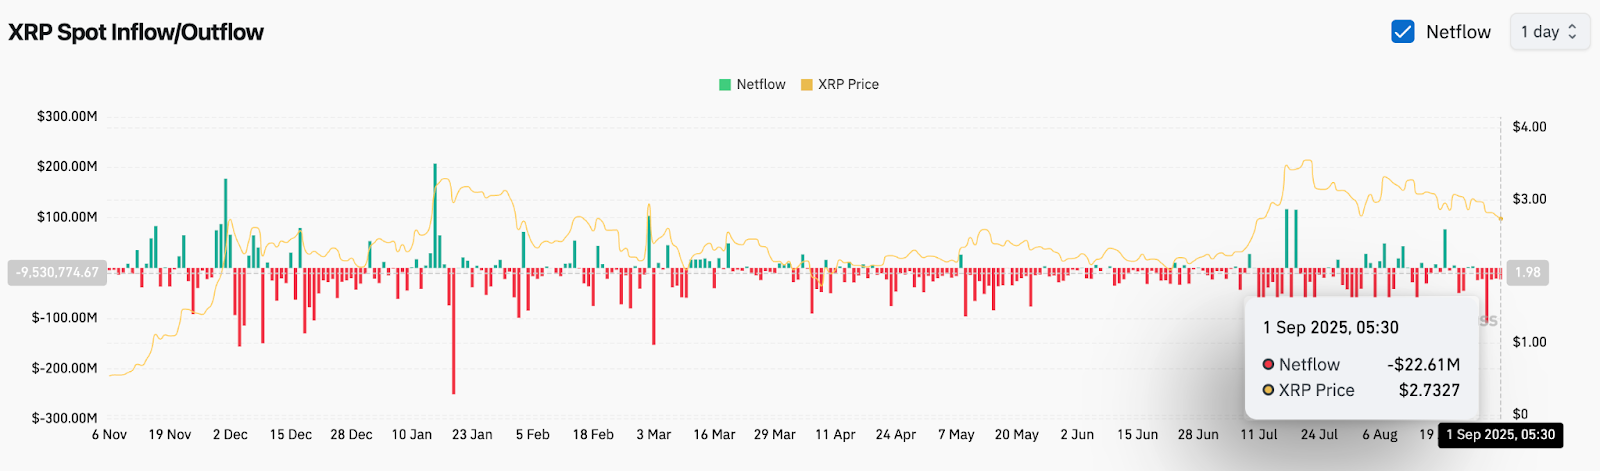
On-chain data adds weight to the cautious narrative. Spot exchange flows recorded $22.6 million in outflows on September 1, underscoring active selling pressure from holders. Sustained outflows of this size tend to limit upside rallies and create headwinds for price recovery.
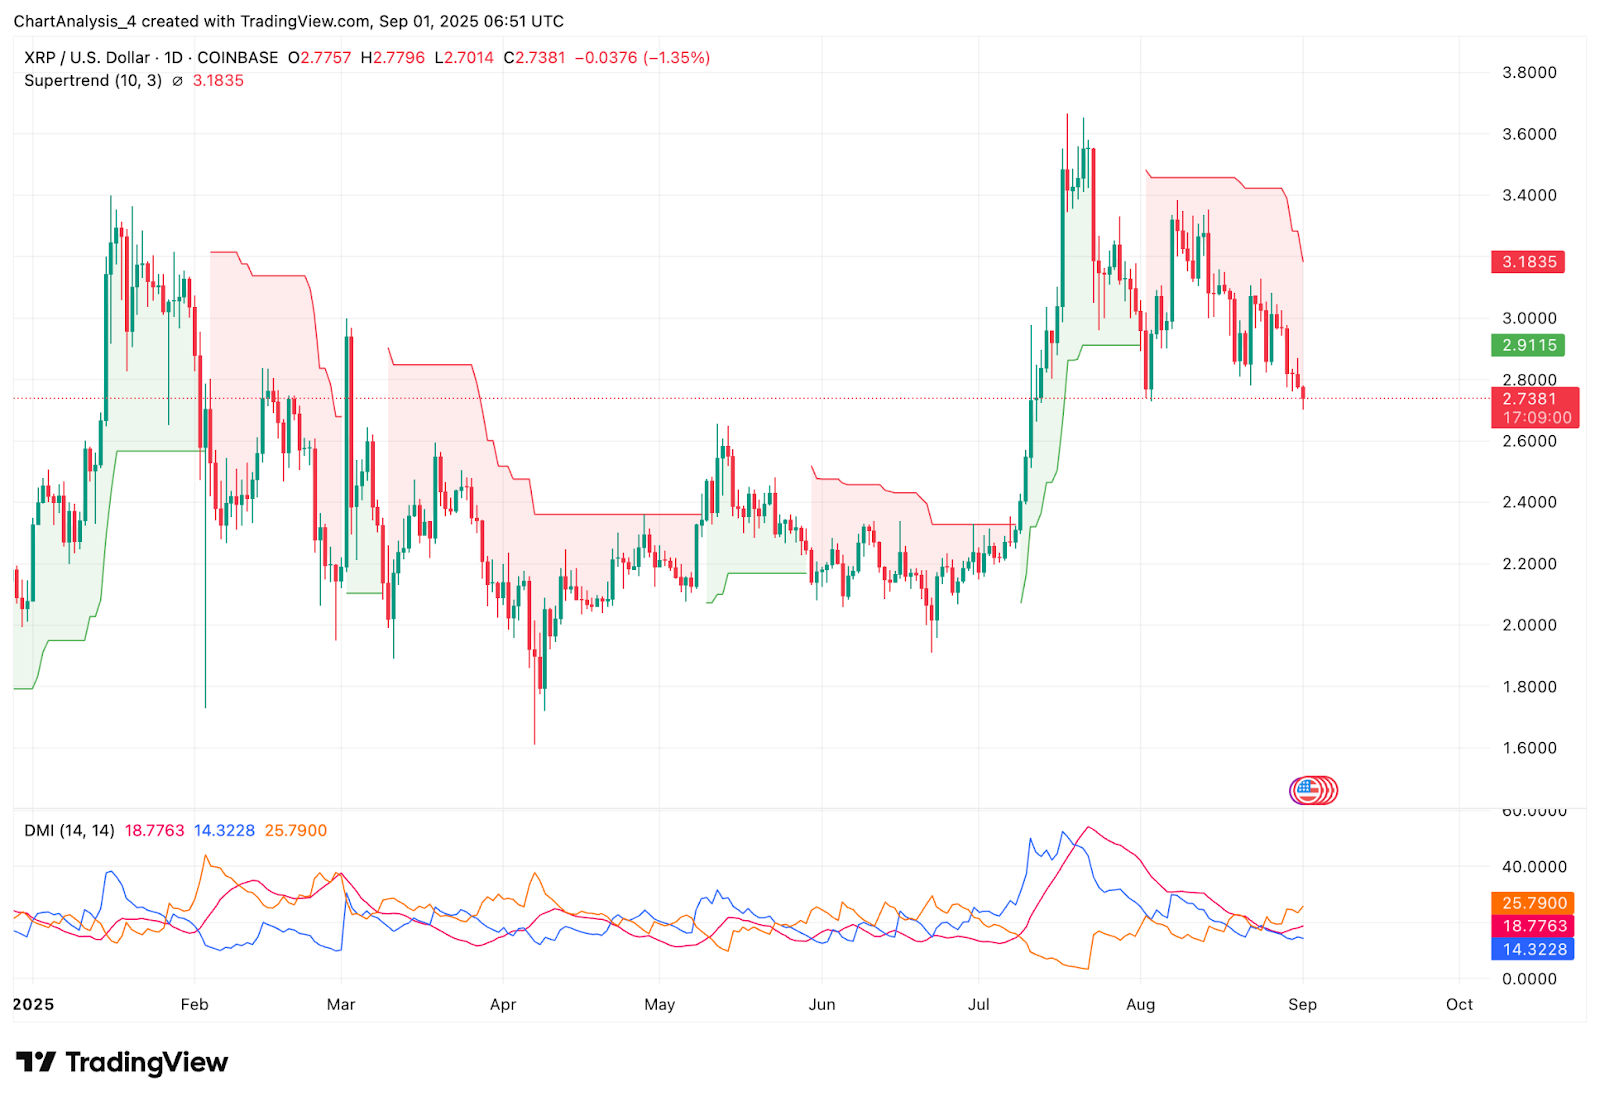
The daily chart reinforces this bias. The supertrend indicator remains bearish below $3.18, while the Directional Movement Index (DMI) shows the –DI line holding above +DI, signaling sellers remain in control. ADX values indicate that momentum behind the bearish move is strengthening, suggesting short-term rallies may face quick rejection.
Contrasting Views: Bulls Defend Band, Bears Eye Breakdown
Bulls argue that XRP remains within its broader bull market support band, with $2.66–$2.55 serving as the critical line in the sand. Defending this region could lay the foundation for a recovery back toward $3.00, with $3.18 as the major pivot to flip the supertrend bullish again.
Bears counter that persistent failures at descending resistance and ongoing outflows reflect deeper structural weakness. If $2.66 gives way, price could slide quickly to $2.30, where the weekly chart identifies macro support. A break below that level would likely invalidate the bullish cycle setup.
XRP Short-Term Outlook: Decision Point at $2.66
Heading into September 2, XRP traders are closely watching the $2.66 level. A rebound from here could retest $2.85–$2.90, where EMAs cluster, while a break below $2.66 would expose $2.55 and potentially $2.30.
The short-term XRP price prediction leans cautious given heavy outflows and bearish daily signals. However, oversold RSI conditions and visible weekly support offer bulls a chance to stabilize if volume returns near $2.70. The next 24–48 hours will be crucial in determining whether XRP consolidates or slides deeper.
XRP Price Forecast Table
| Indicator | Signal | Levels/Notes |
| Price Today | $2.73 | Trading near oversold zone |
| Support | $2.70 / $2.66 / $2.55 / $2.30 | Key weekly and macro levels |
| Resistance | $2.85 / $2.95 / $3.18 | EMA cluster and supertrend |
| RSI | 28 (4H) | Oversold, risk of bounce |
| MACD/DMI | Bearish tilt | –DI above +DI, trend favors sellers |
| Pattern | Descending resistance | Caps rallies since August |
| Flows | –$22.6M outflow | Selling pressure active |
| Supertrend | Bearish below $3.18 | Needs breakout for reversal |
Disclaimer: The information presented in this article is for informational and educational purposes only. The article does not constitute financial advice or advice of any kind. Coin Edition is not responsible for any losses incurred as a result of the utilization of content, products, or services mentioned. Readers are advised to exercise caution before taking any action related to the company.
 Price Prediction for April 2026: Will Chainlink Move Higher?")
 Price Prediction: Can Bulls Sustain the $0.045 Push?")


