
- XRP falls below all major EMAs, trading near $1.37 after breaking multi-month trendline support.
- Goldman Sachs discloses $153M XRP exposure through spot ETFs, contributing to $1.01B total ETF assets.
- Spot outflows surge to $29.82M on February 11 as price tests the $1.35 psychological support zone.
XRP price today trades near $1.3723, down nearly 2% in the past 24 hours after breaking below the descending trendline that has guided price action since July. The move comes as Goldman Sachs disclosed $153 million in XRP exposure through regulated ETFs, yet spot outflows and technical weakness continue to pressure the token.
Goldman Sachs Reveals XRP Holdings Through ETFs
According to its Q4 2025 13F filing, Goldman Sachs now holds approximately $153 million in XRP exposure through spot ETFs. The bank’s crypto portfolio includes $1.1 billion in Bitcoin, $1 billion in Ethereum, $153 million in XRP, and $108 million in Solana.
The exposure comes through regulated investment vehicles rather than direct token custody. Goldman’s XRP holdings spread across multiple products including Bitwise XRP ETF, Franklin Templeton XRP ETF, Grayscale XRP ETF, and 21Shares XRP ETF. The bank’s $153 million investment contributes significantly to the $1.01 billion in total XRP ETF assets.
On the day of disclosure, XRP ETFs recorded $3.26 million in new inflows, with only Bitwise and Grayscale posting positive flows. Trading volume reached $15 million, indicating modest institutional activity despite the major disclosure.
Spot Outflows Accelerate As Selling Pressure Mounts
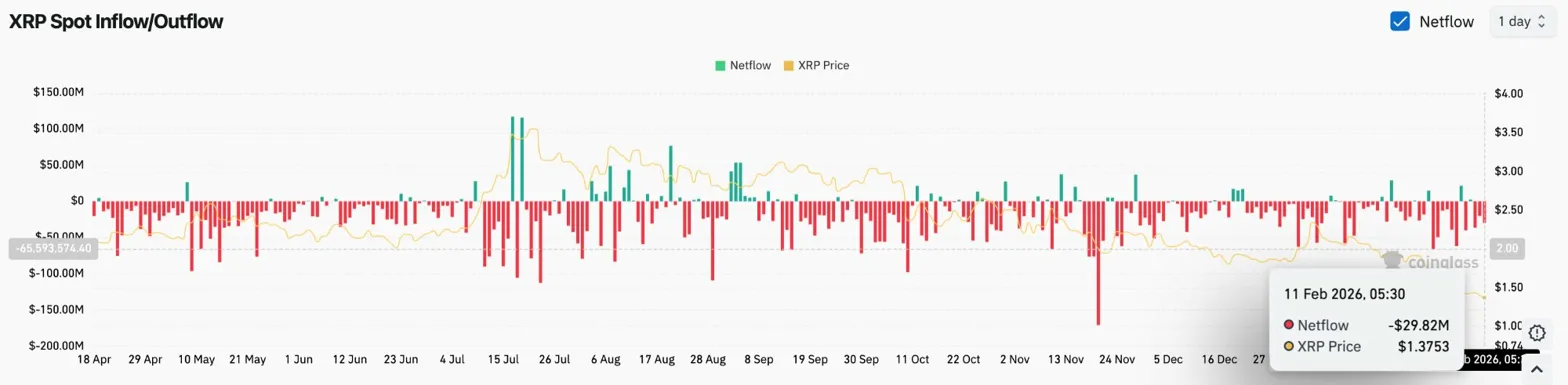
Spot flows tell a different story. Coinglass data shows XRP recorded $29.82 million in net outflows on February 11, one of the largest single-session exits in recent weeks.
When spot outflows reach this magnitude while ETF flows remain modest, it signals that broader market participants are reducing exposure faster than institutions are accumulating.
All Major EMAs Turn Into Resistance
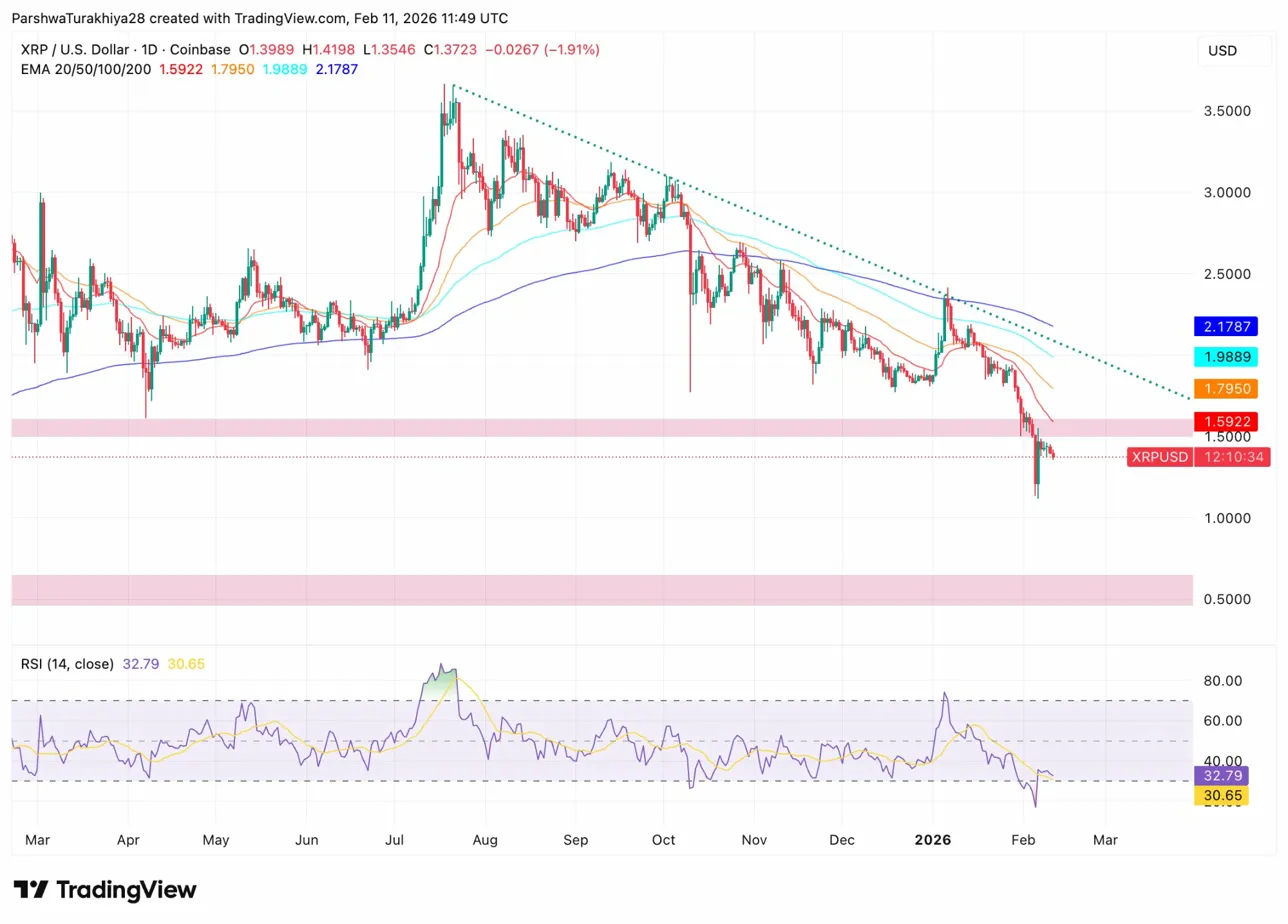
On the daily chart, XRP has broken below every major moving average. The 20-day EMA sits at $1.5922, the 50-day at $1.7950, the 100-day at $1.9889, and the 200-day at $2.1787. All four EMAs are stacked downward, creating a clear resistance ceiling.
The chart shows:
- Price breaking below the descending trendline from the July peak
- Multiple failed attempts to reclaim the 20-day EMA
- Support zone at $1.50 now being tested
XRP lost the $1.50 support level that held through most of January. The break places the token at its lowest level since late 2024 and opens the door to a retest of the $1.35 psychological zone. RSI sits at 32.79, approaching oversold territory but not yet showing reversal signals.
A daily close below $1.35 would confirm a clean breakdown and expose the next demand zone near $0.50, where price consolidated before the July rally. Without reclaiming the 20-day EMA at $1.5922, the structure remains decisively bearish.
Descending Trendline Caps Recovery Attempts
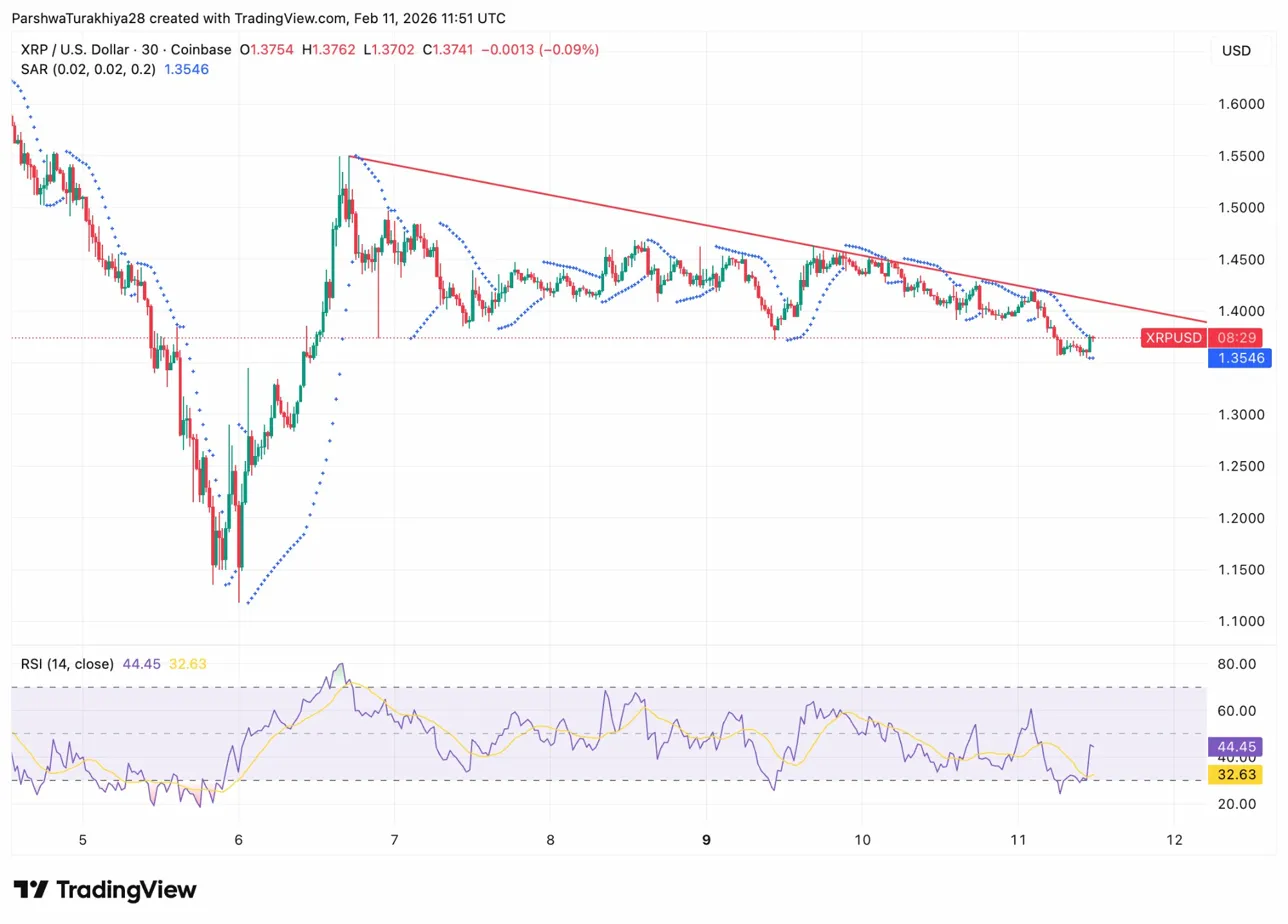
The 30-minute chart reveals XRP testing support near $1.3702 after breaking below the descending trendline. Parabolic SAR dots sit above price at $1.3546, confirming bearish momentum. RSI holds at 44.45, neutral but declining as sellers defend each bounce attempt.
The structure shows:
- Price trading below the descending resistance line
- Lower highs forming since February 9
- SAR flipping bearish after failed breakout attempts
Buyers need to reclaim $1.40 and break above the descending trendline to shift momentum back toward neutral. Until that happens, every bounce remains a relief rally inside a bearish pattern. The chart shows no signs of capitulation, but also no signs of demand stepping in to defend current levels.
Outlook: Will XRP Go Up?
The next move depends on whether XRP can hold the $1.35 support zone.
- Bullish case: A bounce from $1.35 with a close above $1.40 and the descending trendline would shift momentum and place $1.50 back in range. Reclaiming $1.5922 confirms trend exhaustion.
- Bearish case: A daily close below $1.35 exposes the $1.00 psychological level and eventually the $0.50 demand zone from mid-2024. Losing $1.35 marks a new multi-month low.
Disclaimer: The information presented in this article is for informational and educational purposes only. The article does not constitute financial advice or advice of any kind. Coin Edition is not responsible for any losses incurred as a result of the utilization of content, products, or services mentioned. Readers are advised to exercise caution before taking any action related to the company.


