
- XRP faces strong resistance at $2.60 but needs higher volume for a breakout.
- Support at $2.40-$2.45 holds, but a drop below $2.35 may trigger further losses.
- RSI and MACD show neutral momentum, indicating uncertainty in price direction.
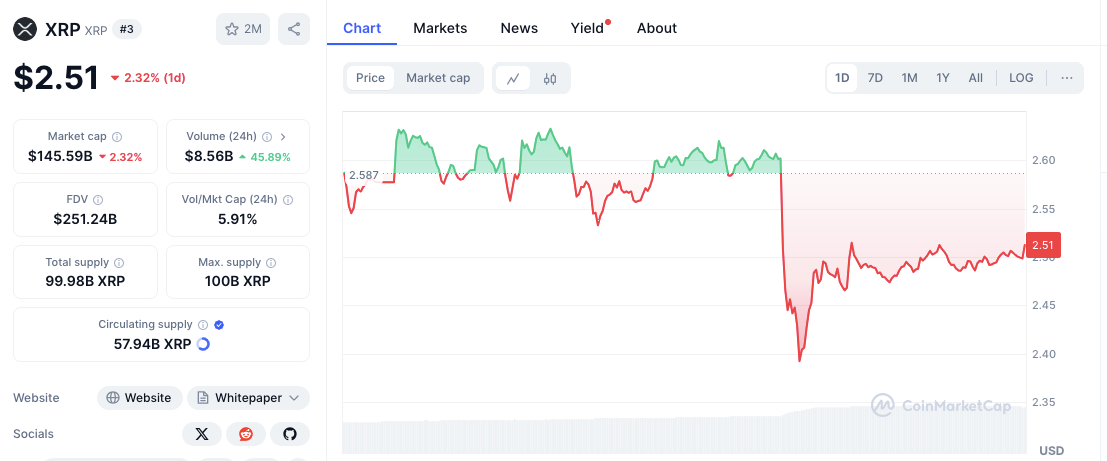
XRP is currently navigating a volatile trading range, with prices moving up and down, making investors nervous. The price has fallen 3.01% in the last 24 hours, settling at around $2.50.
Even with this drop, XRP is showing signs of hanging in there, as buyers try to take back control.
Market Mood & Price Action
XRP’s price hit a daily high of approximately $2.587 before experiencing a sharp drop to $2.40. But, it has bounced back somewhat to $2.50. This suggests that while sellers are pushing down, buyers are jumping in at important support zones to stop things from getting worse.
One thing to note that’s affecting XRP’s price is the spike in trading volume. The 24-hour volume has shot up by 46.45%, reaching $8.57 billion. This jump shows more and more interest, which could cause big price swings soon. Although volume is up, XRP’s market cap has gone down a bit, reflecting the recent price decrease.
Key Levels for XRP Traders
Keep an eye on resistance at $2.60 – $2.587. This level has been tough to crack. The price already struggled to get past this point before the latest price drop.
If buyers get stronger, breaking this level could pave the way for more gains towards $2.70 or higher. However, XRP needs strong buying and consistent volume to break through this resistance.
Support Zone in Focus
On the downside, there’s immediate support in the $2.40 – $2.45 range. This area helped the price steady after the sharp fall, preventing a bigger drop.
If XRP can’t hold this level, the next key support is at $2.35. Falling below this could lead to more losses, pushing the price lower.
Related: XRP Will Head For $13 Soon If The Altcoin Meets Certain Conditions — Analyst
Technical Indicators: Mixed Signals

The Relative Strength Index (RSI) is currently at 50.24, putting XRP in neutral territory. This means there’s no strong buying or selling pressure right now.
Earlier, the RSI came back up from oversold levels, indicating some buying interest. However, unless it moves decisively above 60, we can’t be sure of bullish confirmation.
Related: Crypto VC: Trump’s Strategic Reserve Plan Gets Bitcoin Right, But XRP & Cardano Wrong
The MACD (Moving Average Convergence Divergence) indicator also shows a mixed picture. The MACD line is slightly above the signal line, hinting at a bit of bullish momentum.
Still, it stays close to the zero mark, showing no clear trend direction. The histogram suggests that while buyers are trying to regain control, momentum isn’t strong enough yet for a clear breakout.
Disclaimer: The information presented in this article is for informational and educational purposes only. The article does not constitute financial advice or advice of any kind. Coin Edition is not responsible for any losses incurred as a result of the utilization of content, products, or services mentioned. Readers are advised to exercise caution before taking any action related to the company.


