
- XRP trades near $2.15 after repeated rejections at $2.21, forming a tightening wedge with rising breakout risk.
- Spot flows remain negative with $17.6M in outflows, signaling weak demand and limiting upside momentum.
- Open interest edges higher but volume falls nearly 30 percent, showing traders positioning cautiously ahead of a move.
XRP price today trades around $2.15 after failing to break above $2.21, the level that rejected price several times in the past two weeks. The market is stuck inside a tightening wedge, with lower highs and higher lows forming a pressure point. That pattern usually ends with a sharp breakout, and the direction often depends on volume.
Spot Outflows Show Weak Demand
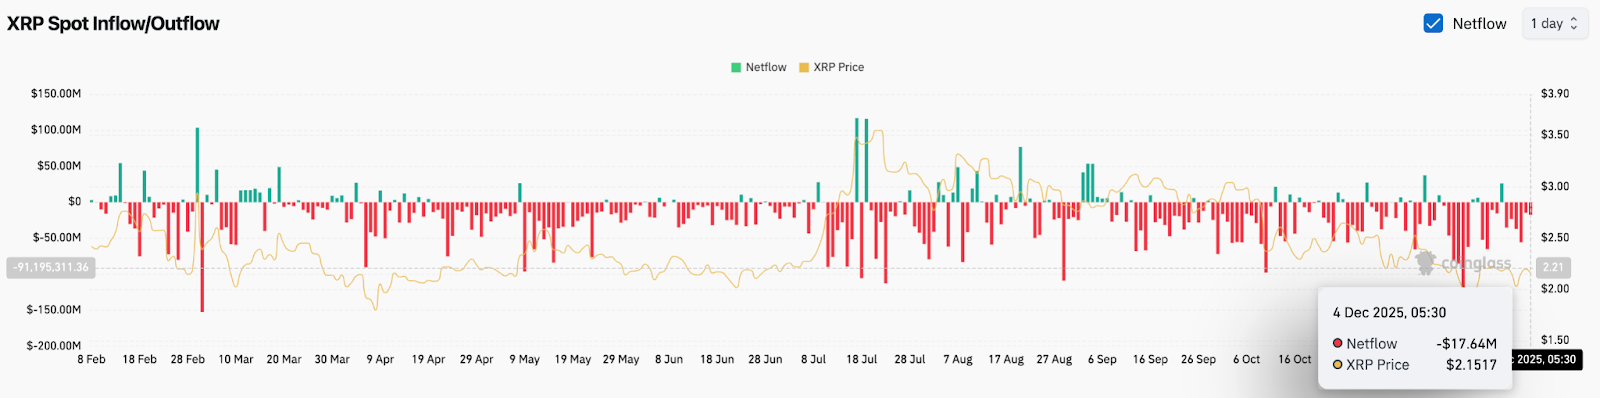
Spot flows remain negative. Coinglass shows roughly $17.6 million in net outflows on December 4. The market has seen a steady run of outflows over the past week, which signals that traders are moving tokens back to exchanges to sell, not hold.
Healthy spot flows often support rallies, but when flows are negative, price struggles to keep gains. XRP has shown quick rallies followed by sharp pullbacks because buyers are not stepping in aggressively.
Open Interest Edges Higher As Traders Wait
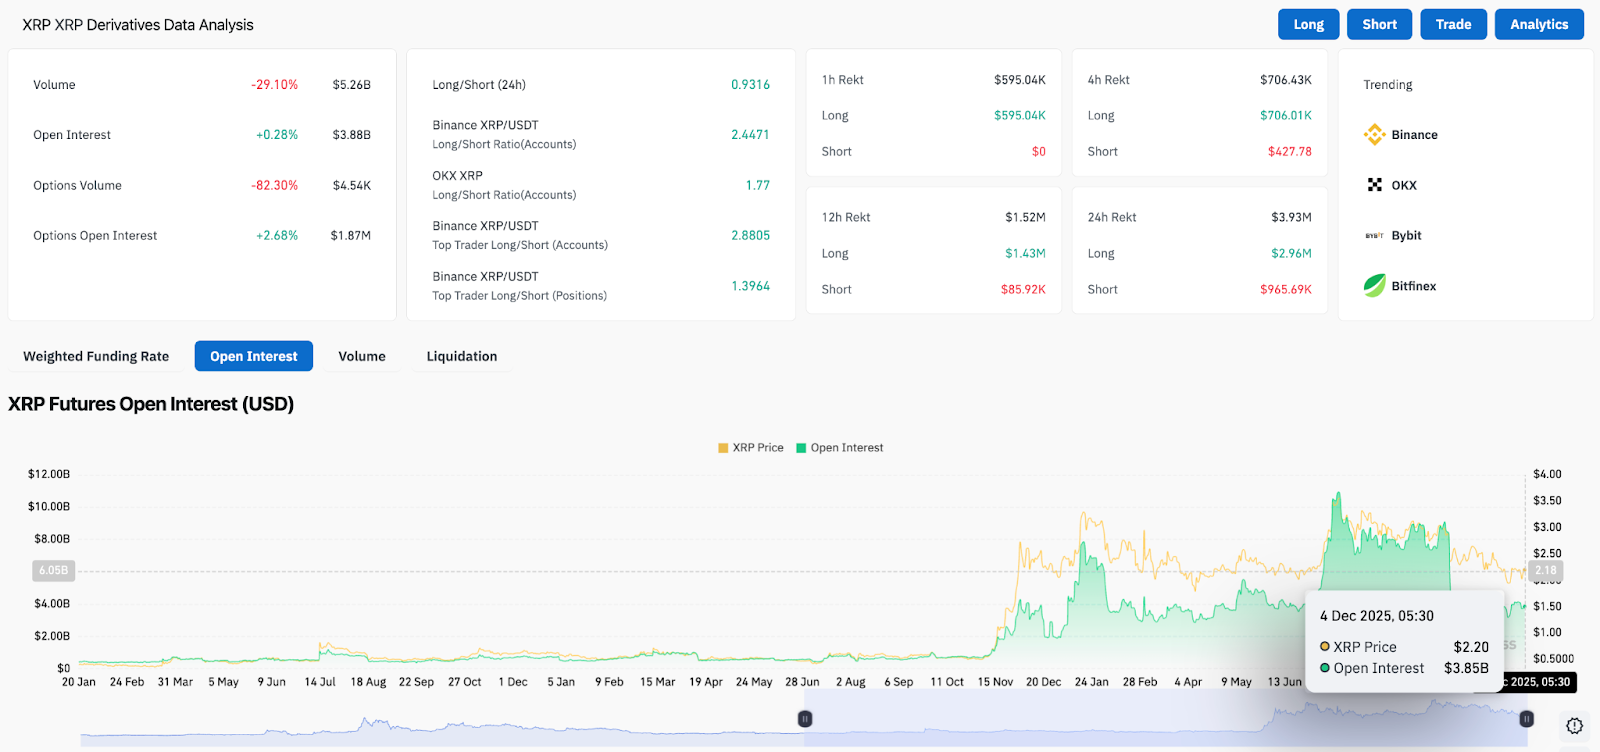
Derivatives data shows a slightly different story. Open interest increased about 0.28 percent to $3.88 billion. That means traders are opening positions, not closing them. Most of it looks like build up ahead of a breakout, not a bullish bet.
Related: Dogecoin Price Prediction: DOGE Attempts Recovery as ETF Activity…
Volume is down almost 30 percent, which shows that traders are waiting for a clear signal before committing more. Long short ratios lean positive across major exchanges, but conviction remains low.
The increase in open interest without volume usually means traders are positioning in advance but waiting for price to pick a side.
Trendline And EMAs Act As Heavy Resistance
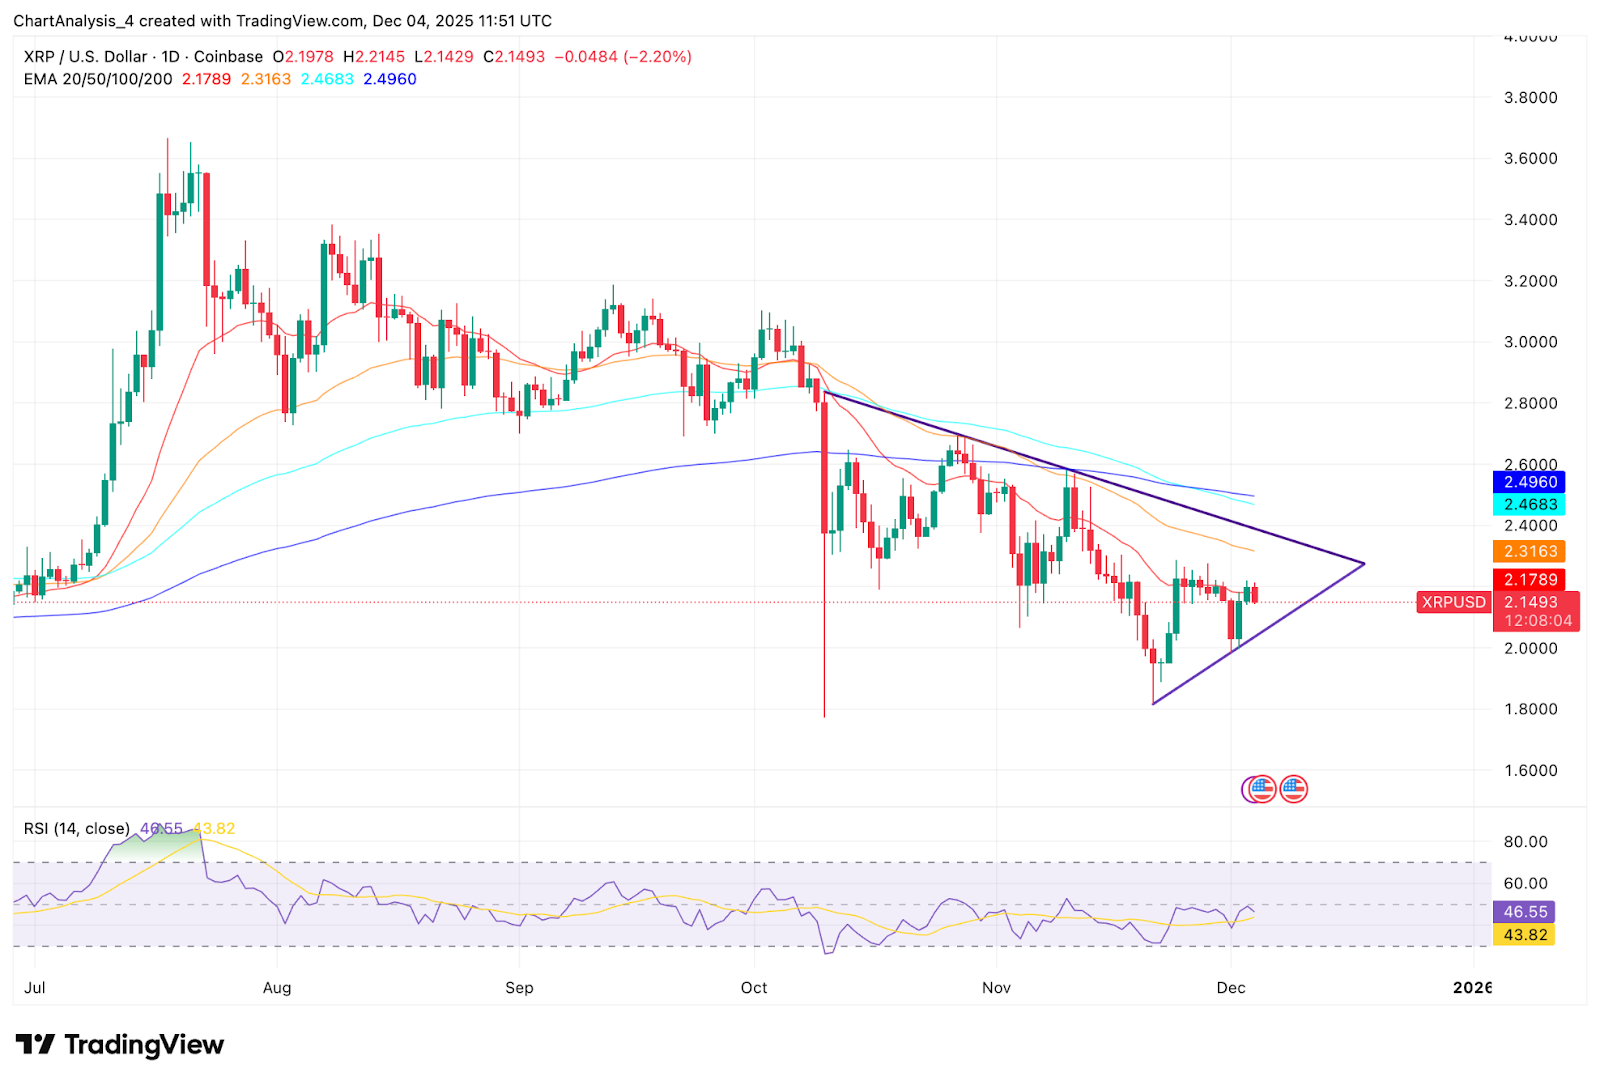
The daily chart shows XRP stuck under the 20, 50, 100, and 200 day EMAs. Those moving averages sit between $2.17 and $2.49 and form a heavy resistance zone.
Key levels now:
- First resistance: $2.21
- EMA cluster zone: $2.31 to $2.49
- Support: $2.05
- Strong support: $2.00
The trendline from October continues to push price lower, while the support line from mid November continues to catch dips. That is why price is compressing into a wedge.
Related: Ethereum Price Prediction: ETH Attempts to Stabilize as Market Pressure Builds
The RSI sits around 44, which is neutral, but slightly tilted toward weakness. It does not show exhaustion or strength. That fits the price action.
Short Term Moves Show Lack Of Strength
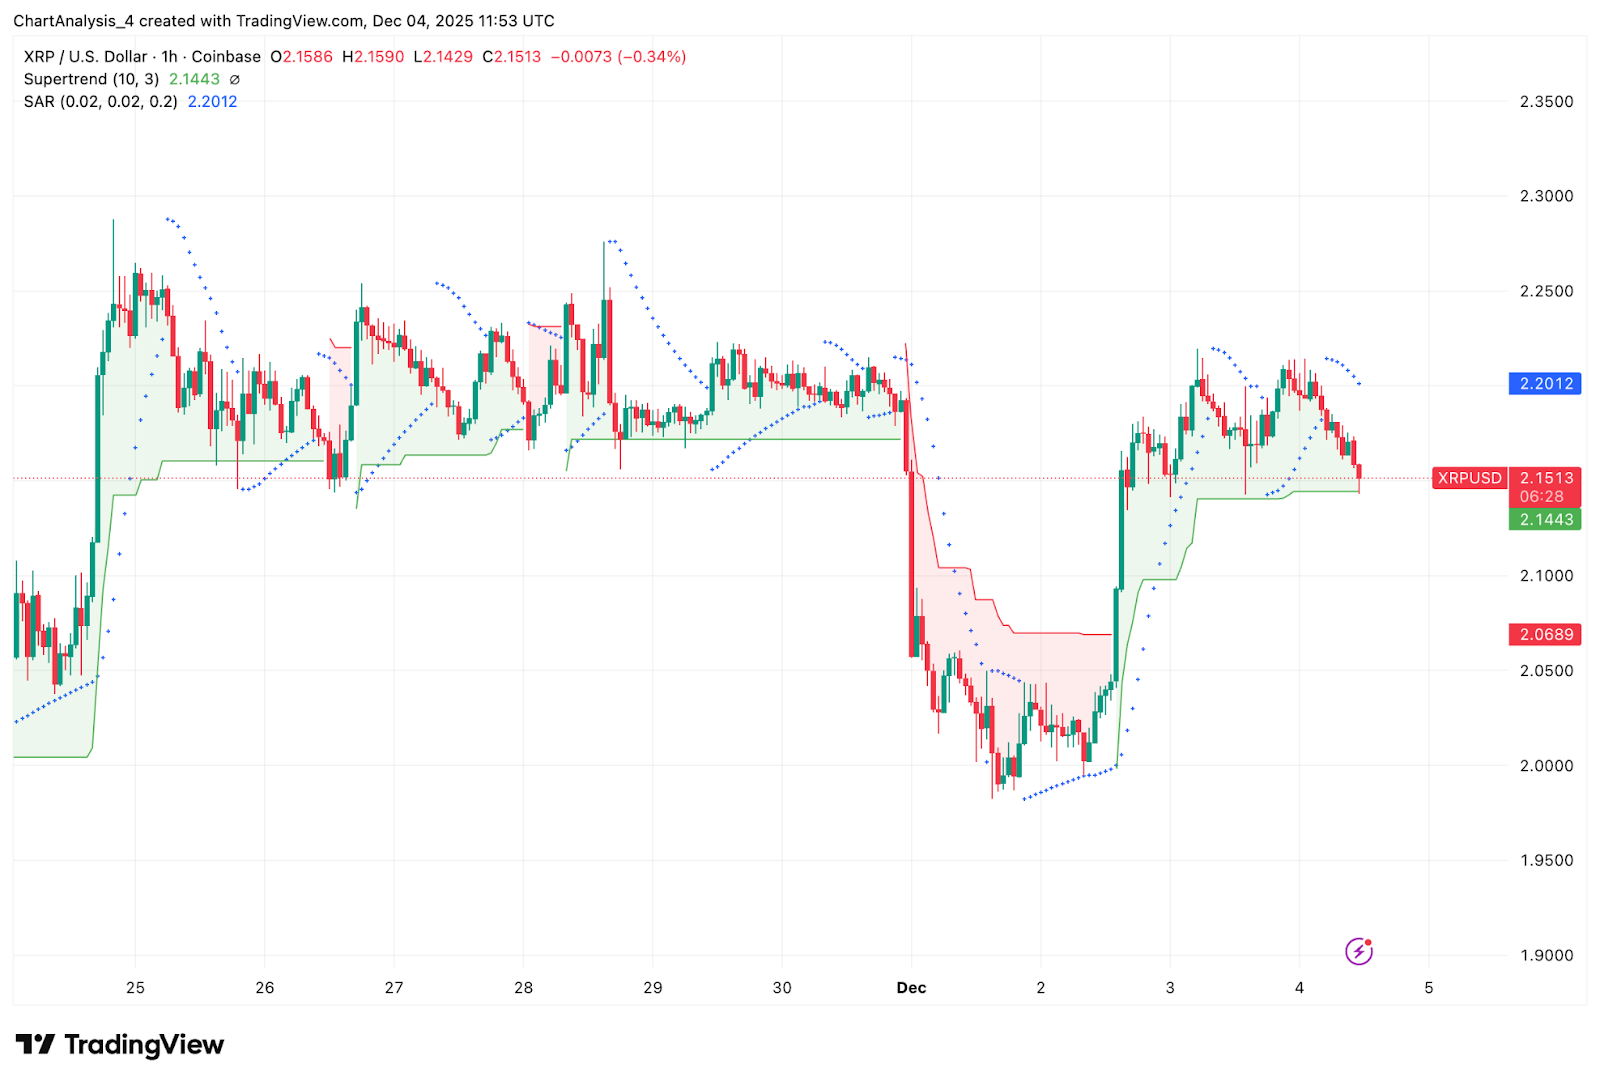
On the 1 hour chart, XRP is losing the short term support area near $2.15. The supertrend band is turning red, and the parabolic SAR dots are flipping above price, which usually confirms short term selling pressure.
If price fails to hold $2.14, the next test comes near $2.10, followed by $2.05. Buyers defended those areas earlier, but recent attempts show less energy.
Until XRP gets a strong bounce with good volume, intraday rallies can fade quickly.
Outlook. Will XRP Go Up?
XRP is stuck between support and resistance, with price compressing toward a breakout. Flows are weak, volume is low, and sellers continue to reject each bounce near $2.21.
- Bullish case. A breakout above $2.21, followed by a push toward $2.40 to $2.49, would show strength. Clearing $2.49 opens the door to $2.60.
- Bearish case. A break below $2.05 increases the risk of a drop toward $2.00. Losing $2.00 could open a deeper slide toward $1.85.
Right now, the chart favors patience. XRP is building energy, but it needs volume and a clean breakout to shift momentum. Buyers have work to do, and sellers still control price under $2.21.
Related: Chainlink Price Prediction: LINK Faces a Critical Turning Point as Bulls Test Major Barriers
Disclaimer: The information presented in this article is for informational and educational purposes only. The article does not constitute financial advice or advice of any kind. Coin Edition is not responsible for any losses incurred as a result of the utilization of content, products, or services mentioned. Readers are advised to exercise caution before taking any action related to the company.


