
- XRP trades at $1.3947, down 0.46%, pressing against the 4-hour Supertrend at $1.3541.
- Volume rises 9% to $3.95B while open interest dips slightly to $2.59B.
- XRPL payments hit 2.7M, and AMM pools reach 27K, though XRP stays down YTD.
XRP trades at $1.3947, down 0.46%, holding inside a tightening symmetrical triangle on the 4-hour chart as the market wrestles with a contradiction that has defined the token all year. The XRP Ledger has never been busier. The price has never been more disconnected from it.
4-Hour Chart: Triangle Compresses As EMA Cluster Stacks Overhead
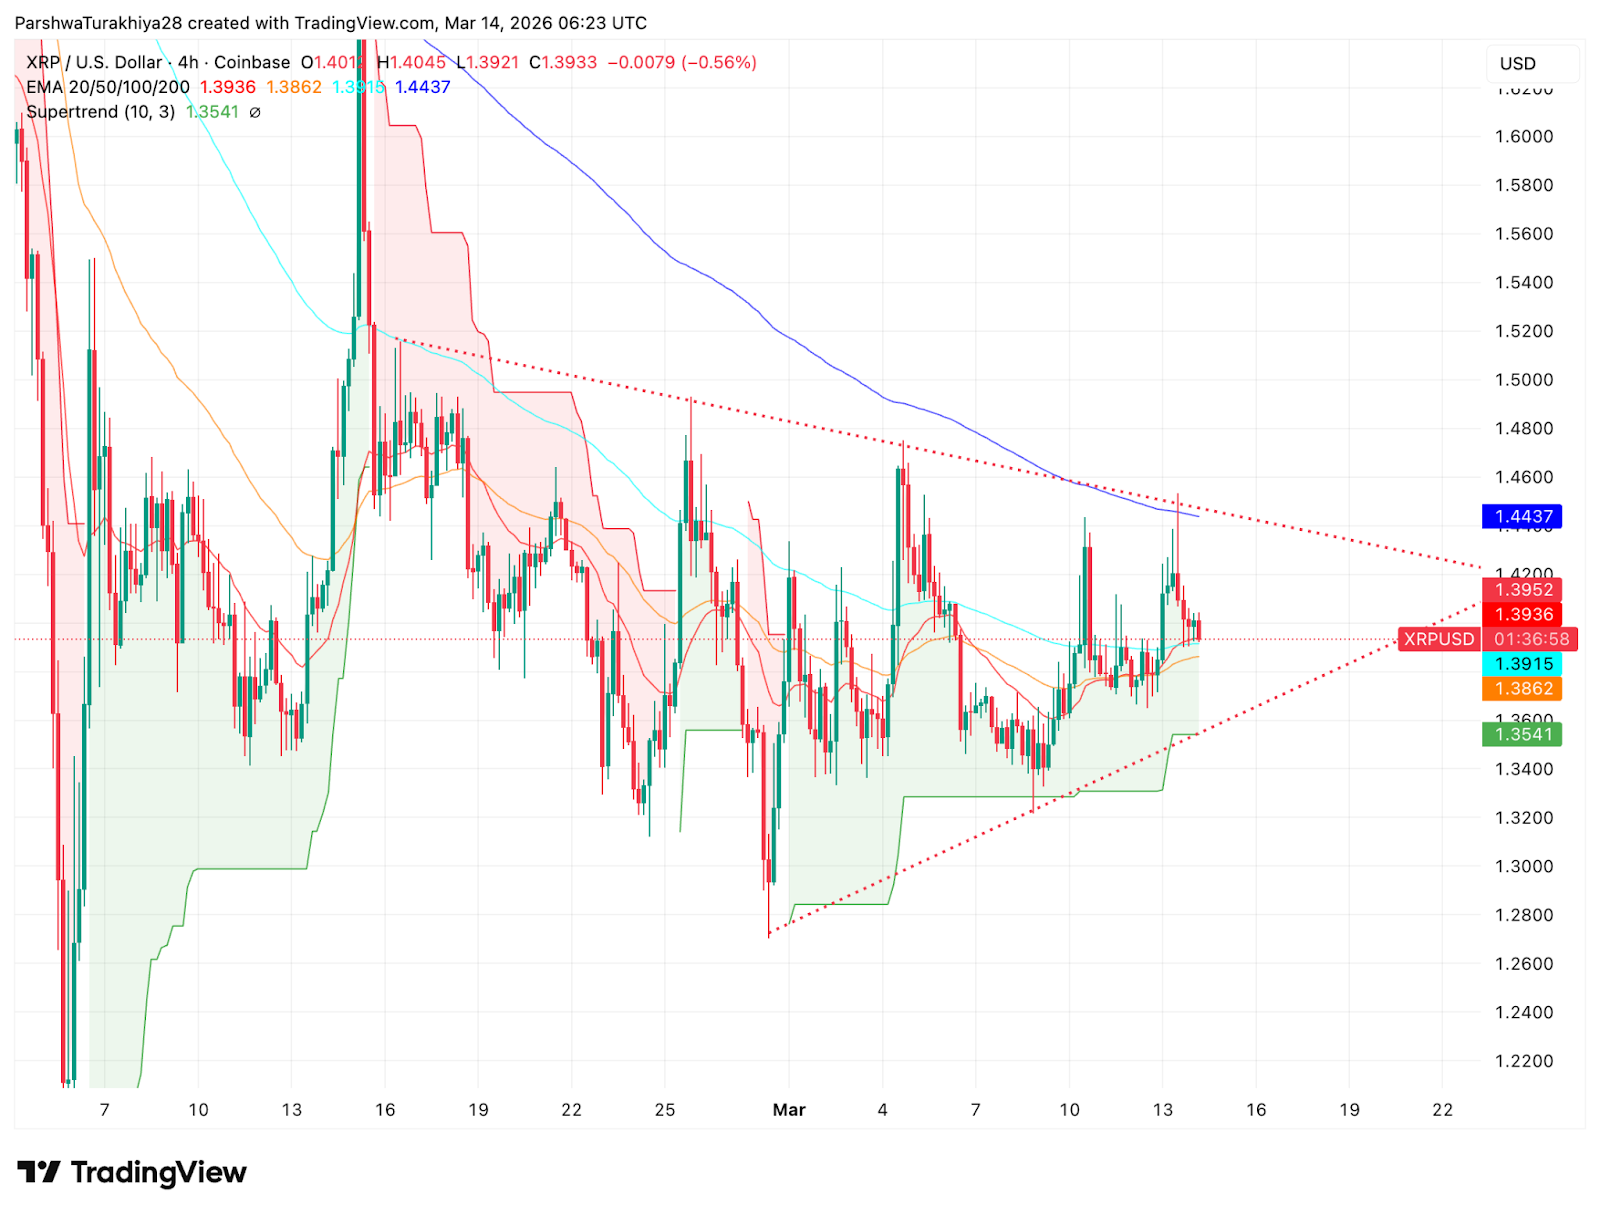
The 4-hour chart shows XRP inside a symmetrical triangle forming since the February lows near $1.27, with a rising lower trendline and a descending upper trendline converging near $1.40. The Supertrend sits at $1.3541 in a bullish position below the price.
The 200-day EMA at $1.4438 is the level that matters most. XRP has not closed a 4-hour candle above it since mid-February. The triangle is compressing toward resolution, and whichever direction it breaks will likely be amplified by the EMA cluster sitting directly at the breakout zone.
Key levels:
- Supertrend support: $1.3541
- Triangle lower boundary: ~$1.37 rising
- EMA resistance: $1.4438
- Triangle upper boundary: ~$1.42
- Target on upside break: $1.53 to $1.58
Derivatives: Options Volume Doubles As Traders Hedge The Triangle
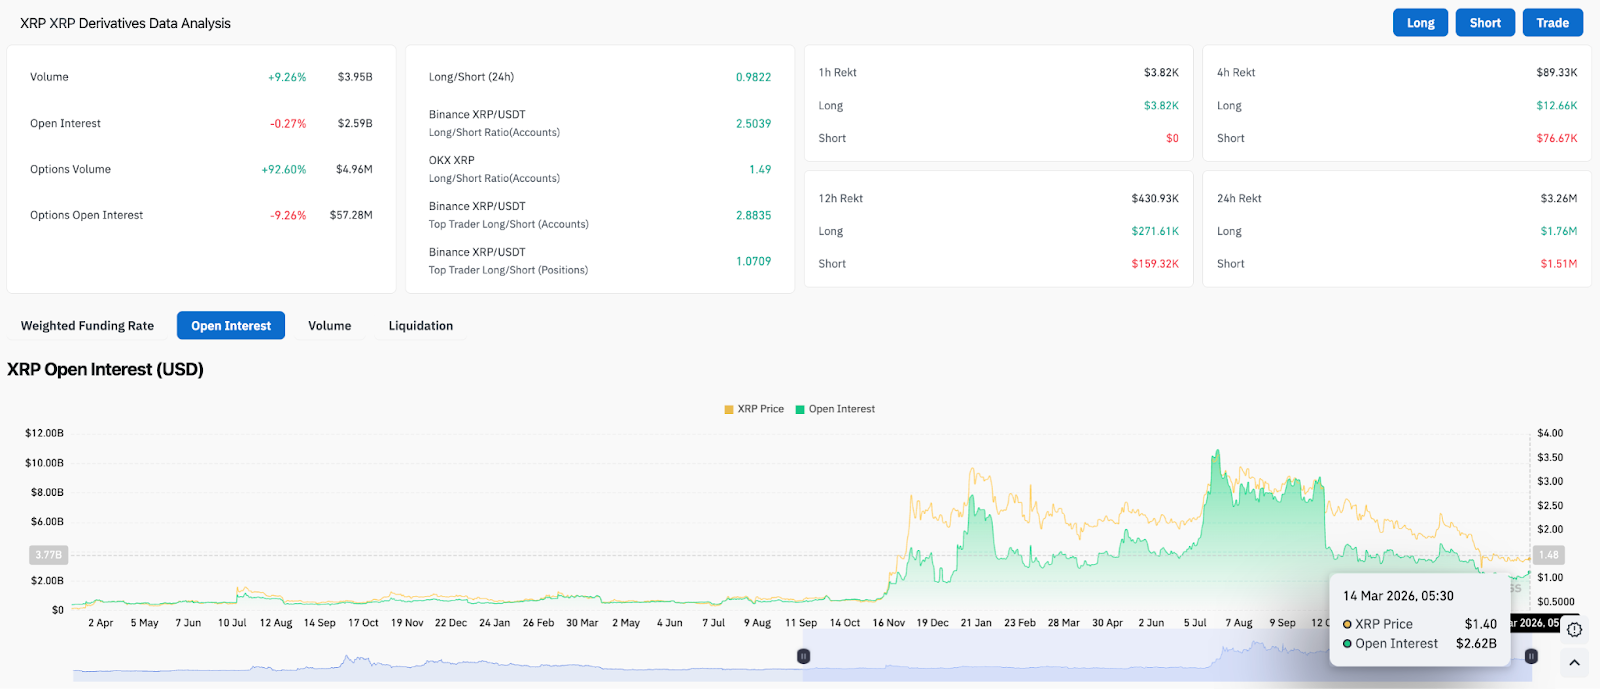
Volume rose 9.26% to $3.95B while open interest slipped 0.27% to $2.59B, a flat OI reading that suggests positioning is stable rather than building aggressively in either direction. The more telling number is options volume, which surged 92.60% to $4.96M. Traders are buying protection ahead of the triangle resolution rather than committing directionally through futures.
The Binance long/short ratio sits at 2.50 for accounts and 2.88 for top trader accounts, with top trader positions at 1.07. That gap between account-level bullishness and position-level neutrality among top traders is worth noting. Retail is leaning hard long while institutions are sitting closer to flat. The 24-hour liquidation split shows longs absorbed $1.76M against $1.51M for shorts, a balanced picture consistent with a market waiting for a catalyst rather than trading with conviction.
Related: XRP Price Prediction: Token Surges 2% As XRPL Hits 2.7M Daily Transactions
XRPL Is Booming, But XRP Is Not.
Daily payments on the XRP Ledger recently hit a 12-month high of 2.7 million, up from roughly 1 million in late 2025. AMM pools have grown to nearly 27,000, supporting over 16,000 unique tokens. Tokenized real-world assets on the ledger climbed to $461 million, up 35% in 30 days. Stablecoin transfer volume over the same period hit $1.19 billion. Every on-chain metric that should matter for a utility token is pointing higher.
The token is down 26% year-to-date. The explanation is structural. Most of XRPL’s transaction growth is driven by Ripple’s RLUSD stablecoin and tokenized assets that use XRP as a three-second bridge currency for cross-border settlement. The token gets used and immediately sold. There is no lockup, no staking demand, no DeFi TVL absorbing supply. XRPL’s total value locked sits at $47.54 million according to DeFiLlama, against a token market cap of $84 billion. For comparison, Solana carries around $4 billion in TVL.
The one area where the data genuinely supports a bull case is RWA tokenization. The $461 million in distributed asset value and $1.5 billion in represented asset value put XRPL ahead of several larger chains in specific tokenization categories, and the 30-day RWA transfer volume of $149 million suggests real institutional flows rather than noise.
Outlook: Will XRP Go Up?
- Bullish case: XRP breaks the triangle upper boundary at $1.42 and closes a 4-hour candle above the 200-day EMA at $1.4438. That opens the path toward $1.53 to $1.58, consistent with the triangle measured move target. March historically averages an 18% return for XRP, and macro stabilization around the Iran conflict could provide the broader risk-on backdrop needed.
- Bearish case: The triangle breaks downward through $1.37, and the Supertrend at $1.3541 fails to hold. That exposes the $1.27 to $1.30 support zone that has held through multiple tests this year. A break below it would put $1.22 back in focus.
Related: OFFICIAL TRUMP Price Prediction: TRUMP Jumps 60% On Mar-a-Lago Gala Announcement
Disclaimer: The information presented in this article is for informational and educational purposes only. The article does not constitute financial advice or advice of any kind. Coin Edition is not responsible for any losses incurred as a result of the utilization of content, products, or services mentioned. Readers are advised to exercise caution before taking any action related to the company.


