
XRP is under heightened technical pressure following multiple failed attempts to breach the $2.32–$2.35 resistance zone. The current XRP price stands at $2.15, marking a ~0.70% decline on the day. Despite a brief bullish push to $2.34 earlier this week, the pair has since reversed, and traders are closely watching structural and liquidity levels for potential inflection.
What’s Happening With XRP’s Price?
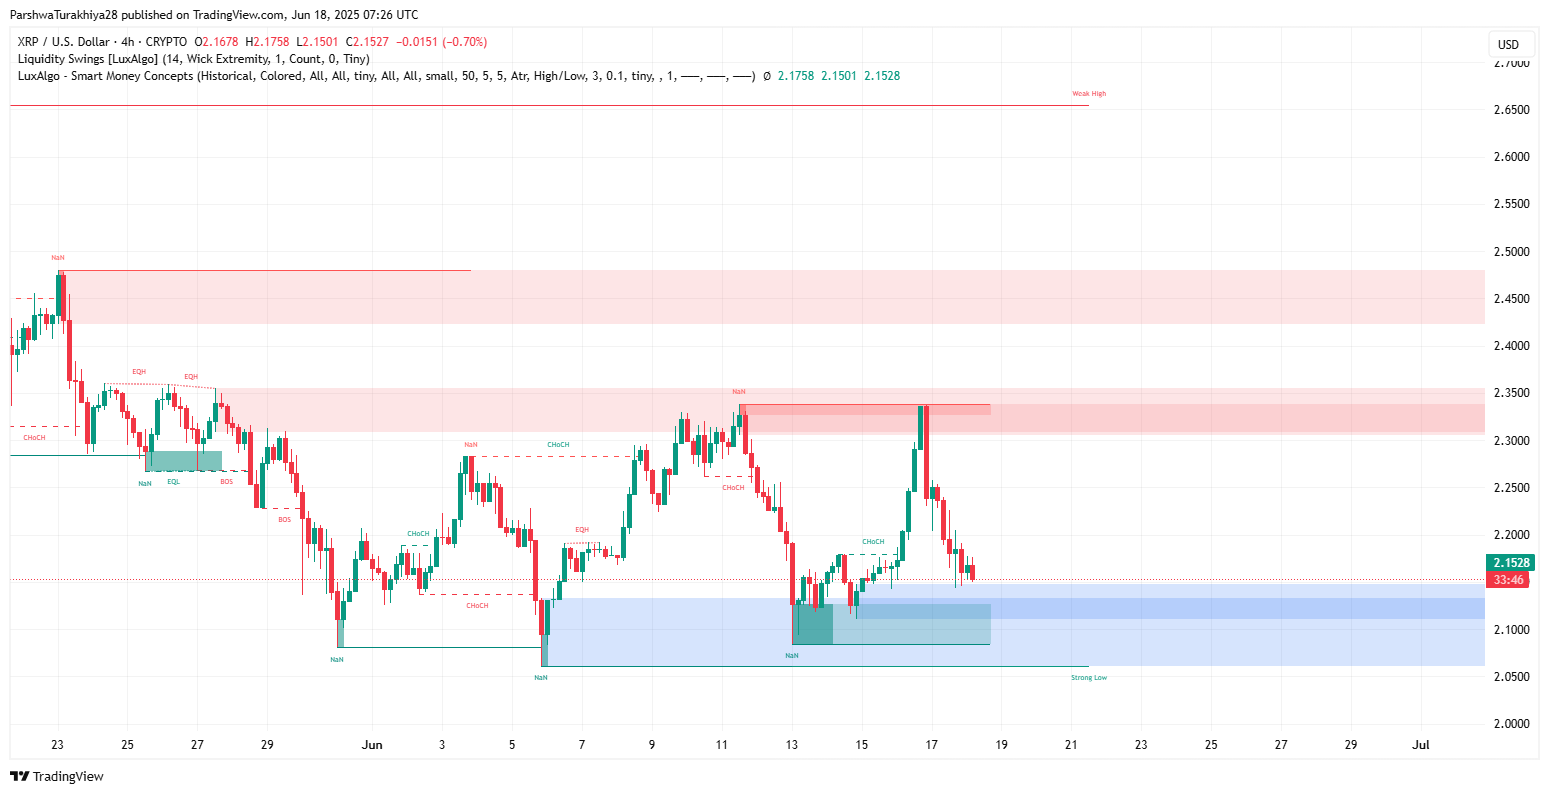
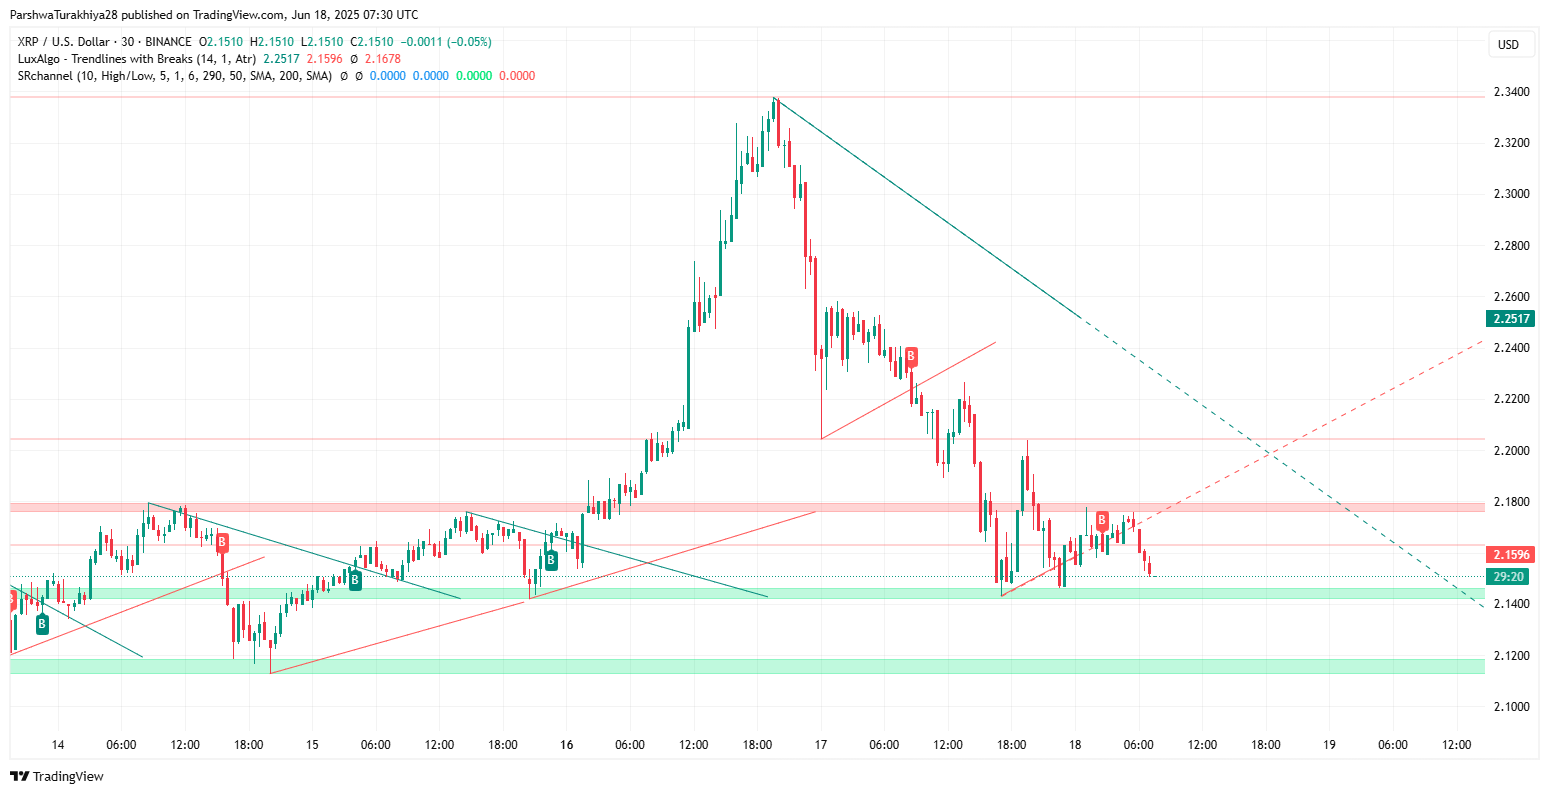
Price structure on the 4-hour chart shows clear Smart Money Concept characteristics. XRP formed multiple equal highs near $2.34 (noted as EQH) before breaking market structure with a bearish CHoCH. The current breakdown is anchored within a visible order block and liquidity zone between $2.10 and $2.14. Notably, XRP is hovering above the last major strong low, around $2.105, creating a pivotal support level.
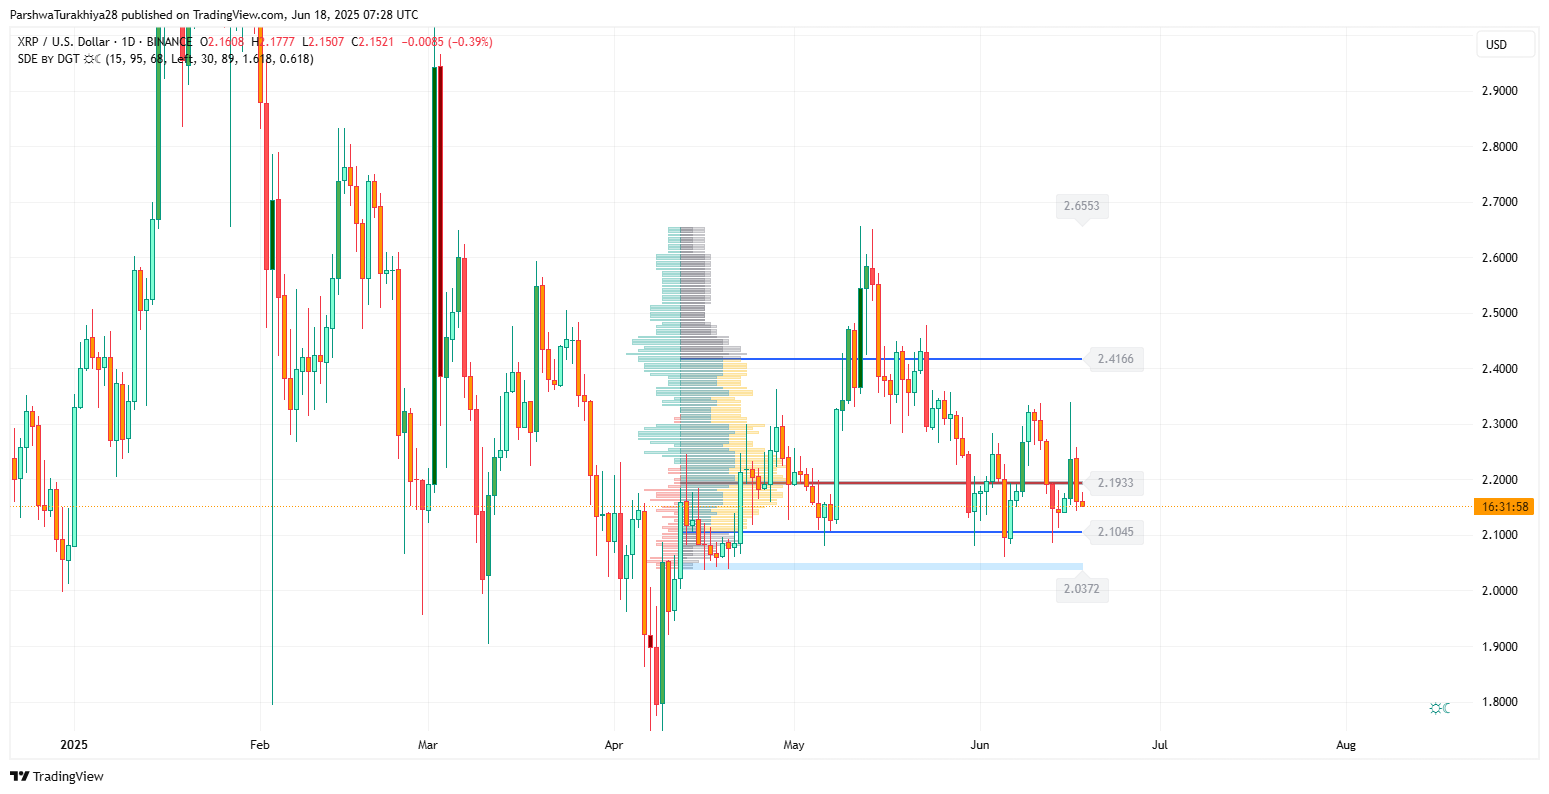
Volume Profile data and POC (point of control) from the daily chart aligns with the $2.19 level, which has now flipped into resistance after the latest breakdown. XRP will need to reclaim this mark to resume any upward momentum. Meanwhile, the Fibonacci retracement from the weekly swing high shows price stagnating below the 0.618 golden zone, signaling exhaustion.
Why XRP Price Going Down Today?
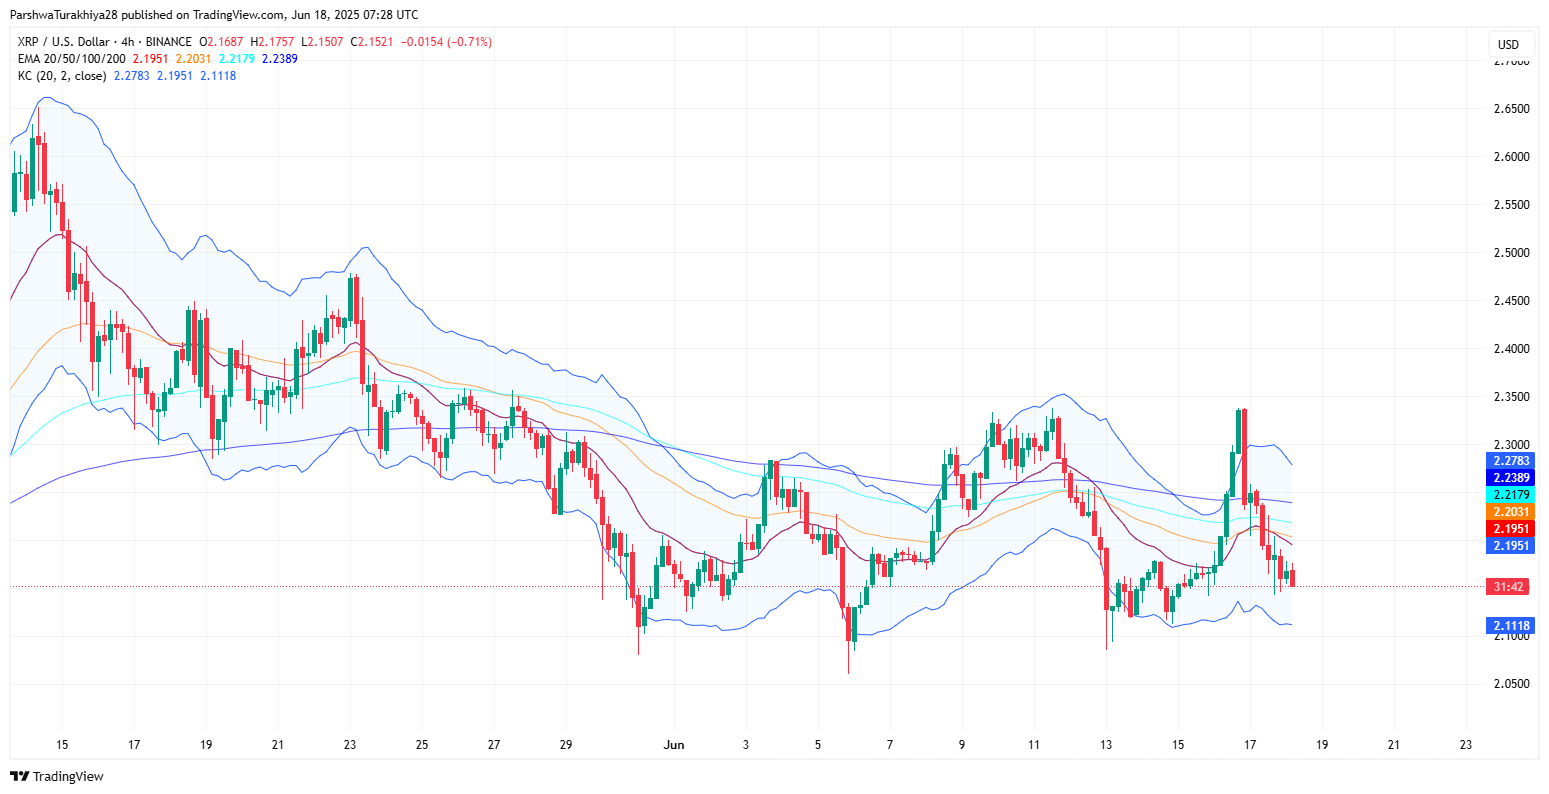
One of the main reasons behind the current retracement is pressure from the dynamic EMA cluster. The 20/50/100 EMA lines on the 4-hour chart are stacked bearishly with the 20 EMA acting as immediate resistance at $2.19. Price rejection near this level aligns with falling Parabolic SAR dots above candles—adding further confirmation of bearish bias.
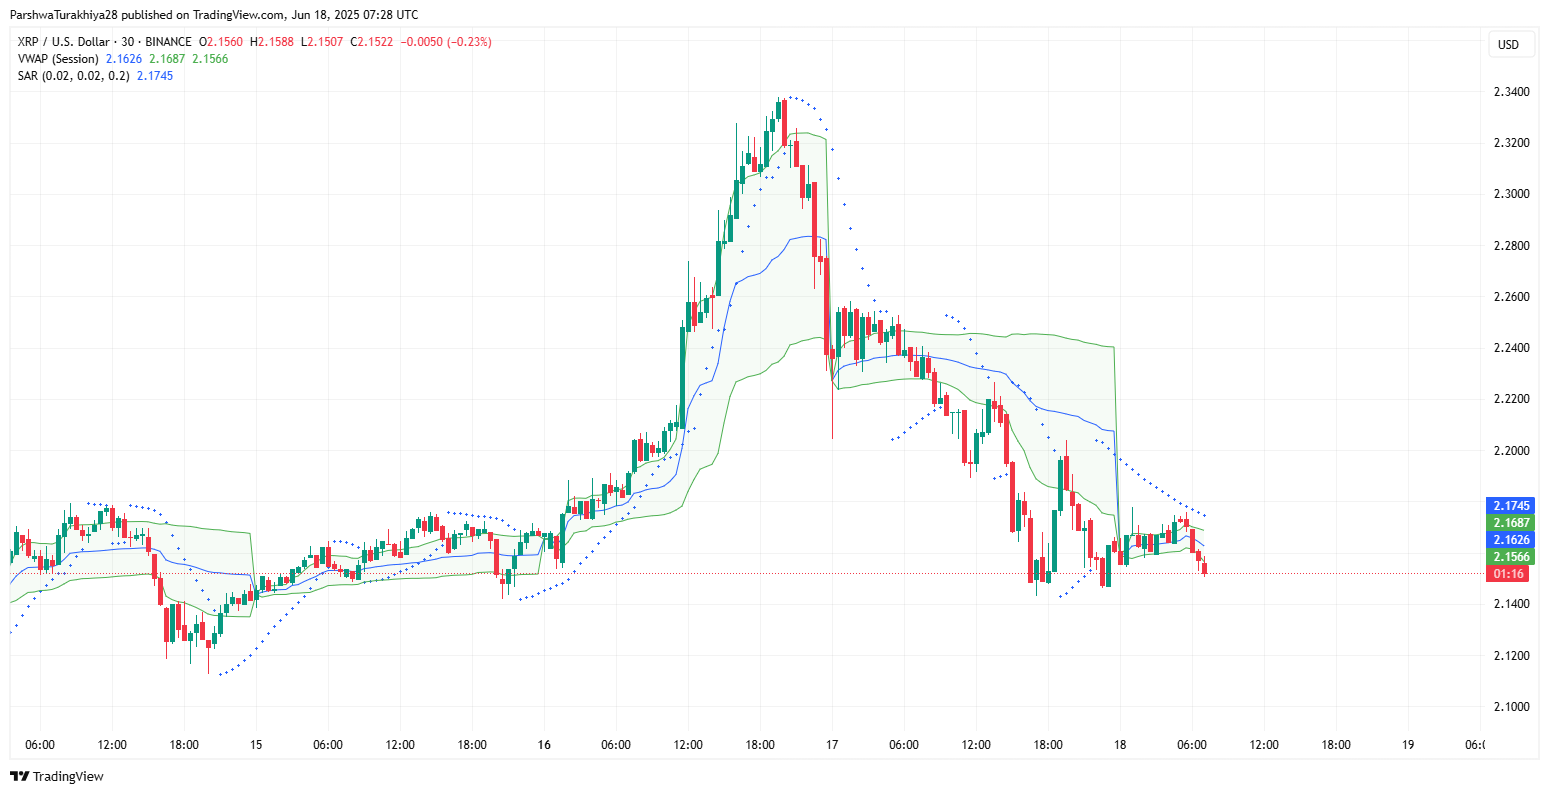
The Keltner Channel bands are also starting to open downward, with price rejecting both the mean and upper bands, a pattern that typically precedes breakdown continuation. On the 30-minute chart, XRP broke its VWAP line and is consolidating below it, another sign of potential weakness.
XRP Price Action Signals Elevated Volatility
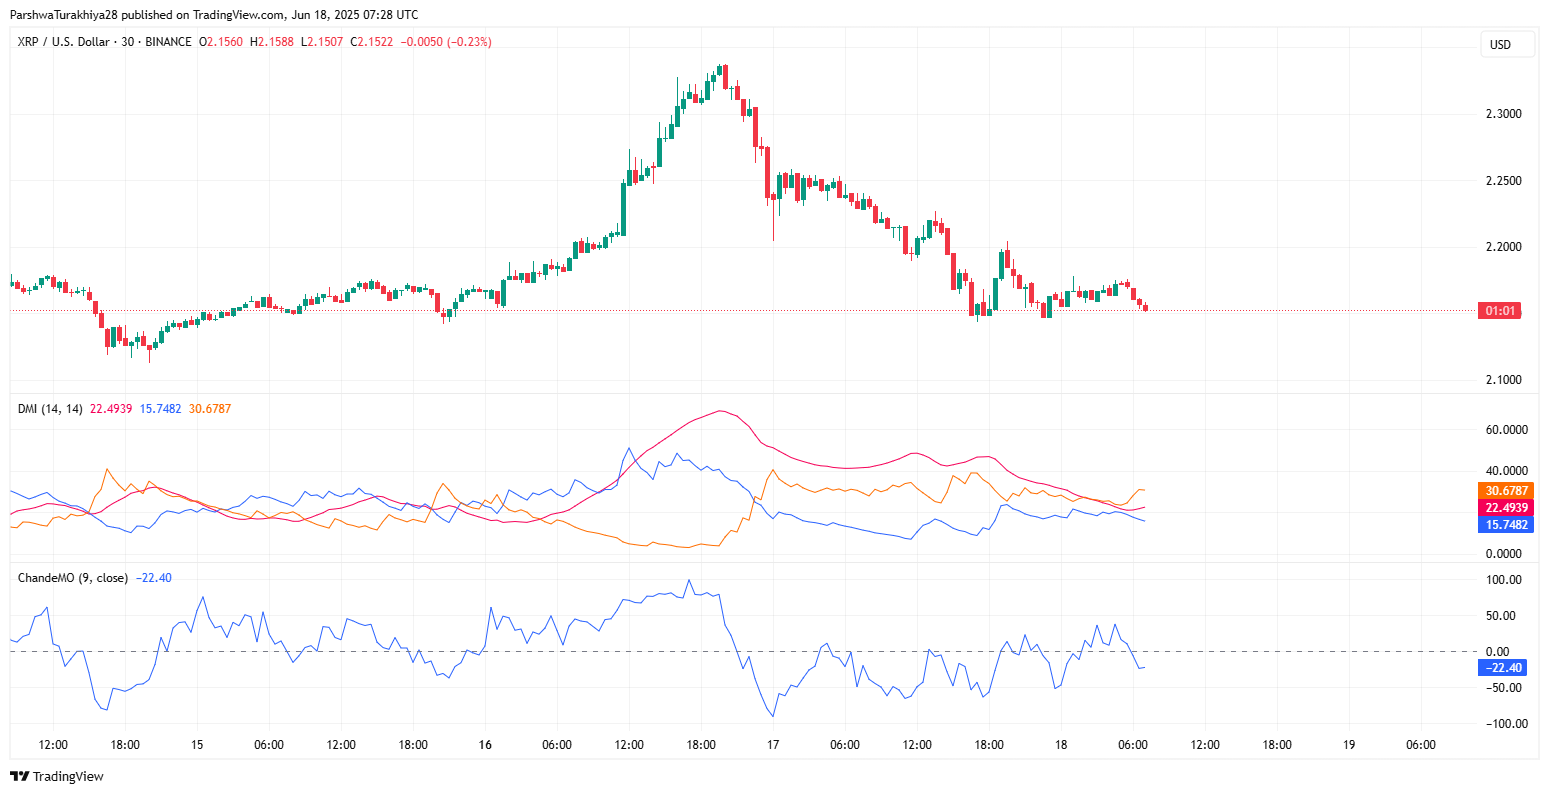
Multiple momentum indicators confirm the pressure. The Chande Momentum Oscillator shows values below -20, pointing to bearish strength. The Directional Movement Index (DMI) confirms trend weakness, with the ADX rising while the -DI leads.
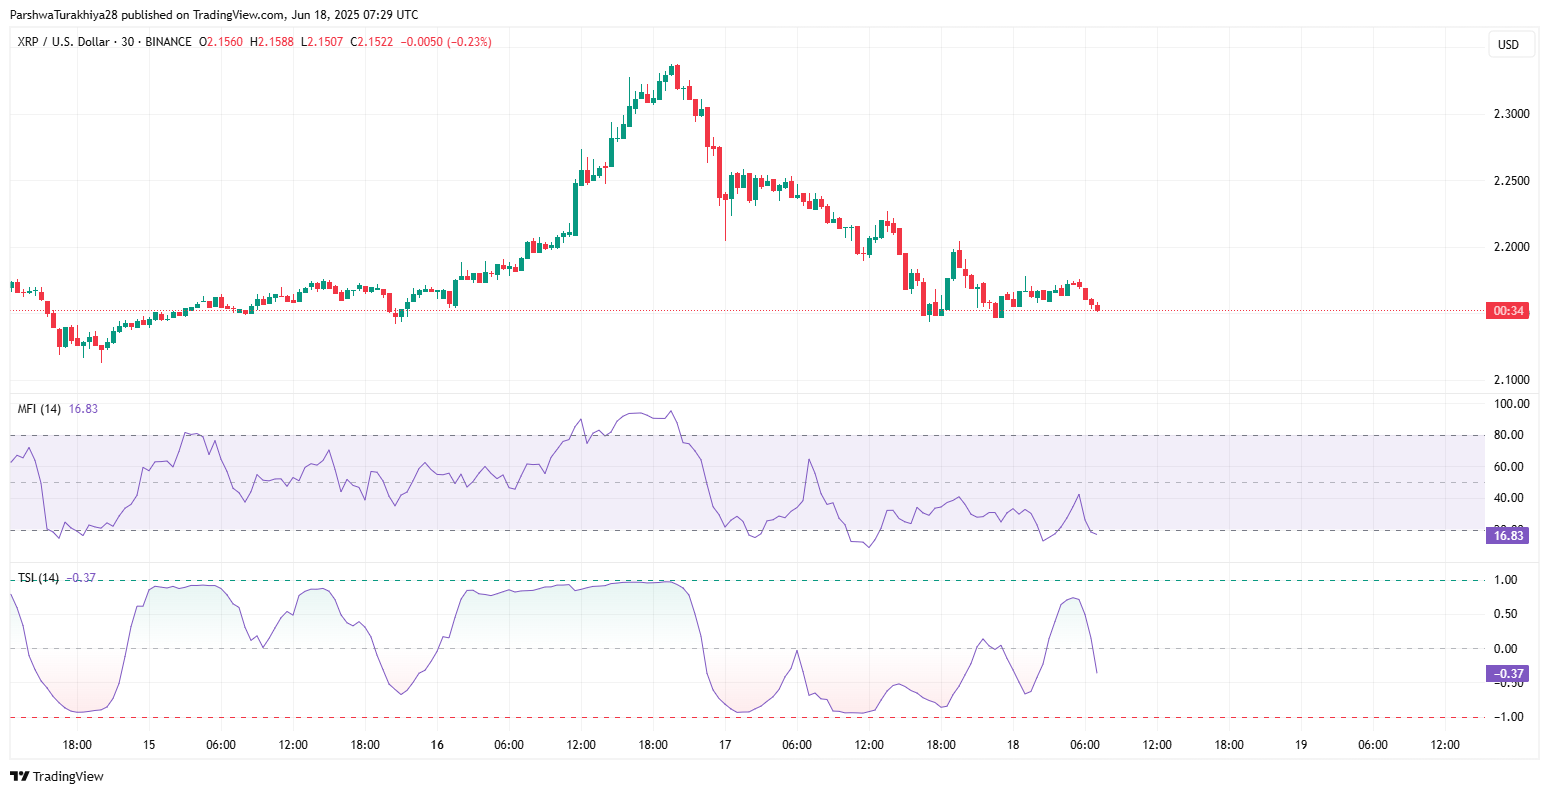
Simultaneously, Money Flow Index (MFI) is at 16.8, a deep oversold zone suggesting illiquidity and capital outflow. However, traders should note that the True Strength Index (TSL) has started curving back upward toward neutral, hinting at a possible short-term bounce if $2.10 continues to hold.
The 30-minute chart also shows a compression wedge forming just above the strong low support near $2.10–$2.12. If this range holds and the SAR flips, we could see a squeeze back toward the $2.19–$2.21 VWAP and EMA resistance band.
XRP Supertrend And Bull Band Analysis
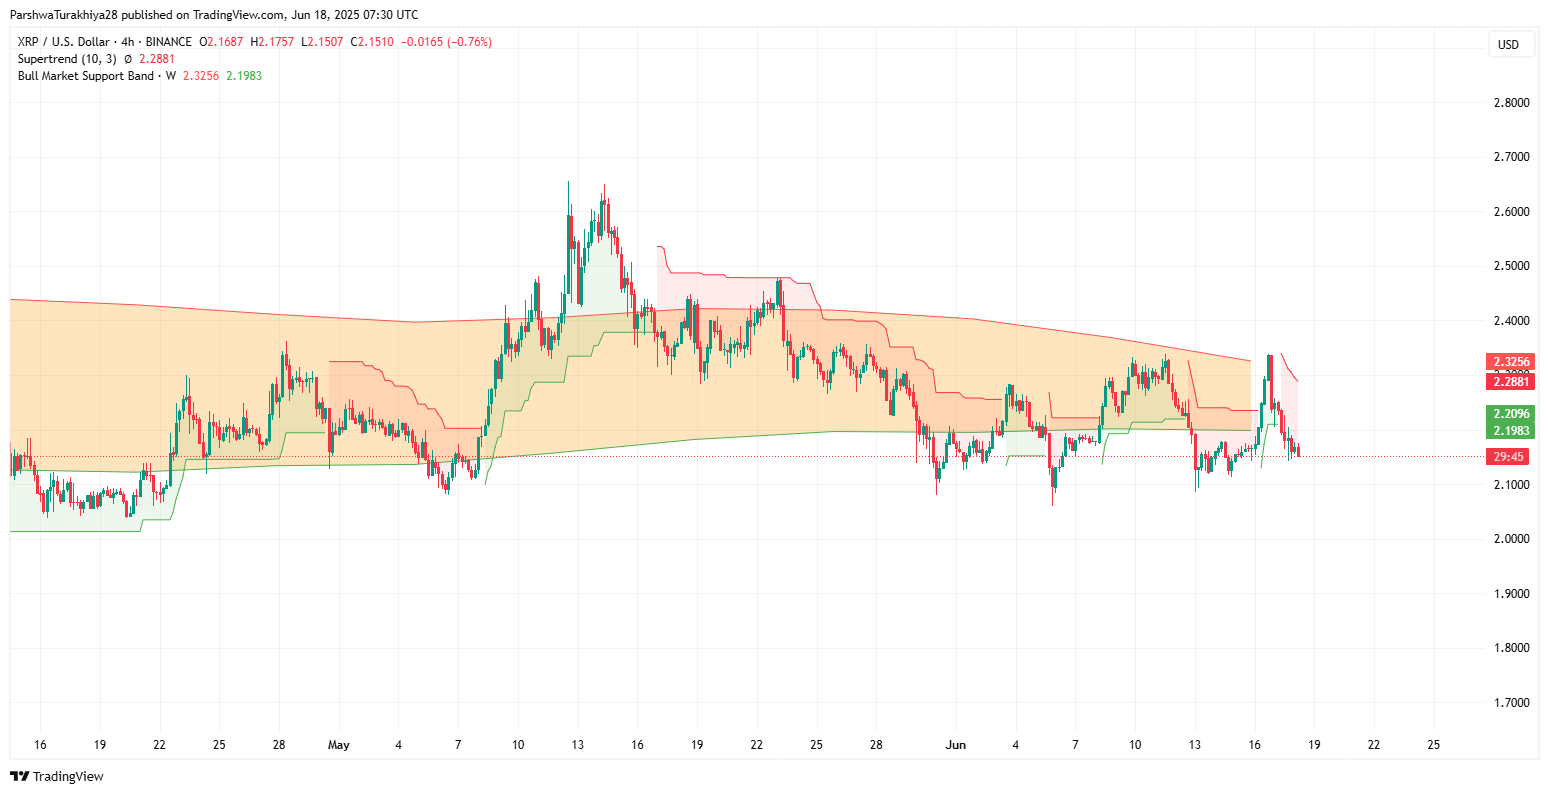
The Supertrend indicator on the 4-hour timeframe has flipped bearish. XRP is trading below the trend flip level at $2.20, confirming the downside bias for the session. Unless price can close above $2.2096 with volume, the bearish Supertrend signal is likely to remain dominant.
From a higher timeframe perspective, the Bull Market Support Band has rolled over. The 1-week band shows resistance at $2.32–$2.33, with the lower bound near $2.19 now acting as a trend decision point. XRP remains below this band, indicating that bulls must reclaim this zone to re-establish macro momentum.
XRP Short-Term Forecast: Bearish Bias Below $2.19
If XRP loses the $2.10–$2.105 strong low zone, the next leg lower could target $2.037 (daily inefficiency) or even $2.00 psychological support. On the upside, reclaiming $2.1933 (mid-POC resistance) could bring a recovery push toward $2.25–$2.28. But given current bearish volume profile and indicator alignment, sellers retain near-term control.
XRP Price: Technical Forecast Summary
| Indicator/Level | Signal/Value |
| XRP Price Today | $2.15 |
| Resistance Levels | $2.19 / $2.25 / $2.34 |
| Support Levels | $2.105 / $2.037 / $2.00 |
| EMAs (20/50/100) | Bearishly aligned |
| Parabolic SAR | Bearish (above price) |
| VWAP | Resistance at $2.16–$2.19 |
| MFI (14) | 16.8 (oversold) |
| DMI ADX | Rising, -DI leads |
| TSL (14) | -0.37 (slightly recovering) |
| ChandeMO | -22.4 (bearish momentum) |
| Volume Profile POC | $2.19 |
| Supertrend (4H) | Bearish under $2.20 |
| Smart Money Zones | BOS at $2.105 / CHoCH near $2.32 |
Disclaimer: The information presented in this article is for informational and educational purposes only. The article does not constitute financial advice or advice of any kind. Coin Edition is not responsible for any losses incurred as a result of the utilization of content, products, or services mentioned. Readers are advised to exercise caution before taking any action related to the company.


