
- XRP consolidates between $2.34–$2.54, facing resistance near key EMAs and Fib levels.
- Rising futures open interest shows heightened speculative activity despite price weakness.
- Persistent spot outflows indicate muted accumulation, limiting upward price pressure.
XRP’s short-term market structure reflects growing uncertainty as traders assess price compression near critical technical levels. The token trades close to $2.38, slightly down by 1.1%, after repeated attempts to break above the $2.50 zone.
The price remains capped beneath major exponential moving averages and Fibonacci retracement levels, suggesting a cautious bias. Despite brief rebounds in recent sessions, momentum indicators reveal subdued conviction among both buyers and sellers.
Technical Picture Suggests Sideways Movement
The XRP/USD 4-hour chart shows that price action has been consolidating between $2.34 and $2.54 for several days. The 50-EMA, currently near $2.43, acts as immediate resistance, while the 100-EMA and 200-EMA at $2.45 and $2.67 respectively form stronger barriers above.
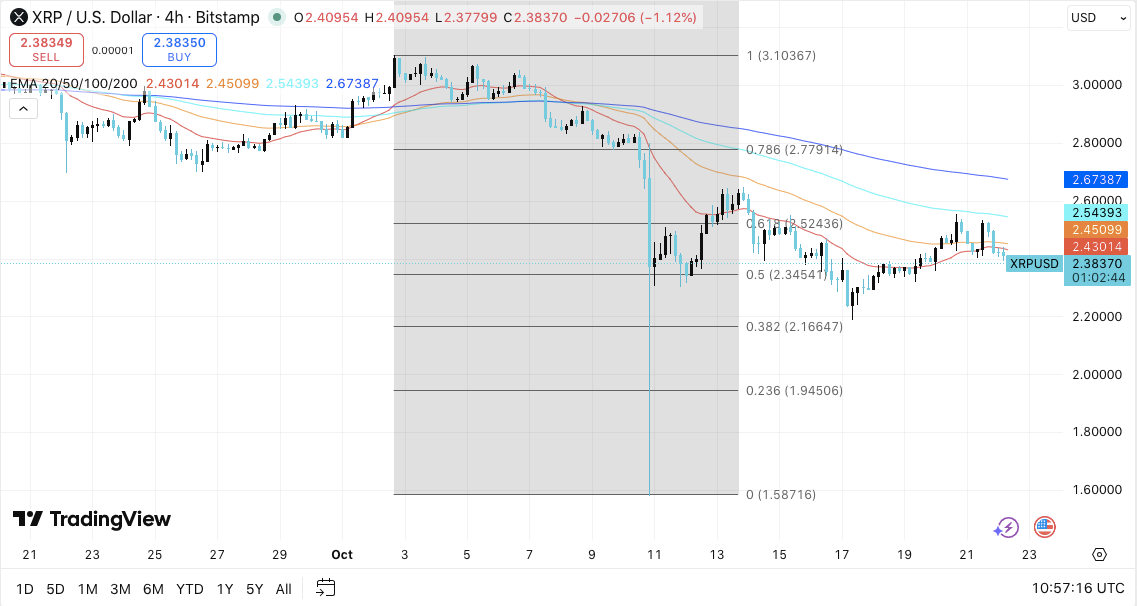
Immediate support rests at the 0.5 Fibonacci retracement level of $2.345. A breakdown below this level could trigger a decline toward $2.16 and possibly $1.94. Conversely, a move above $2.52, which aligns with the 0.618 Fib zone, may push prices toward $2.77 and the $3.10 swing high.
Related: Shiba Inu Price Prediction: Holders Rise But SHIB Struggles To Defend Support
The broader structure indicates that XRP is recovering from a previous retracement between $3.10 and $1.58. Recent higher lows hint at potential accumulation, but buyers must reclaim the $2.52–$2.67 region to confirm any trend reversal. Until then, price action is expected to remain range-bound between $2.30 and $2.60.
Derivatives Data Reflects Speculative Activity
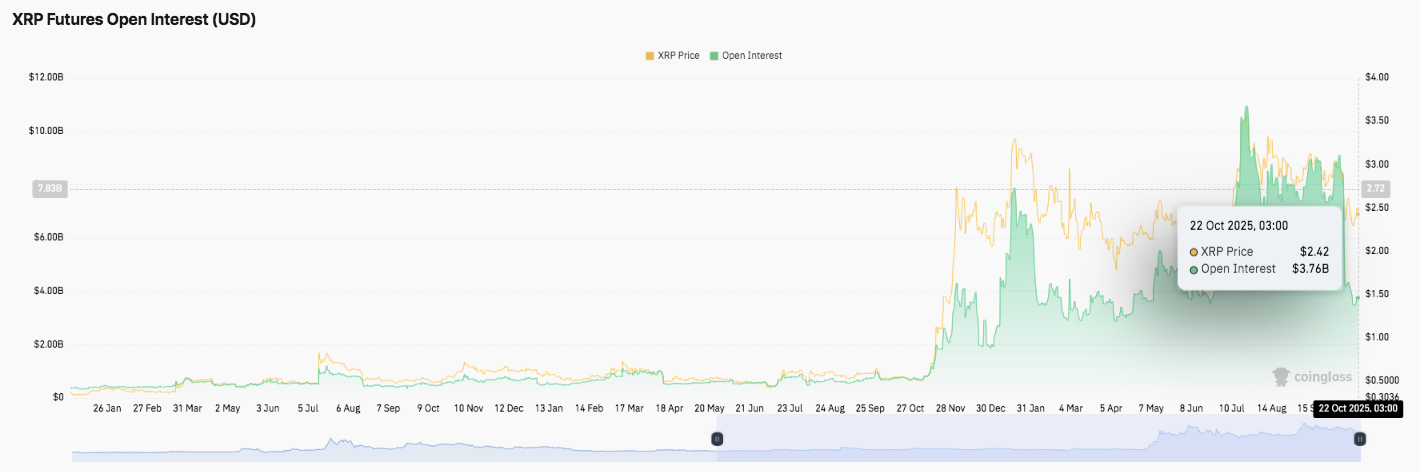
Open interest in XRP futures has climbed significantly since early 2025, reflecting renewed trader engagement. After months of stagnation below $2 billion, open interest surged past $10 billion in April as prices neared $3.50.
The most recent data shows open interest at $3.76 billion, with prices near $2.42. This indicates ongoing participation even amid declining prices. The strong correlation between rising open interest and price volatility highlights increased speculative positioning within the derivatives market.
Spot Flows Indicate Persistent Outflows
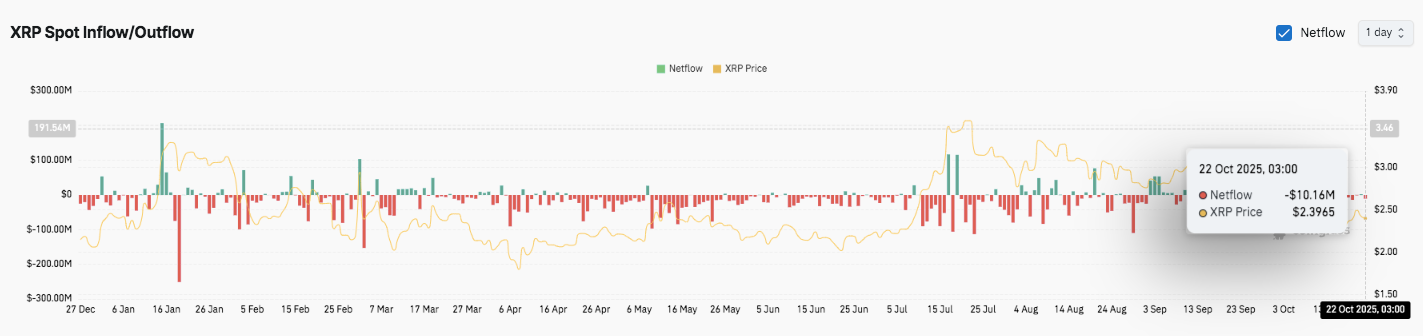
Spot netflows continue to show dominant outflows through most of 2025. The latest data recorded a $10.16 million outflow on October 22, signaling consistent profit-taking. Although brief inflows occurred midyear, overall capital movement remains negative, implying reduced accumulation and muted upward pressure.
Related: Ethereum Price Prediction: ETF Flows Support ETH But CPI Risk Keeps Traders Cautious
Ripple’s Expanding Institutional Role
Beyond market movements, Ripple has secured a position on the Federal Reserve’s Faster Payments Task Force Steering Committee. This development enhances its influence in shaping future U.S. payment infrastructure.
The move underscores Ripple’s growing recognition as a key player bridging traditional finance and blockchain-based settlement systems.
Technical Outlook for XRP Price
Key levels remain clearly defined as XRP enters a consolidation phase around $2.38. The short-term bias remains neutral, with traders closely watching whether bulls can regain momentum above critical resistance zones.
- Upside Levels: Immediate hurdles stand at $2.43 (50-EMA) and $2.52 (Fib 0.618), followed by $2.67 (200-EMA). A breakout beyond $2.67 could open the path toward $2.77 (Fib 0.786) and $3.10, the previous swing high.
- Downside Levels: Key support rests at $2.34 (Fib 0.5), followed by $2.16 (Fib 0.382) and $1.94 (Fib 0.236). A decisive close below $2.30 may signal renewed selling pressure toward these lower levels.
- Resistance Ceiling: The $2.52–$2.67 region remains the key reversal zone. Clearing this cluster would confirm bullish momentum and potentially mark the start of a new uptrend.
The technical structure shows XRP consolidating inside a tightening range between $2.30 and $2.60, where volatility is likely to expand once a breakout occurs. Momentum indicators, including flattening EMAs and steady open interest, suggest indecision among traders.
Will XRP Break Out or Break Down?
XRP’s near-term direction depends on its ability to defend the $2.34–$2.30 support area. Sustained buying near this zone could trigger a relief rally toward $2.77 and $3.10. However, failure to hold above $2.30 may expose the price to a deeper pullback toward $2.16.
Related: Bitcoin Price Prediction: BTC Consolidates as Traders Await Breakout Signal
For now, XRP remains range-bound, with the $2.52 level serving as the pivotal line separating bullish breakout potential from extended consolidation. Strengthening inflows and Ripple’s growing regulatory presence could act as catalysts for the next major move.
Disclaimer: The information presented in this article is for informational and educational purposes only. The article does not constitute financial advice or advice of any kind. Coin Edition is not responsible for any losses incurred as a result of the utilization of content, products, or services mentioned. Readers are advised to exercise caution before taking any action related to the company.


