![]XRP Price Analysis: Why XRP Is Trading Under $1000 Despite Community Hype](https://coinedition.com/wp-content/uploads/2025/11/6-XRP-XRP-Price-Prediction-May-2025-1-4.jpg "XRP Price Prediction: XRP Faces Tight Range as Outflows Rise and Leverage Drops")
- XRP hovers near $2.28, testing mid-range Fibonacci levels for short-term stability.
- Cooling momentum shows weaker bullish pressure as EMA and Bollinger Bands align.
- Heavy spot outflows and declining futures interest indicate ongoing distribution phase.
XRP trades near $2.28 as the market focuses on short-term stability after several failed recovery attempts. The token sits in the middle of its recent 4H structure and continues to react to shifting liquidity conditions across spot and derivatives markets.
The latest pullback from the $2.50 region signals slowing momentum, yet the broader setup still depends on how XRP behaves around the mid-range Fibonacci levels.
Key Fibonacci Zones Shape the Immediate Trading Range
The $3.10 to $1.58 swing range still defines the important retracement zones. XRP trades slightly above the 0.5 Fib level at $2.35, and this level now anchors the short-term outlook. A clean defense of this region supports a possible recovery attempt. However, losing this level exposes the 0.382 Fib near $2.16, which acted as strong demand earlier in November.
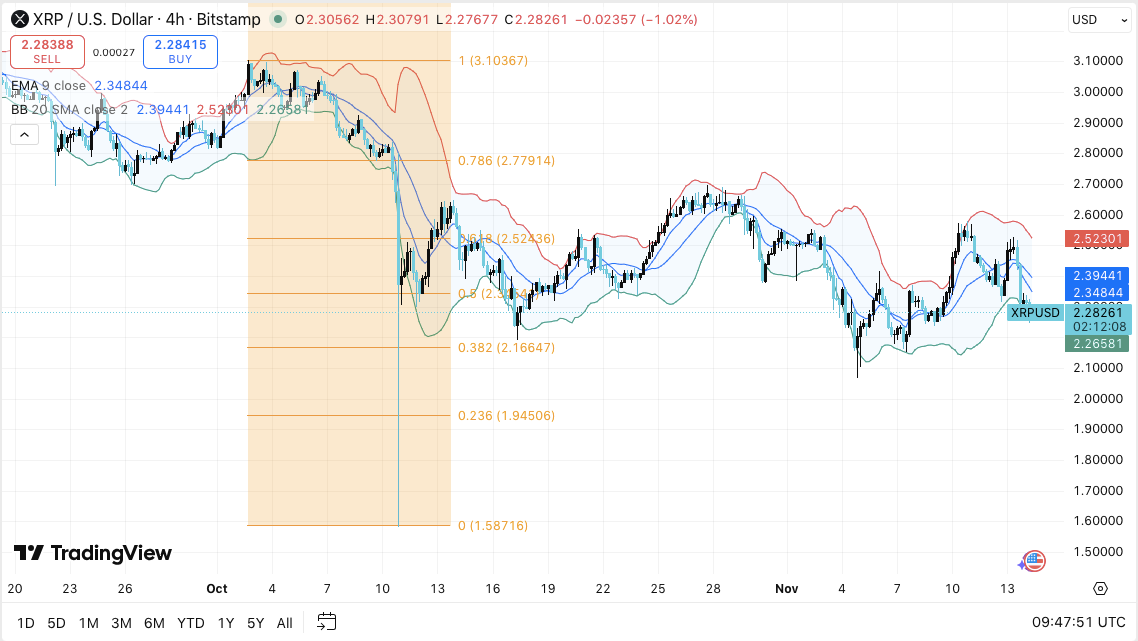
Additionally, the 0.618 Fib zone between $2.52 and $2.53 remains the most important upside barrier. XRP rejected this area several times, and traders consider it the structure breaker for any new uptrend.
The 0.786 Fib near $2.77 stands as the final resistance before revisiting the upper range. Consequently, XRP needs sustained momentum to challenge these areas again.
Related: XRP Breakout Targets $3.10 As Canary’s XRPC Posts A $58 Million Record Debut
Momentum Indicators Signal Cooling Pressure
Short-term volatility expanded after a recent squeeze, and price moved lower from the upper Bollinger Band. This shift shows weaker bullish pressure. Moreover, XRP trades under the EMA 9 and EMA 20, and this alignment confirms a softer trend.
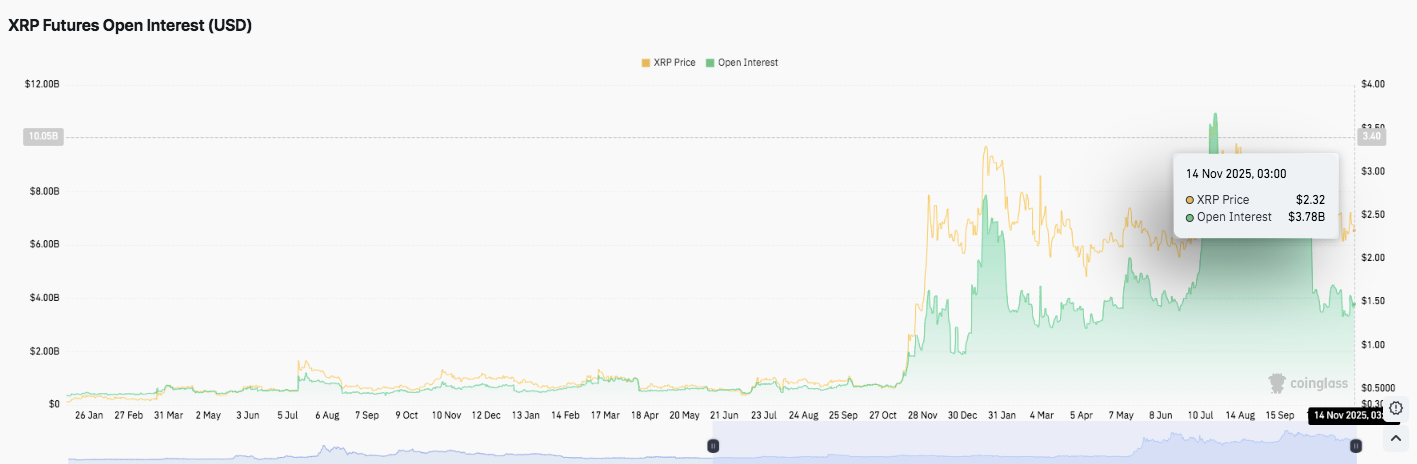
Derivatives data supports this view. Futures open interest dropped from above $6 billion to around $3.78 billion. This retreat reflects reduced leverage and a more cautious stance among traders. However, open interest still sits above levels seen earlier this year, which signals continued engagement.
Exchange Outflows Reinforce a Distribution Phase
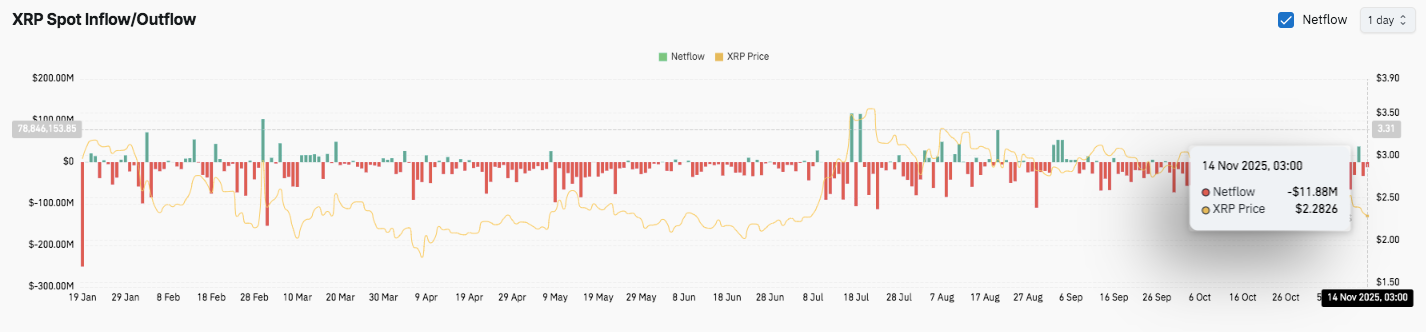
Spot flows reveal heavy outflows across most sessions. The pattern intensified between March and July and continued into mid-November. On November 14, XRP recorded another $11.88 million net outflow as price traded near $2.28. Additionally, consistent withdrawals point to a wider distribution phase and reduced exchange supply.
Related: XRP Price Prediction. Ripple’s $2.3B Expansion Sparks Breakout Hopes Above 200 EMA
Technical Outlook for XRP Price
XRP trades inside a compressed structure where upside and downside levels remain clearly defined. The market shows reduced momentum while price holds within a narrowing range. The next move depends on how price reacts around nearby demand and resistance zones.
- Upside levels: $2.42, $2.55, and $2.68 stand as immediate hurdles. A clean breakout above these levels could open a path toward $2.84 and $3.02.
- Downside levels: Trendline support sits near $2.18. The next layers appear at $2.05 and $1.92. These levels form the main defensive zones for short-term structure.
- Resistance ceiling: The 200-day EMA near $2.61 remains the key level to flip for medium-term bullish momentum. Price has struggled here throughout the recent consolidation.
The technical picture shows XRP compressing inside a contracting structure, which resembles a symmetrical wedge. This pattern typically forms before volatility expands. Moreover, the tightening candles show declining range, which reinforces the expectation for a stronger directional push.
Will XRP Move Higher?
XRP’s near-term direction depends on its ability to hold the $2.18 support zone. Buyers need to defend this region long enough to challenge the $2.55–$2.61 barrier. A decisive close above this cluster confirms renewed bullish momentum and supports a move toward $2.84 and $3.02.
Historical price behavior during similar compression phases suggests increased volatility ahead. Additionally, improving inflows or stronger market sentiment could help XRP overcome its mid-range ceiling.
However, losing $2.18 would break the wedge structure and expose the asset to deeper retracements at $2.05 and $1.92. That scenario places XRP back into its earlier accumulation zone.
For now, XRP sits in a pivotal position. Traders watch how price behaves around the $2.55–$2.61 region and whether buyers can reclaim broader control. The next trend shift will likely come from this cluster or from a breakdown through support.
Disclaimer: The information presented in this article is for informational and educational purposes only. The article does not constitute financial advice or advice of any kind. Coin Edition is not responsible for any losses incurred as a result of the utilization of content, products, or services mentioned. Readers are advised to exercise caution before taking any action related to the company.


