
- Ali Martinez highlighted XRP forming a striking symmetrical triangle chart with a target of $15.
- XRP is currently attempting to flip the $2.75 price level into support before moving higher.
- Bloomberg analyst said that the SEC could acknowledge the Grayscale 19b-4 for a spot XRP ETF.
Crypto market players suddenly turned their eyes to XRP after top crypto analyst Ali Martinez dropped a chart that has got everyone talking – a striking symmetrical triangle chart, hinting at a potential target to $15. And if the technical pattern really were to play out, XRP could be right on the verge of a huge rally.
Martinez put out a chart showing a breakout from a long-term symmetrical triangle, Every time this pattern has shown up before, it’s brought on huge price surges.
With XRP currently trading at $2.44, the coin is attempting to flip $2.75 (Fibonacci 1 level in the chart below) into support before advancing higher.
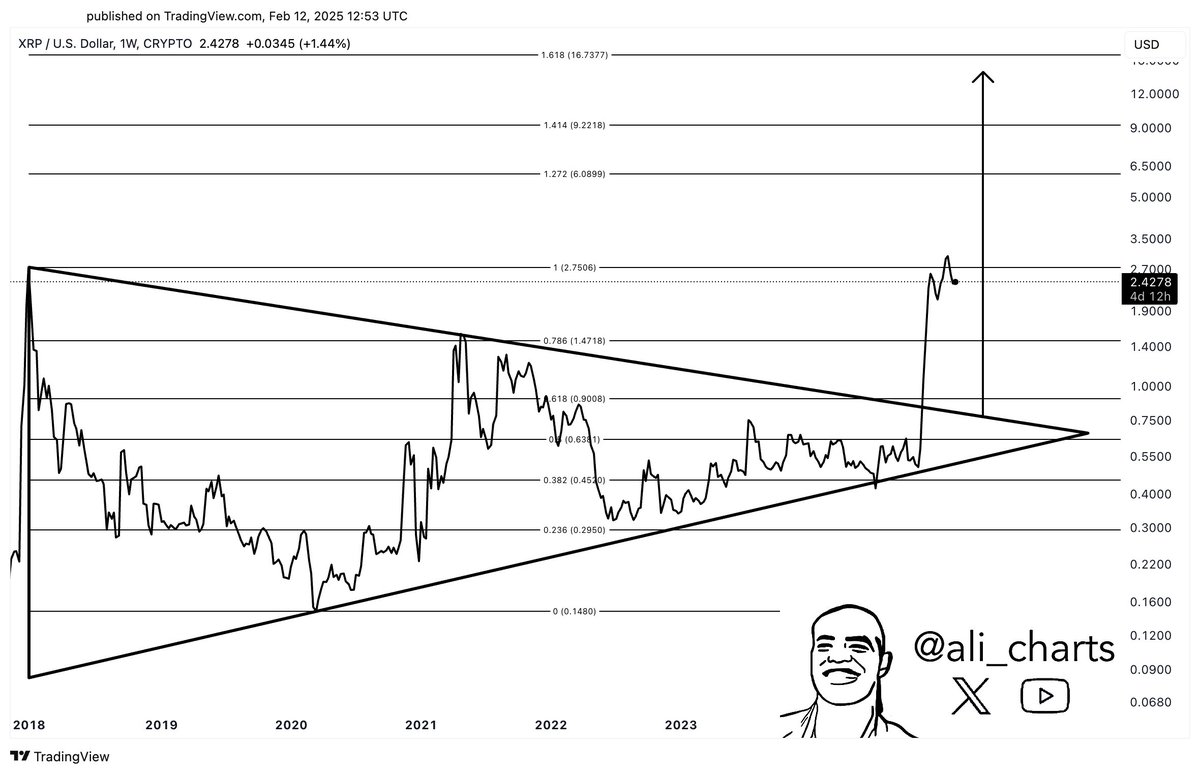
XRP to $15 if Chart “Checks Out”?
If the breakout actually happens, the Fibonacci extension tool points to a price target of $15, a potential 515% jump from where it is now.
Whether this projection materializes may depend in part on the SEC approving a spot XRP exchange-traded fund (ETF).
Related: Is the Ripple Lawsuit Set for a Breakthrough After SEC and Binance Agree to Pause Suit?
XRP ETF Approval – Potential Catalyst for Price Surge
Adding to market speculation, Bloomberg analyst James Seyffart reported an increased probability of the SEC acknowledging Grayscale’s 19b-4 filing for a spot XRP ETF on February 13th.
Approval in this area could lead to substantial institutional inflow, potentially fueling a significant rally. Such an approval would enable investors to gain exposure to the XRP token without directly managing the digital asset in a crypto wallet.
Related: Altcoin Comeback? “Golden Cross” Signal Points to Potential Surge – Top 4 Picks
XRP Price Analysis – Technical Indicators
Examining the XRP price analysis, as shown in the chart from TradingView below, XRP is currently in a downward trend after a sharp rise in late 2024.
The 20-day EMA is positioned at $2.59, while XRP is currently below it at $2.44. Should the altcoin reclaim this 20-day EMA, a bullish rally could become more likely for the digital asset.
Mixed Signals – RSI and Bollinger Bands Analyzed
Analyzing technical indicators further, the Relative Strength Index (RSI) registers a value of 40.34, suggesting momentum is neutral to slightly bearish. While a move above 50 would indicate increasing bullish strength, the gradient of the line indicates ongoing pressure from sellers.
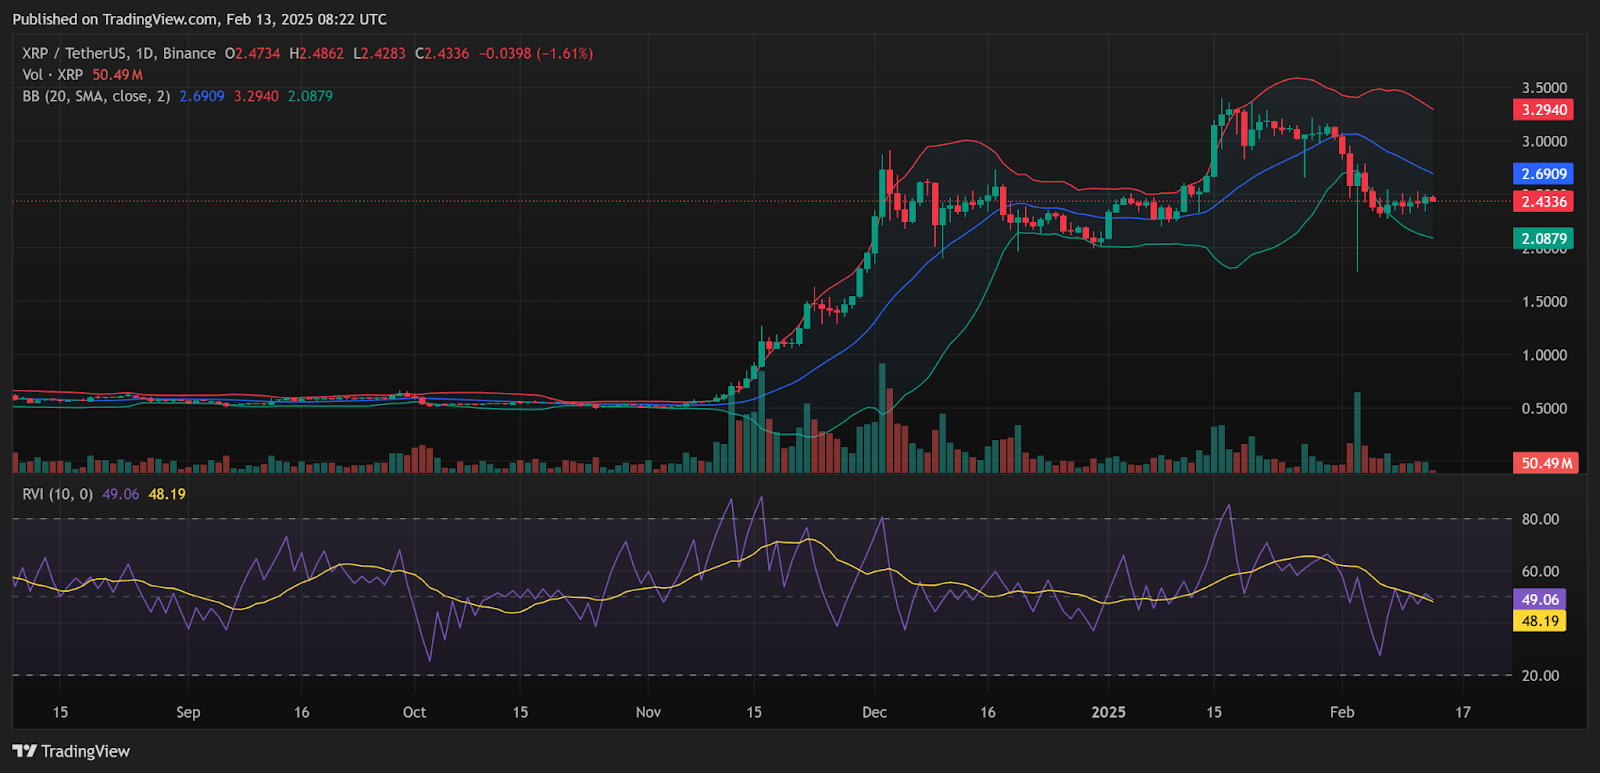
Reviewing the Bollinger Bands, they indicate tightening volatility, which often suggests a notable price movement may be imminent. The XRP price action is currently situated in the bearish region of the Bands.
However, the Accumulation/Distribution line also indicates increasing buying activity, pointing towards underlying buying pressure despite the pullback.
Disclaimer: The information presented in this article is for informational and educational purposes only. The article does not constitute financial advice or advice of any kind. Coin Edition is not responsible for any losses incurred as a result of the utilization of content, products, or services mentioned. Readers are advised to exercise caution before taking any action related to the company.


