
- XRP trades at $1.32 after a 4.57% monthly drop, with lower highs and weak volume indicating reduced activity.
- The long-term chart shows a 9-year triangle with key support projected between $0.75 and $1.35.
- Liquidations reach $1.16M, led by longs as momentum indicators show cooling after the recent peak.
XRP continues to trade within a fixed structure as analysts monitor both short-term weakness and a broader multi-year pattern controlling its trend. At the time of writing, XRP was trading at $1.32, marking a 4.57% decline over the past month after reaching a mid-March high near $1.60.
The pullback has followed a sequence of lower highs and declines, with price stabilizing around $1.40, then falling to $1.28 and recovering slightly. This movement has occurred alongside a 0.57% drop in market capitalization to $81.41 billion and a 9.57% decline in 24-hour trading volume to $1.78 billion, pointing to reduced market activity during the period.
Analysts Identify Long-Term Triangle Formation
According to data shared by Ali Charts, a crypto analyst, a long-term ascending triangle has developed over roughly nine years on the monthly timeframe. The structure is defined by repeated rejections near a horizontal resistance level around $3.30, while a rising trendline continues to form higher lows from earlier cycles.
Following the recent rejection in August 2025, the chart projects a possible retracement toward the ascending support zone. This area is estimated between $0.75 and $1.35, aligning with the broader trendline that has held across multiple phases.
Additional levels highlighted on the chart include historical support near $0.16 and a long-term projection extending toward $8.50, reflecting the full range of the pattern.
In addition, according to a separate chart shared by Aynur, XRP’s price behavior consists of a series of repeating cycles from 2018 to 2026. Each phase has been characterized by an upward move followed by extended consolidation. In the earlier cycle, XRP rose above $3.50 before declining and stabilizing below $1.00 through 2019 and 2020.
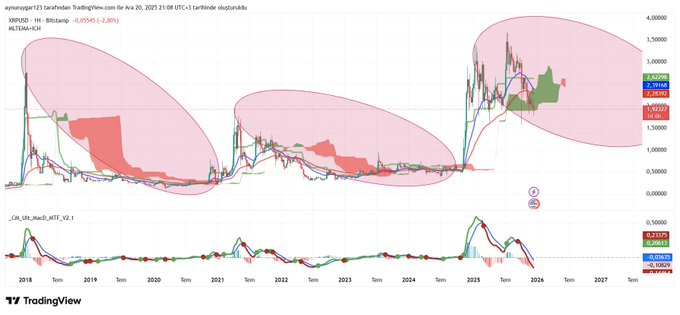
Source: X
A similar structure appeared in the following cycle, where price advanced again before trading between $0.30 and $1.00 during 2022 to 2024. In the recent phase, XRP climbed to approximately $3.27–$3.30 before entering consolidation. The chart places current levels near $2.62 on the broader scale, with nearby support identified around $1.92. Momentum indicators have eased to around 0.2317 and -0.1089, indicating reduced strength following the latest peak.
Market Data Signals Cooling Momentum and Liquidation Pressure
Alongside the structural patterns, market data indicate slowing momentum. Over the past 24 hours, total liquidations reached $1.16 million, with long positions accounting for $790.81K compared to $365.59K in short liquidations.
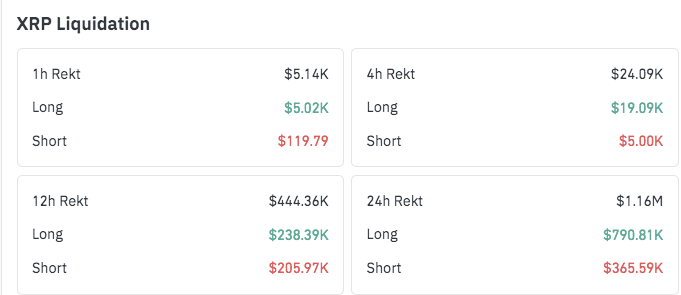
Source: Coinglass
This distribution shows that bullish positions took in a larger share of losses during recent price movements. Shorter timeframes show declining activity, with $444.36K in liquidations over 12 hours and $24.09K over four hours. In the recent hour, liquidations totaled $5.14K, with long positions accounting for $5.02K, pointing to continued short-term downside pressure.
Related: XRP Price Prediction: XRP Stalls Below $1.38 SAR As 7-Year Triangle Points To $225
Disclaimer: The information presented in this article is for informational and educational purposes only. The article does not constitute financial advice or advice of any kind. Coin Edition is not responsible for any losses incurred as a result of the utilization of content, products, or services mentioned. Readers are advised to exercise caution before taking any action related to the company.


