
- Amonyx forecasts a bullish trajectory for XRP in 2024.
- XRP may experience significant price increases against USD and BTC.
- Key Fibonacci levels could indicate future XRP price movements.
Cryptocurrency analysis firm Amonyx recently published a technical assessment of XRP’s price movements, projecting a potential bullish trajectory for the digital asset against both the U.S. dollar (USD) and Bitcoin (BTC) in the coming year.
The XRP price is $0.493150, with a 24-hour trading volume of $1,488,637,482. XRP has decreased by 1.24% in the last 24 hours, holding a market cap of $27,404,550,064. The circulating supply is 55,570,463,728 XRP coins, with a maximum supply of 100 billion XRP coins.
The XRP/USD chart displays a long-term ascending channel that has been in place since 2014. This trend suggests XRP has consistently oscillated within its upper and lower parallel lines. Key Fibonacci retracement levels such as 0.618, 0.786, 1.618, and 2.618 are highlighted, serving as crucial predictors in identifying future resistance and support points. Key historical price levels are also important markers for potential reversals or consolidations.
Additionally, the chart suggests a future projection, indicating a potential bullish movement toward the 2.618 Fibonacci level. This forecast hints at a substantial price increase, with a possible peak in around 2024. The “flip zone” marked at the top right indicates a likely area for price consolidation or reversal.
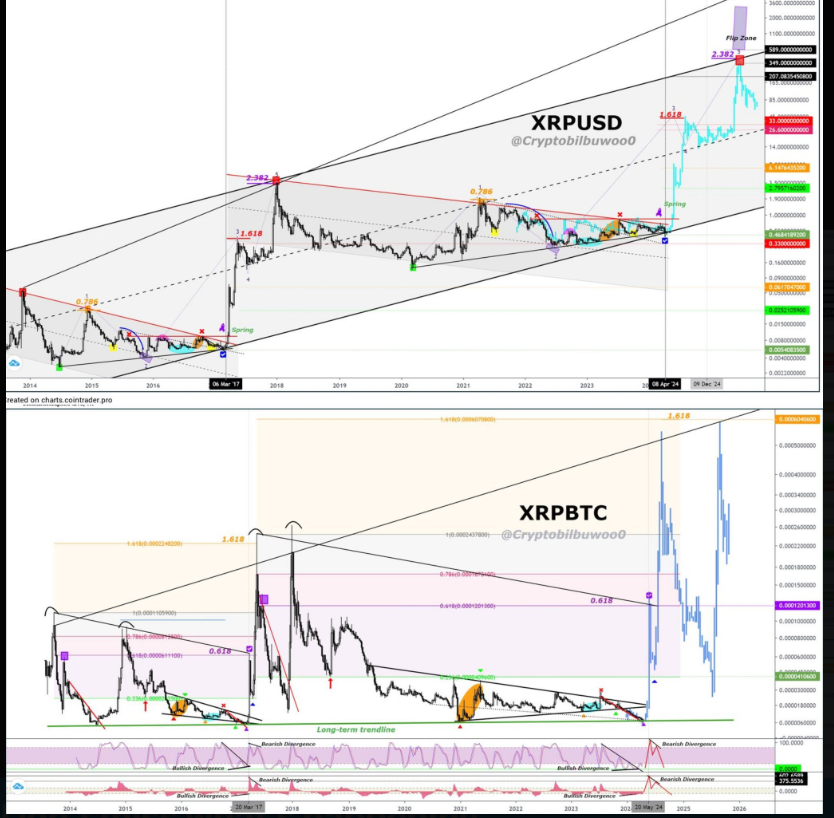
Source: Amonyx
The XRP/BTC chart analysis reveals a long-term descending trendline established from 2014. The price has repeatedly tested this trendline and is currently approaching it. Moreover, bullish and bearish divergences are visible, particularly in the RSI or other momentum indicators.
These divergences hint at potential reversals or continuation patterns in price movements. Key Fibonacci levels, especially the 0.618 and 1.618 levels, are prominently marked, suggesting critical points for future price action.
The blue projected path on the XRP/BTC chart indicates a potential bullish trend towards the 1.618 Fibonacci level. This projection aligns with the XRP/USD analysis, suggesting significant value increases relative to BTC by around 2024.
Disclaimer: The information presented in this article is for informational and educational purposes only. The article does not constitute financial advice or advice of any kind. Coin Edition is not responsible for any losses incurred as a result of the utilization of content, products, or services mentioned. Readers are advised to exercise caution before taking any action related to the company.
 Price Prediction: ZBCN Jumps 21% After Breakout as Bulls Eye $0.003")
 Price Prediction: Can QNT Break $80 After Extended Rally?")
 Price Prediction: FET Climbs 26%—Is a Break Above $0.23 Sustainable?")

