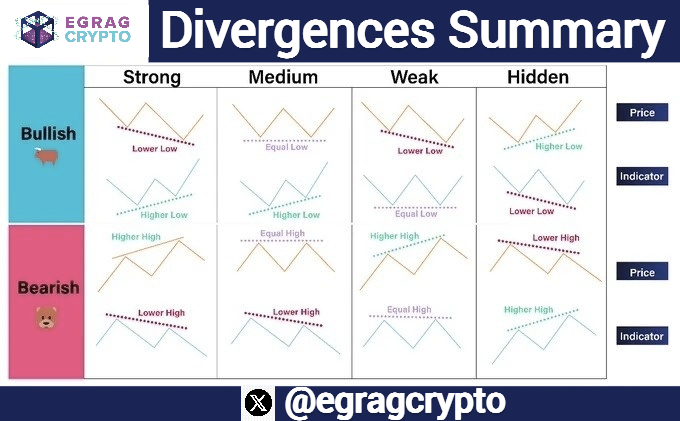
- Crypto analyst identified a “strong bullish divergence” on XRP’s 3-day chart.
- The price is making lower lows while indicators make higher lows, a classic reversal signal.
- XRP trades at $2.14 with volume down 35%, suggesting seller exhaustion.
XRP is flashing a major technical signal despite its recent price decline after crypto analyst Egrag Crypto identified a “bullish divergence” on the asset’s 3-day timeframe. This pattern emerges when a token trades lower, suggesting a potential reversal’ building.
Egrag states that the divergence is among the key signals seen on XRP in recent months, emerging as the asset tests a major support region. At the same time, momentum indicators reach historically low readings.
Related: XRP Price Ignores Franklin Templeton’s XRP ETF Debut, Slips Below Key Support
Why the ‘3-Day Divergence’ Signals XRP Bullish Reversal
The chart analysis outlines four different divergence categories, strong, medium, weak, and hidden, explaining how price behavior interacts with indicators such as RSI and MACD.
Within this context, the current 3-Day setup places XRP in a strong bullish divergence zone, where price records lower lows while indicators form higher lows. This behavior is typically tracked for possible upside reversals.

Additional technical observations note that XRP’s broader weekly structure continues to compress toward a long-standing support band. Recent weekly candles show a downtrend forming what analysts identify as a descending wedge. According to the shared chart, this area has become a decisive point for trend confirmation.
Oversold Indicators: Stoch RSI and Ultimate Oscillator
Multiple indicators have moved into oversold territory. The Stochastic RSI has touched its lower limit, suggesting weakened short-term momentum. The Ultimate Oscillator has fallen below the 20 mark, a level considered indicative of reduced buying strength. Chart captions state that a rebound from these positions would be an early sign of stabilizing demand.
However, three upside reference zones, labeled F, V, and G, remain on watch as possible recovery levels if a confirmed bounce develops. These targets align with previous losses and fair value gaps left on higher-timeframe candles.

Despite this, XRP has seen a decline in its market value, with the coin trading at $2.14, representing a 1.76% decrease. Market capitalization stands at $129.11 billion. Additionally, the trading volume has decreased by 35.33% to $4.72 billion, indicating a decline in recent activity.
Related: XRP Price Prediction: Bears Tighten Grip As XRP Struggles To Break $2.30
Disclaimer: The information presented in this article is for informational and educational purposes only. The article does not constitute financial advice or advice of any kind. Coin Edition is not responsible for any losses incurred as a result of the utilization of content, products, or services mentioned. Readers are advised to exercise caution before taking any action related to the company.


