
- XRP is stabilizing as liquidity rises and support near $2 strengthens across exchanges.
- On-chain data shows activity cooling after prior overheating during late-2024 price peaks.
- Order-flow signals improving sentiment, with defended bids and early positive skew forming.
XRP is entering a period marked by intensifying activity across trading venues, rising liquidity, and technical formations that analysts say could determine whether the asset establishes a short-term floor or faces another downturn into year-end.
Market data indicate that the token is stabilizing around key support levels, while order-flow behavior, spot-volume patterns, and exchange-side liquidity signals are beginning to align for the first time in several weeks.
These developments emerge as XRP rebounds, extending a 9.4% daily gain that pushed its price to $2.19 and lifted market capitalization to $132 billion. The increase in activity coincides with an 18.4% rise in 24-hour trading volume to nearly $4.8 billion, reflecting stronger engagement following a period of muted movement.
Related: Will XRP Turn Bullish or Bearish This Month? Here’s What History Says
On-Chain Volume Patterns Show a Cooling Phase After Prior Overheating
Data from CryptoQuant’s XRP Ledger Spot Volume Bubble Map indicates that recent market behavior is moving from an inflated phase toward declining conditions. The model shows extended groups of elevated activity between late 2024 and early 2025, a span that aligned with price moves above $1 and advances beyond $2.
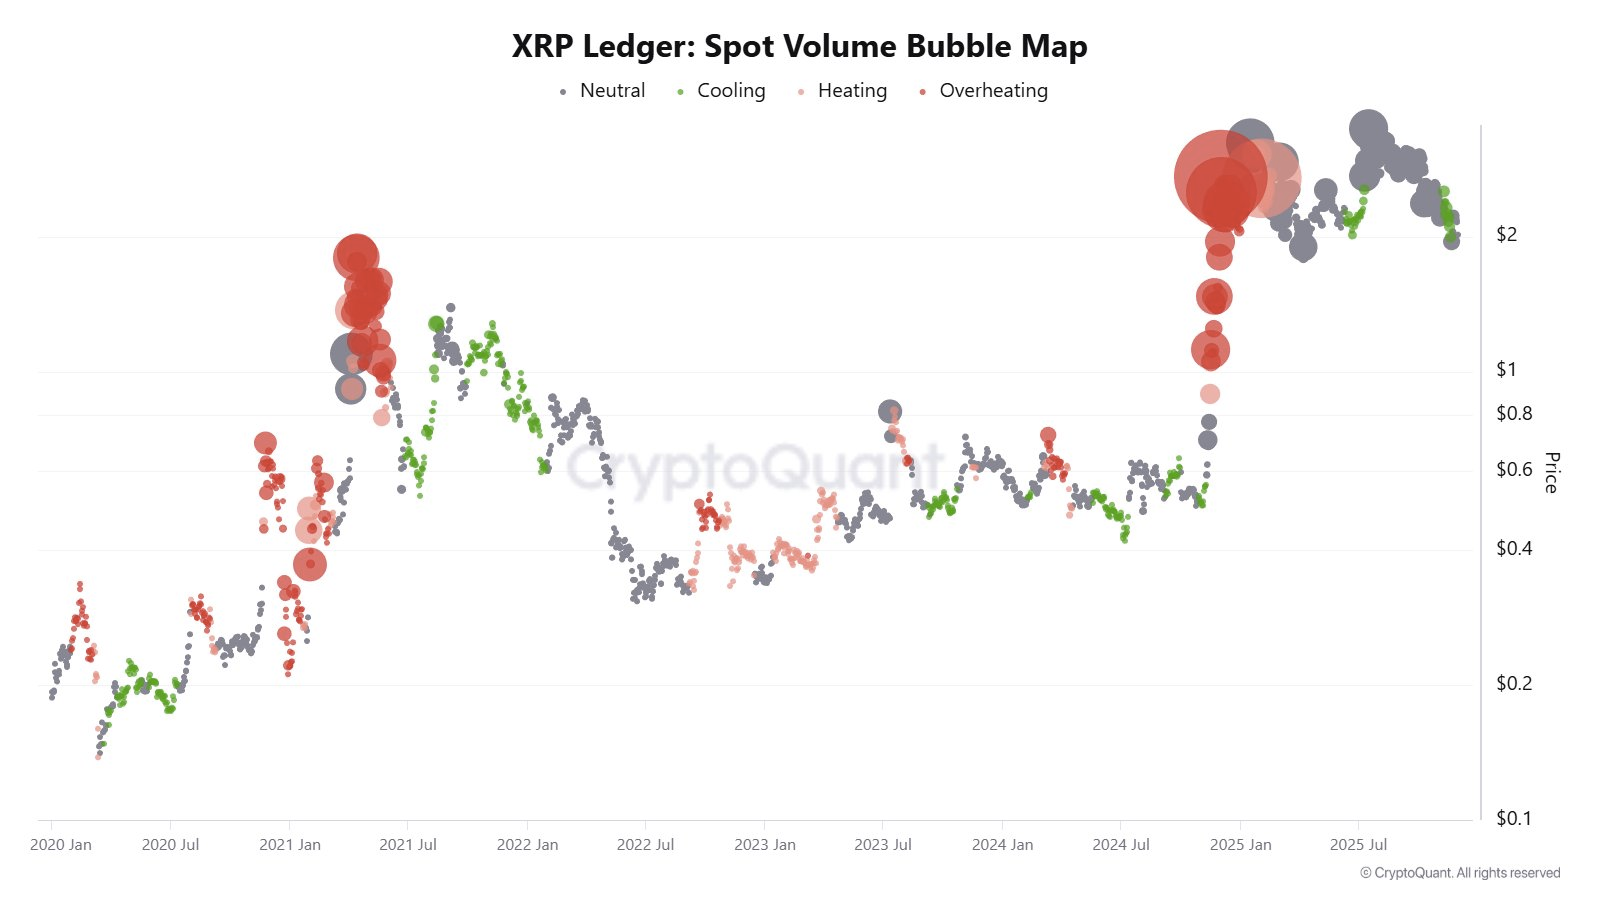
Analysts tracking the chart note that previous red-zone clusters in 2021 appeared ahead of directional shifts. The current declining signals a contrast, as green and grey markers dominated much of 2022 and 2023 before activity intensified again during mid-2024.
Order-Flow and Exchange Heatmaps Indicate Defended Support Levels
Trading behavior on Binance and Coinbase indicates that rounded lows are forming near the $2.00 zone, a level that has repeatedly served as structural support throughout November. Heatmaps display concentrated liquidity regions below spot price ranges, indicating that market participants continue to defend bids.
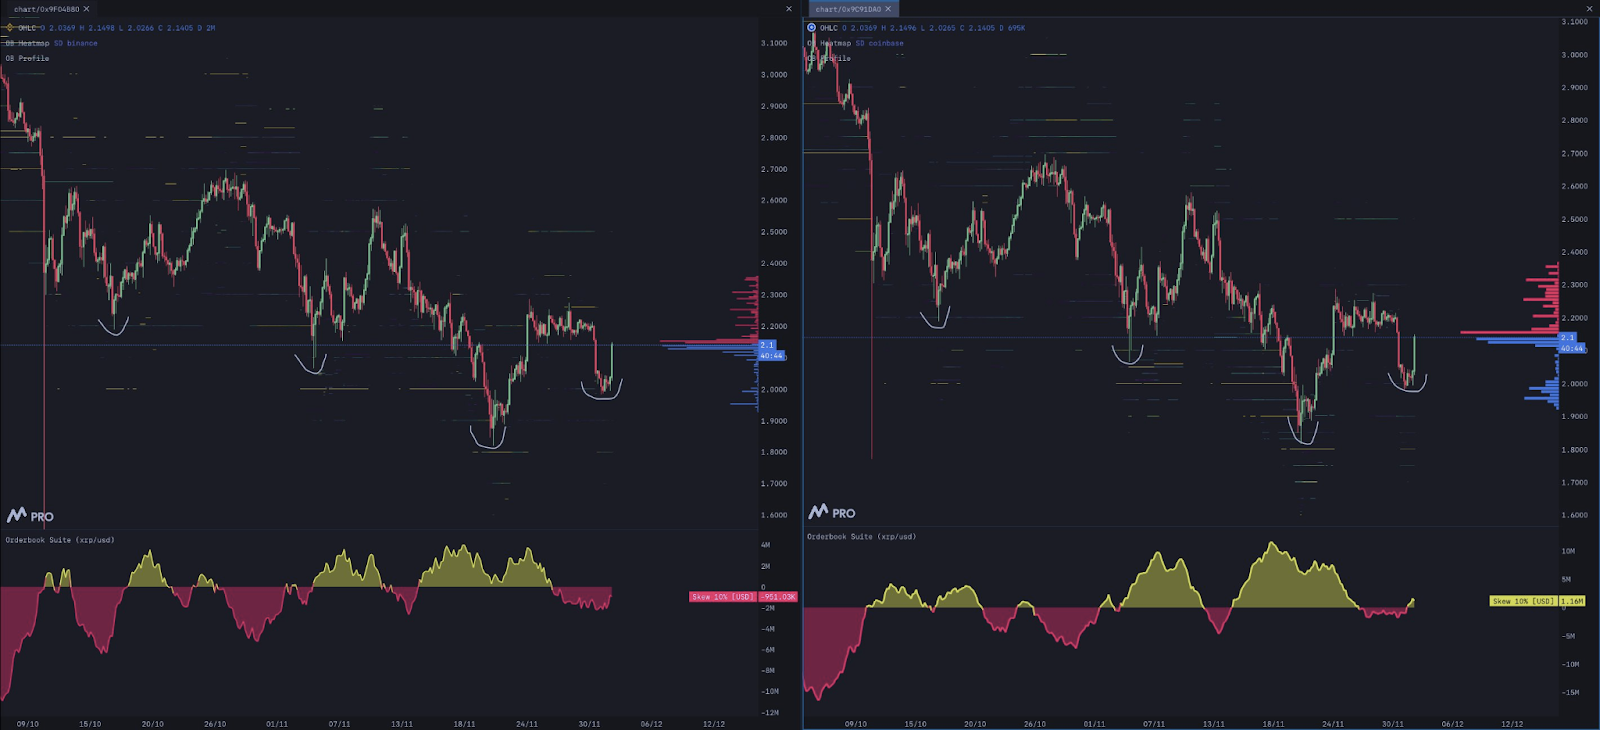
In addition, the order-book skew is beginning to shift as selling tapers, most noticeably on Coinbase, where positive skew has started to appear. Volume-profile data shows dense activity between $1.95 and $2.15, reinforcing the significance of the support cluster.
Related: Who Is Buying the XRP Dip? ‘Mega Whales’ Hit 7-Year Record Holdings
Disclaimer: The information presented in this article is for informational and educational purposes only. The article does not constitute financial advice or advice of any kind. Coin Edition is not responsible for any losses incurred as a result of the utilization of content, products, or services mentioned. Readers are advised to exercise caution before taking any action related to the company.


