


- XRP performs at a mediocre level, with ups and downs here and there.
- XRP recovers every crash with a spike of more than 10%, suggesting another spike.
- Bollinger bands could shrink, and the market volatility could reduce.
XRP has been performing at a mediocre level considering its price fluctuations during the past seven days. It had its moments of increase and its swing lows. However, although the climb was hard, XRP’s crashes were brutal and vertical at times.
Looking at the chart below, XRP started the previous week with an opening market price of $0.5203. Moreover, the token was able to trade above its opening price on the ninth and halfway through the tenth of June. However, it wasn’t long before XRP crashed from $0.5357 to $0.4869 on the same day, entering the red zone.
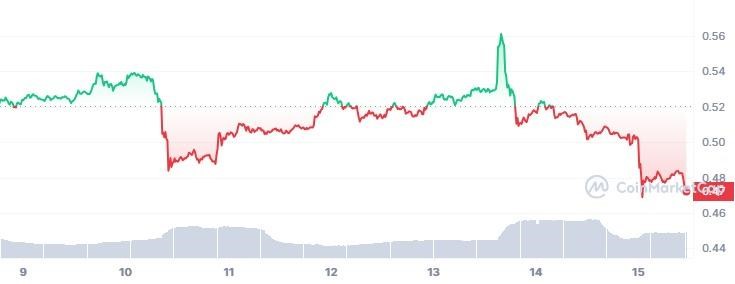
After spending over a day in the red zone, XRP briefly entered the green zone with a crest. But its momentum was subdued by the bears. Nonetheless, the bulls were strong on this occasion as they did not allow the token to sink deep into the red zone. As a result, XRP was just beneath the surface of the green zone.
On the thirteen of June, XRP rose above the red zone from $0.5144 to a weekly high of $0.5611. This rally of XRP was short-stayed as the token started to crash below the opening market price once again.
After falling off the $0.52 level, XRP is currently under the strongholds of the bears at $0.4708, facing more toward the deeper red zone.
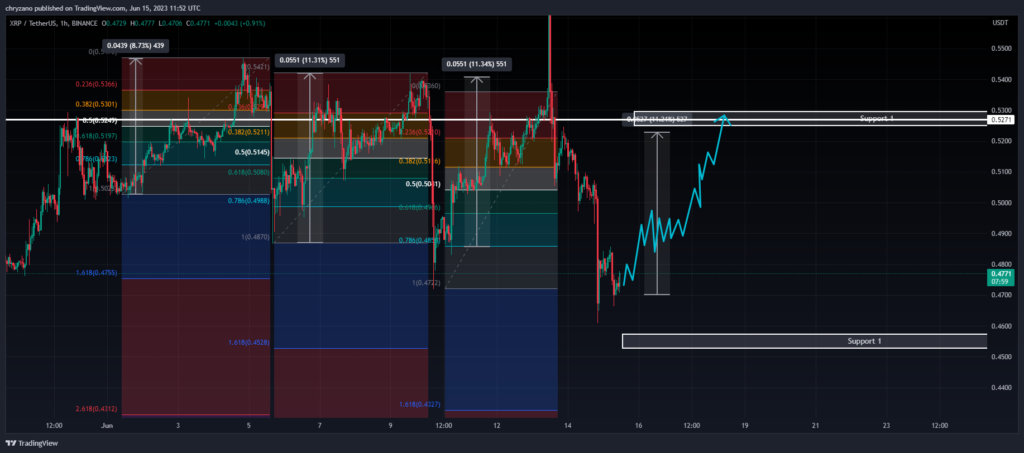
Considering the above, the fib retracement shows how XRP rose after every crash. Moreover, by comparing the angles of the trendlines for XRP with the horizontal axis, we can see that they are increasing. Each of these rises in price has a surge of around more than 10%. As such, if XRP follows the trend of crashing and rising, it may be time for XRP to rise once again.
If XRP follows this pattern, we could expect it to rise by more than 10%. Traders looking to go long may want to enter the market, as the conditions look favorable for a surge.
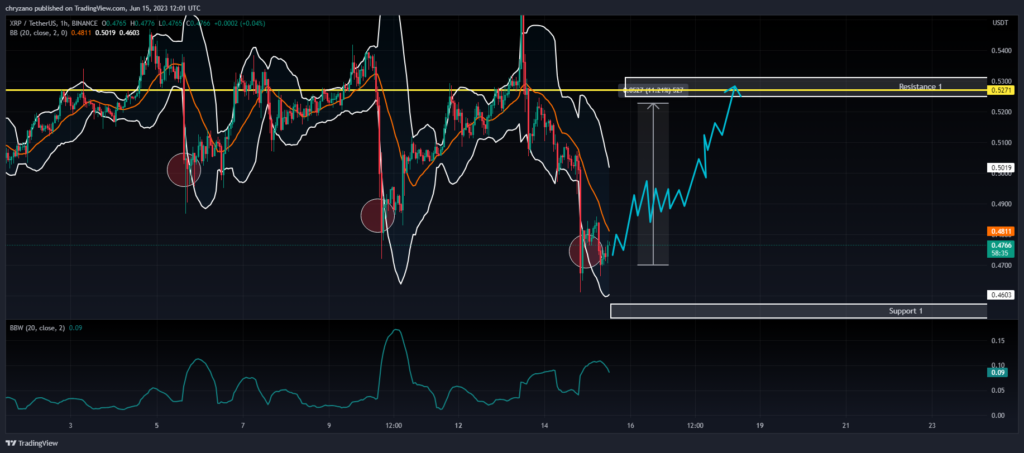
For instance, XRP is currently retracing after touching the lower Bollinger band, indicating a potential climb toward Resistance 1 at $0.5271. Meanwhile, the Bollinger bandwidth indicator at the bottom of the chart is moving downwards. This suggests that the bandwidth could keep reducing, and there could be less volatility in the market in the coming days.
Buyers may need to consider having their entry point close to the Simple Moving Average of the Bollinger Band. The above thesis could be supported by the fact that XRP previously rose when it broke above the middle band.
Disclaimer: The views, opinions, and information shared in this price prediction are published in good faith. Readers must do their research and due diligence. Any action taken by the reader is strictly at their own risk. Coin Edition and its affiliates will not be liable for direct or indirect damage or loss.
Disclaimer: The information presented in this article is for informational and educational purposes only. The article does not constitute financial advice or advice of any kind. Coin Edition is not responsible for any losses incurred as a result of the utilization of content, products, or services mentioned. Readers are advised to exercise caution before taking any action related to the company.
 Price Prediction 2026, 2027, 2028, 2029, 2030-2050")


