
- XRP holders face growing losses as SOPR drops below one, signaling capitulation risk.
- Price nears key Fibonacci and 50-month EMA zones, hinting at potential reversal.
- Macro trends, including Bitcoin moves, could push XRP toward $0.70 if weakness persists.
XRP has entered a fragile phase as on-chain data points to rising stress among holders. Market metrics show mounting losses, weakening confidence, and growing sensitivity to broader crypto conditions.
Besides price declines, blockchain indicators suggest a deeper reset is underway. Consequently, analysts now debate whether XRP stands near a macro bottom or faces more downside before stability returns.
On-Chain Data Signals Holder Capitulation
Data from Glassnode shows XRP lost its aggregate holder cost basis. This breakdown pushed many holders into loss territory. Significantly, the SOPR seven-day EMA dropped from 1.16 in July 2025 to 0.96 recently. Hence, most transactions now realize losses rather than profits.
Additionally, on-chain profitability has turned negative across short- and mid-term cohorts. This shift reflects panic-driven selling rather than structured distribution. Moreover, this setup mirrors the September 2021 to May 2022 period.
During that phase, SOPR stayed below one for months before consolidation emerged. Consequently, current conditions hint at a similar stabilization process rather than an immediate recovery.
Technical Structure Shows Mixed Signals
Technical analysis from ChartNerd adds important context to the on-chain weakness. XRP has endured nearly six months of steady downside without meaningful relief. However, momentum indicators like RSI and MACD now sit near historical oversold levels.
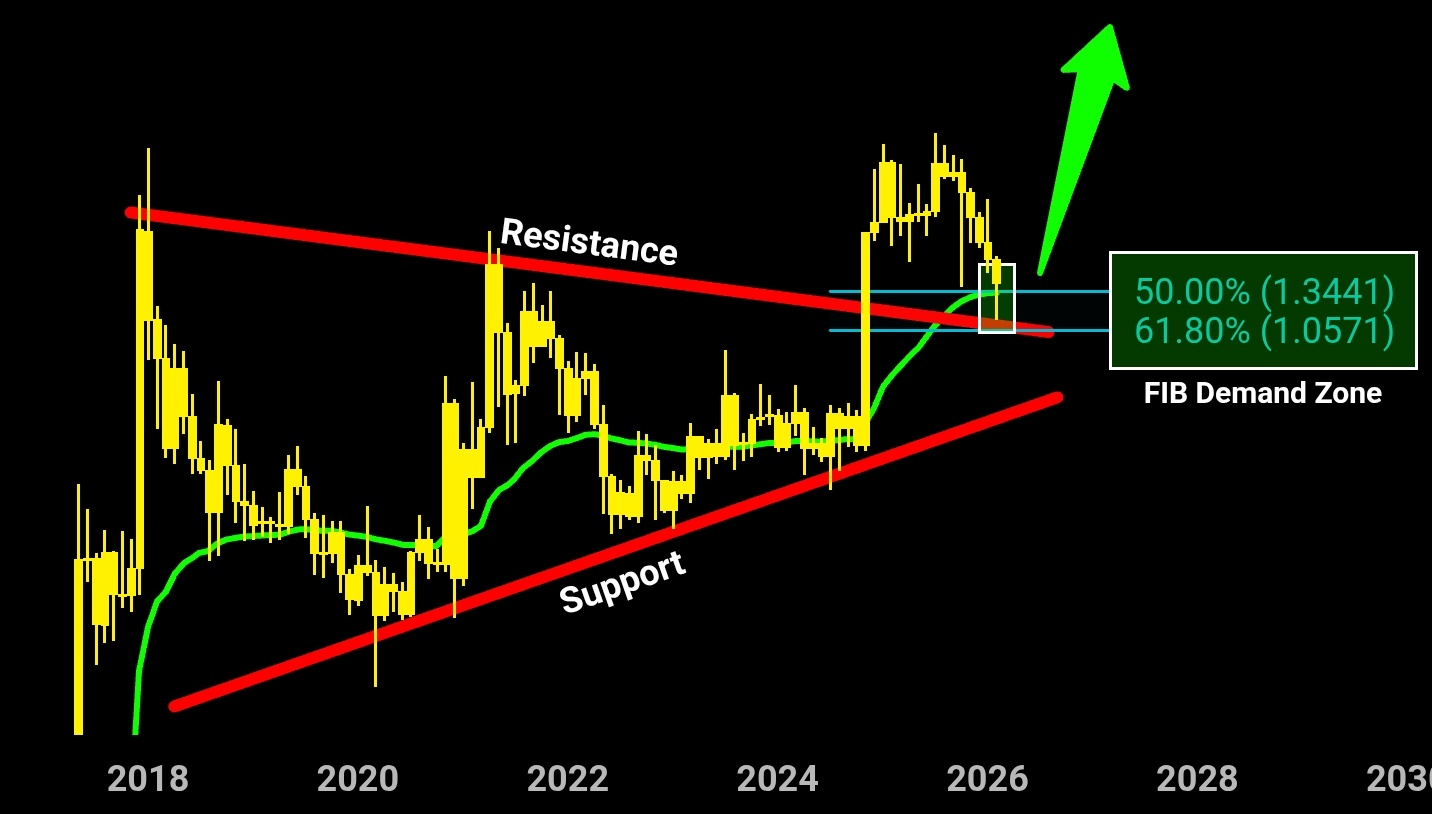
Besides momentum exhaustion, XRP recently retested its 50-month EMA. This level aligns with a former eight-year resistance zone. Moreover, price wicked into the 0.618 to 0.5 Fibonacci demand pocket.
Traders often view this zone as a potential reversal area. Hence, maintaining strength above one dollar remains critical for bullish continuation.
Downside Risk Tied to Macro Conditions
Despite structural support, ChartNerd outlines a cautious alternative scenario. The monthly Gaussian Channel shows XRP retesting its upper regression band after a prior impulse. Historically, this pattern precedes additional declines toward the middle band. Significantly, that mid-band currently aligns near $0.70.
Moreover, this level matches untested resistance from 2023 and 2024. Consequently, XRP could revisit that zone if macro pressure intensifies. Bitcoin behavior remains a key variable. If Bitcoin loses $62,000 and trends toward the low $50,000 range, XRP likely follows.
Currently, XRP trades near $1.39 with a weekly decline approaching 13%. Hence, price action around $1.12 now acts as a critical validation level.
Sustained weakness below it may extend consolidation into late spring. However, stabilization above $1 could allow the market to rebuild confidence gradually.
Related: XRP Price Prediction: XRP Consolidates After Selloff as Market Conviction Fades
Disclaimer: The information presented in this article is for informational and educational purposes only. The article does not constitute financial advice or advice of any kind. Coin Edition is not responsible for any losses incurred as a result of the utilization of content, products, or services mentioned. Readers are advised to exercise caution before taking any action related to the company.


