
- XRP faces key resistance at $0.5550 whereby a breakout could signal bullish momentum.
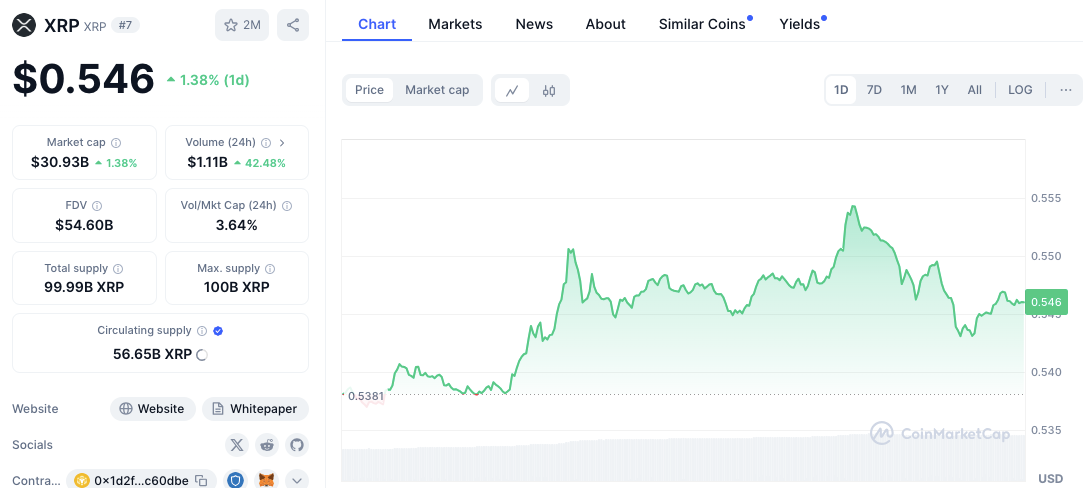
- Support at $0.5381 remains crucial as XRP consolidates near the $0.5463 mark.
- RSI at 47.30 signals neutrality, while MACD hints at potential bullish momentum.
XRP is currently testing a critical resistance level, leaving traders to speculate whether the cryptocurrency can break through and continue its upward climb. As of now, XRP is trading at $0.5463, and the price appears to be consolidating after a recent upward move.
XRP has found short-term support at $0.5381, a level where buyers previously stepped in to push the price higher. This zone could continue to provide support if selling pressure increases. Furthermore, the $0.5400 level has acted as a consolidation point before, likely holding psychological significance for traders seeking stability before a potential breakout.
Resistance Levels to Determine Bullish Potential
The primary focus is on the key resistance levels XRP is facing. The price has attempted to move past the $0.5500 to $0.5550 range, but each time, it has met strong resistance and retraced. This resistance zone will be crucial in determining whether XRP can enter a more bullish phase.
If XRP breaks above $0.5550, it could signal a more significant rally, potentially driving the price higher in the coming days. Traders should closely monitor this level, as it could mark a decisive shift in market sentiment.
Technical Indicators Show Mixed Signals for Momentum
Despite testing these key levels, XRP’s overall trend remains upward. A recent bounce from the lower $0.54 range shows continued interest from buyers, especially with the increase in trading volume. XRP’s volume-to-market cap ratio, currently at 3.64%, reflects growing market activity, suggesting that investor interest may help sustain its current path.
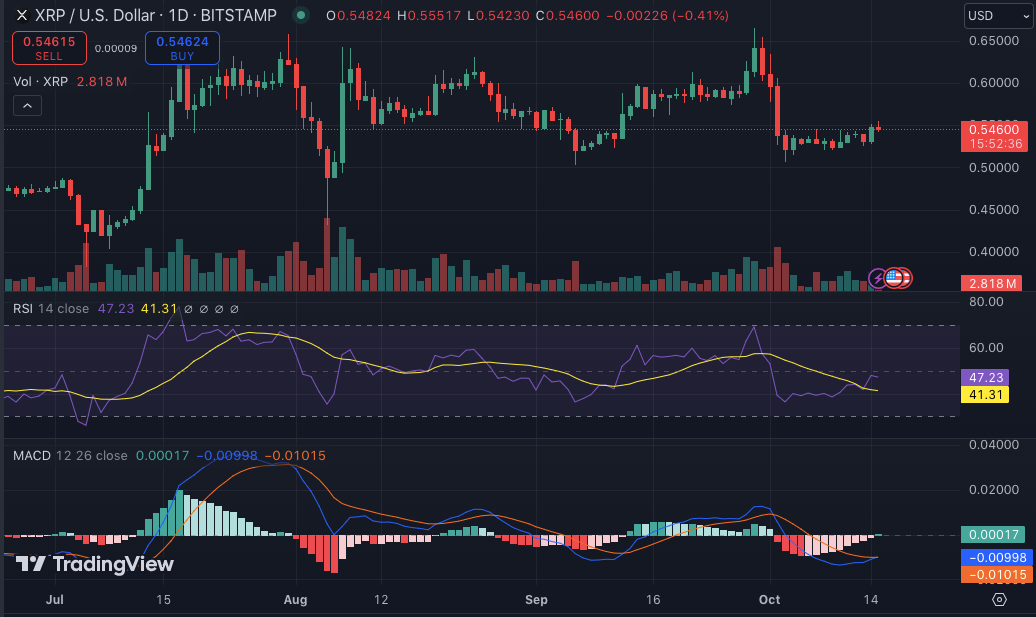
Technical indicators offer mixed signals. The Relative Strength Index (RSI) is currently at 47.30, placing XRP in a neutral zone, which could indicate a pause before further movement in either direction. However, the Moving Average Convergence Divergence (MACD) is positioned slightly above the signal line, hinting at the possibility of growing bullish momentum.
Disclaimer: The information presented in this article is for informational and educational purposes only. The article does not constitute financial advice or advice of any kind. Coin Edition is not responsible for any losses incurred as a result of the utilization of content, products, or services mentioned. Readers are advised to exercise caution before taking any action related to the company.


