
- XRP is trading within an ascending triangle, historically leading to an upside breakout in 70% of cases.
- A break above $3 could trigger a rally toward $3.2–$3.4, with analysts setting a long-term target of $5.8.
- Failure to surpass resistance may lead to extended consolidation or a retest of support near $2.50.
XRP is nearing a critical resistance level, with technical indicators pointing to a breakout scenario.
The 12-hour chart reveals the formation of an ascending triangle, a bullish pattern that typically results in an upward breakout 70-75% of the time. This structure suggests that if buyers can push XRP beyond $3, the price could surge toward the $3.2–$3.4 range.
Analyst Dark Defender has shared optimism about XRP’s trajectory, suggesting that clearing the $3 resistance zone could open the door for a rally toward $5.8, a projection that aligns with the 261.8% Fibonacci extension level.
However, for this to happen, XRP must overcome strong selling pressure and maintain momentum above key resistance levels.
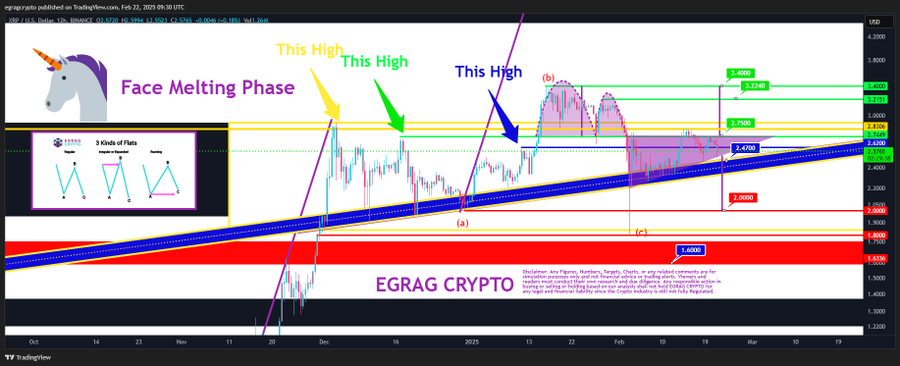
XRP’s Struggle at $3 Resistance
Despite the bullish setup, XRP is still struggling to break past $3, which has acted as a major resistance barrier. Multiple rejection wicks near this zone indicate that sellers are actively defending this level.
A decisive breakout above $3 with strong volume would be a confirmation of bullish momentum, while another failure could result in continued consolidation or a potential pullback toward $2.50–$2.60.
Related: XRP Whales Continue Accumulation Spree, 20 Million More Added
Technical Indicators Signal Potential Shift
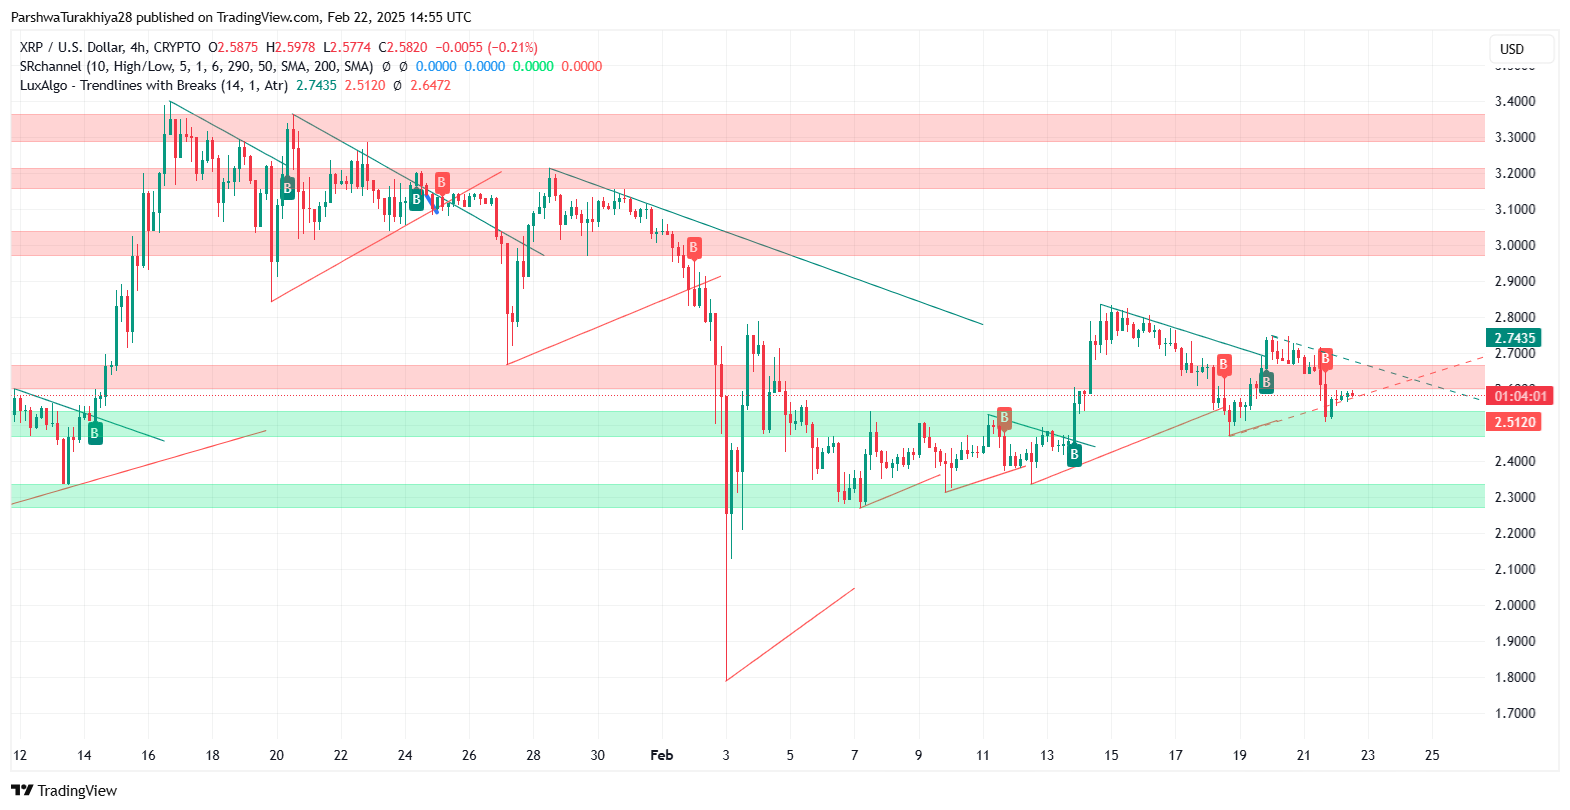
The 4-hour chart shows that XRP is consolidating just below the $2.74 resistance level, where buyers and sellers are fighting it out.
The Relative Strength Index (RSI) is at 44.52, suggesting that XRP is in a neutral to slightly oversold zone. If the RSI moves above 50, it would indicate a shift toward increased bullish momentum.
The Bollinger Bands are tightening, which suggests reduced volatility and an upcoming breakout.
If XRP closes above the upper Bollinger Band (~$2.74), it could trigger an upward move toward $3.2–$3.4. However, if the price fails to hold support around $2.50–$2.60, a deeper retracement toward $2.30 or even $1.86 could follow.
Key Levels to Watch for XRP Weekend Traders
The 200-day EMA (Exponential Moving Average) is currently acting as a key resistance level near $2.64. A golden cross between the shorter-term 50 EMA and 200 EMA would signal a bullish trend shift, but XRP needs strong buying volume to confirm this move..
The MACD histogram remains flat, indicating that traders are waiting for a clear directional move before making big bets. A bullish crossover on the MACD line would confirm that momentum is shifting toward the upside.
Related: XRP Holders Fire Back After Gary Cardone Says “I Sold My $81,000 XRP”
Decision Time for XRP: Breakout or Rejection?
With XRP trading in a decision zone, the next few sessions will be critical in determining whether bulls have the strength to push past $3 or whether sellers will once again force a rejection.
If volume increases and XRP closes above $3, a breakout toward $3.2–$3.4 is likely. However, if momentum weakens, XRP may see an extended consolidation phase or a drop toward $2.50 before another breakout attempt.
Disclaimer: The information presented in this article is for informational and educational purposes only. The article does not constitute financial advice or advice of any kind. Coin Edition is not responsible for any losses incurred as a result of the utilization of content, products, or services mentioned. Readers are advised to exercise caution before taking any action related to the company.


