 Price Prediction for July 11")
XRP price rose over 12% in the past 48 hours, climbing to $2.44 following Ripple’s announcement of a custodial partnership with BNY Mellon. The move pushed XRP through a year-long descending trendline and into a major resistance band. Now, traders are watching to see whether momentum can sustain above $2.40, or if profit-taking sets in.
What’s Happening With XRP’s Price?
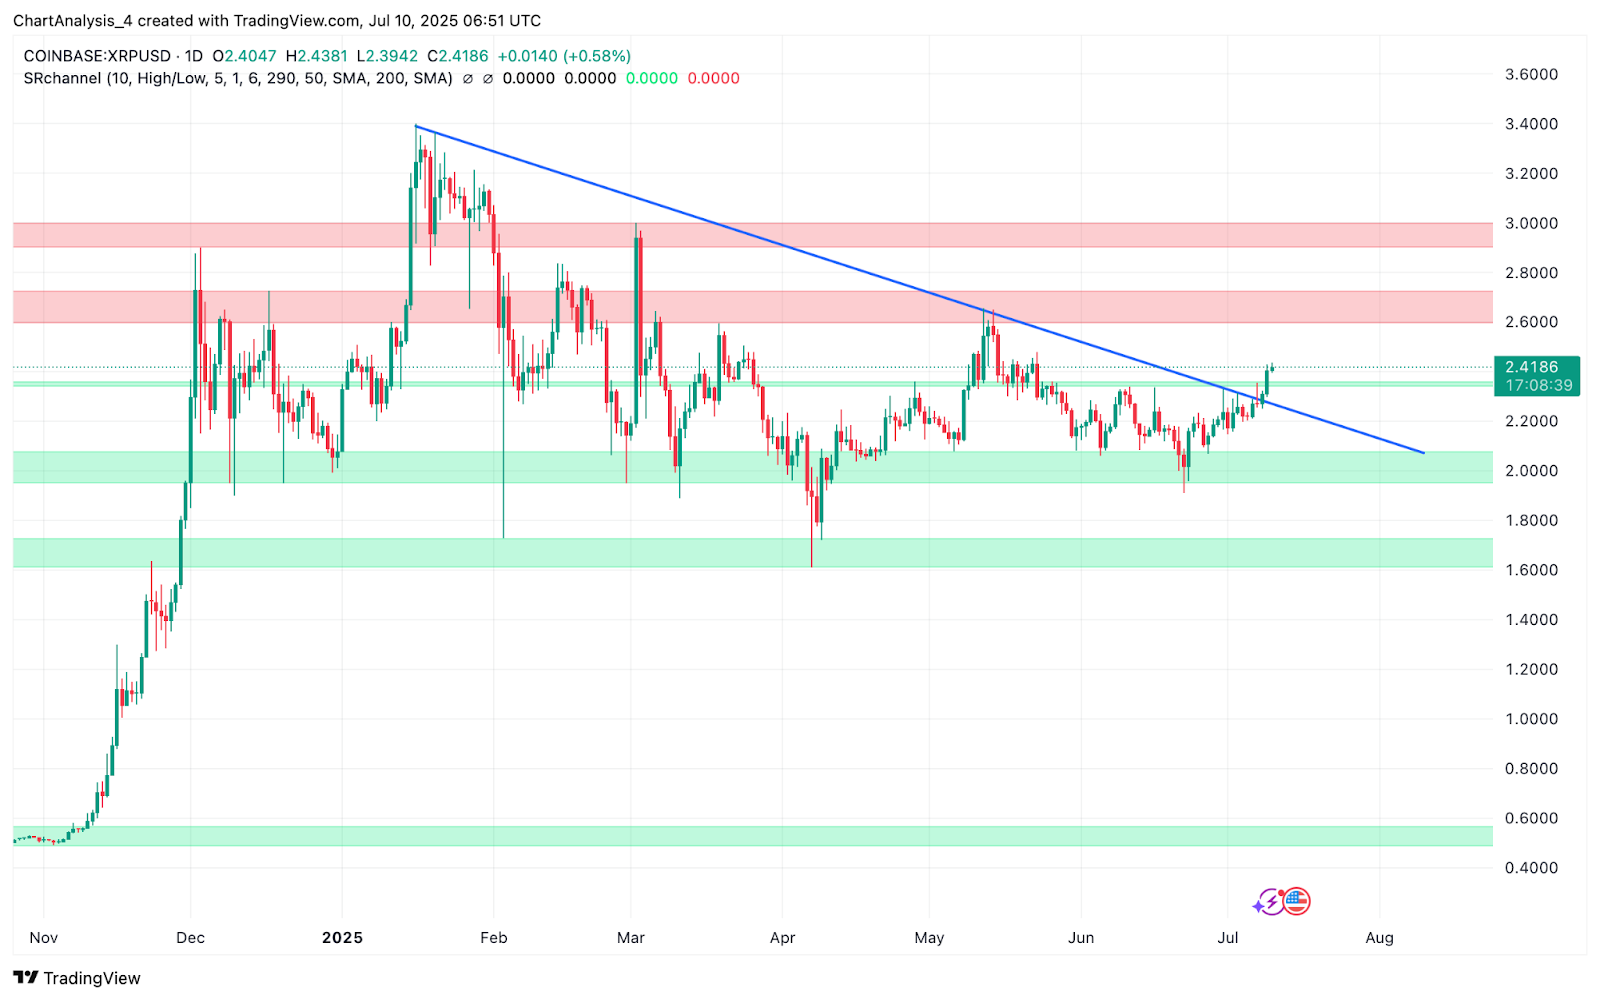
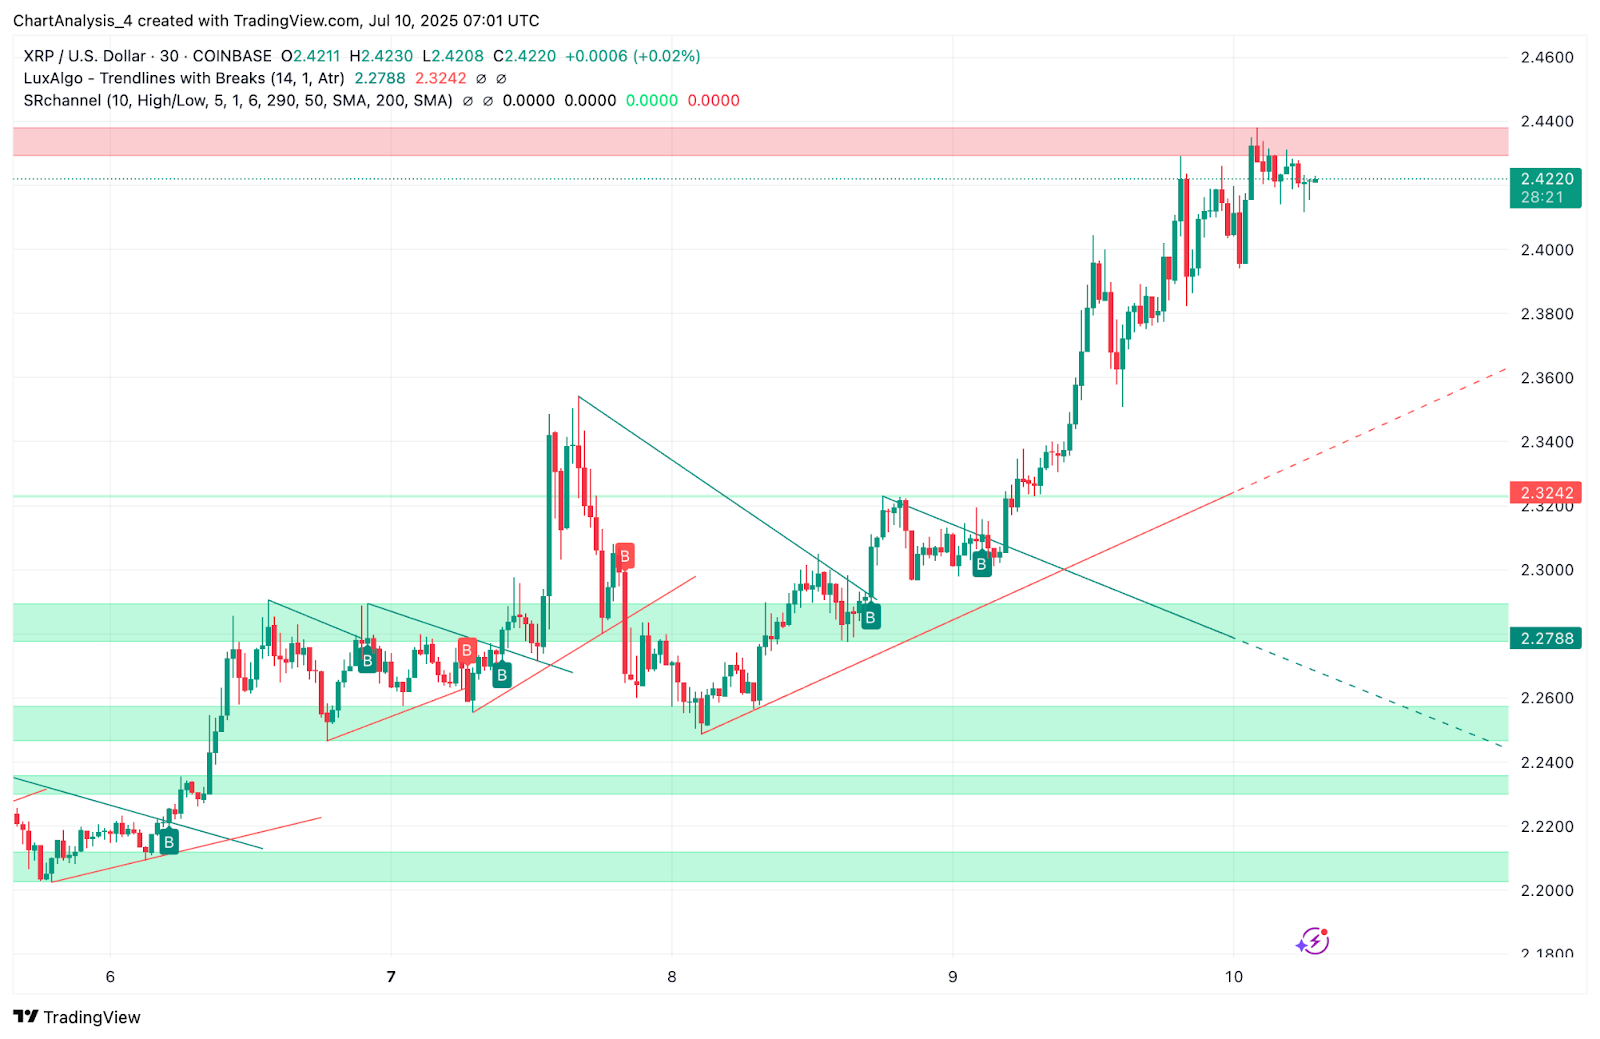
XRP has broken decisively above the $2.25–$2.28 resistance zone and is consolidating just below $2.44. This breakout marks the first successful close above the macro downtrend line since March 2024, according to the daily chart. The move also reclaims a crucial horizontal supply zone that previously capped price since April.
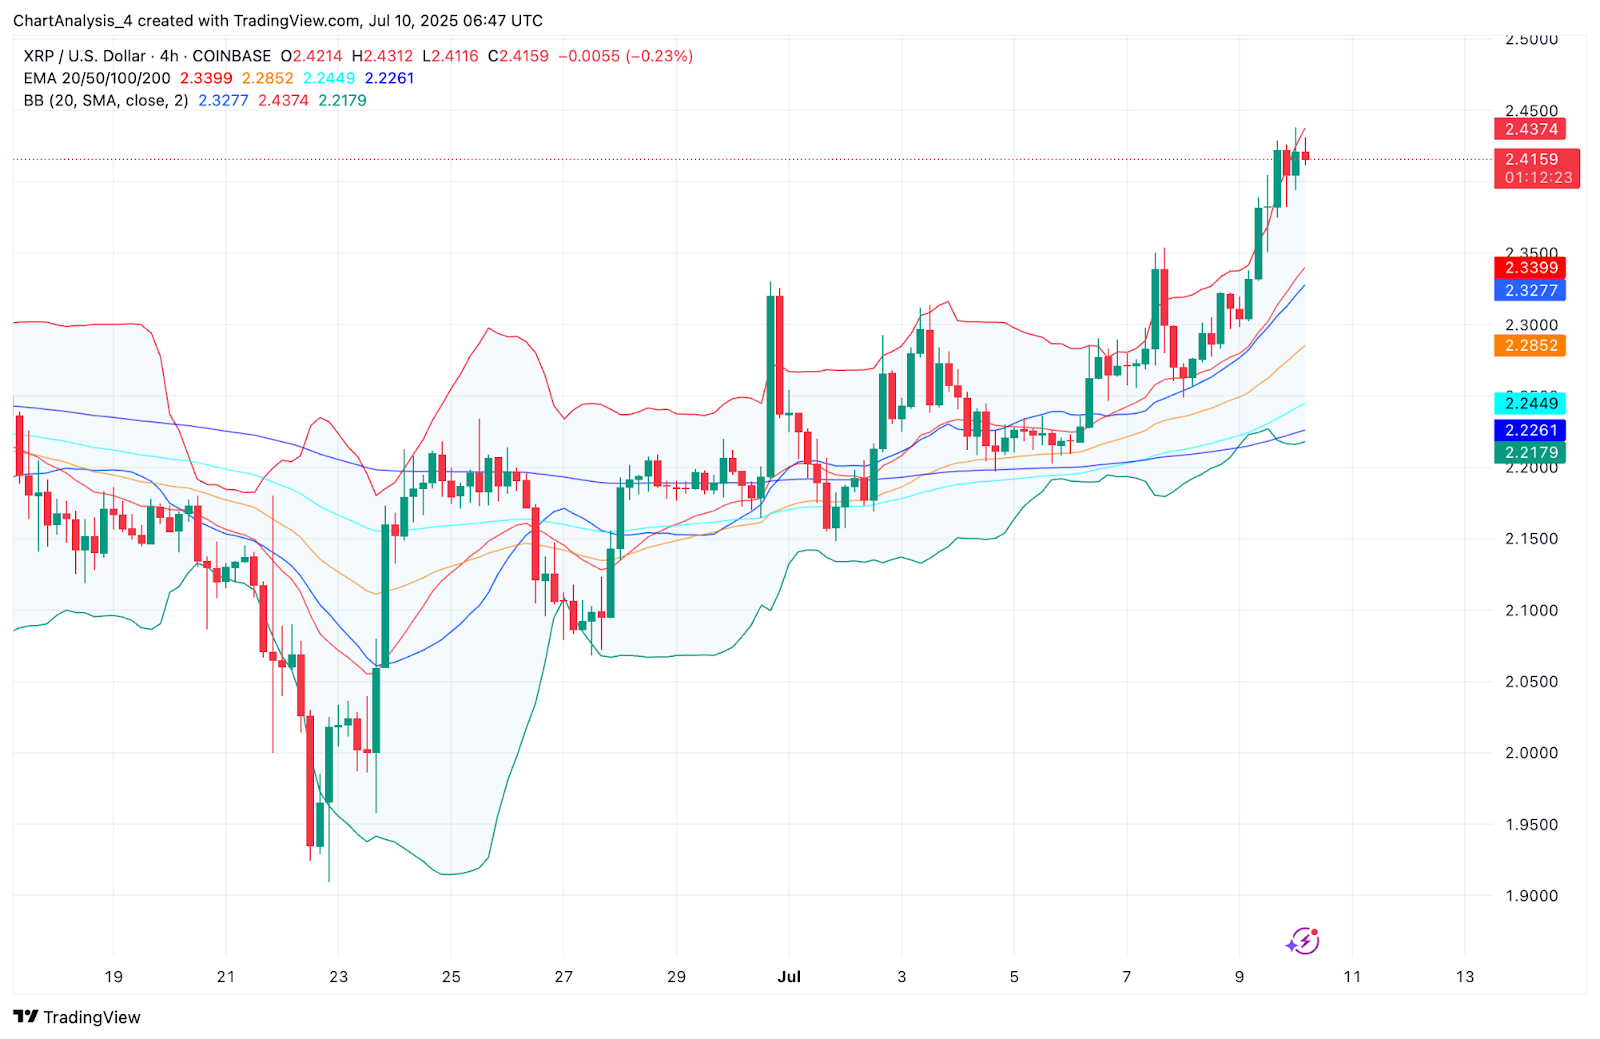
The 4-hour Bollinger Bands show XRP pushing the upper band at $2.4374, with the price now pausing near this dynamic resistance. Meanwhile, the EMA cluster (20/50/100/200) is fully aligned below price with the EMA20 at $2.34 and the EMA100 near $2.24 further confirming strong bullish structure.
XRP’s price action has now entered a liquidity pocket between $2.44 and $2.52, a zone marked by multiple prior rejections. A clean breakout above this band could reignite upside toward the $2.75–$2.80 zone seen in January.
Why Is The XRP Price Going Up Today?
The latest rally stems from Ripple’s confirmation that BNY Mellon will act as custodian for RLUSD, Ripple’s newly launched stablecoin. With over two centuries of institutional credibility, BNY Mellon’s involvement is being seen as a major institutional validation of Ripple’s blockchain infrastructure.
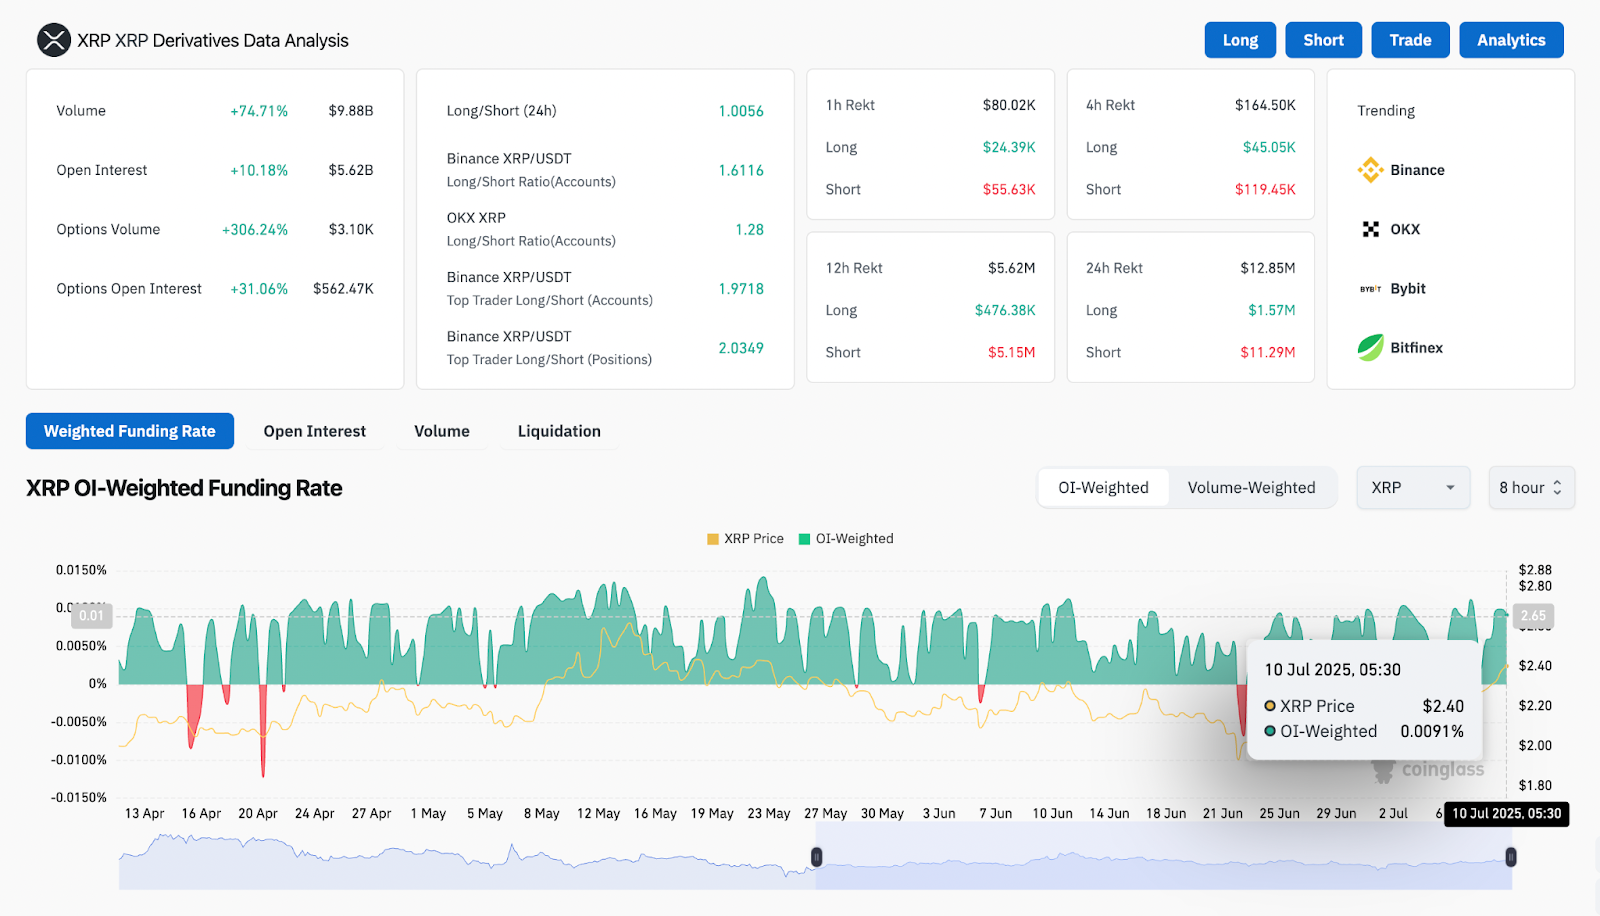
XRP rose sharply after the news broke, and derivatives data supports the momentum:
- Volume surged +74.7% to $9.88B
- Open interest rose +10.2%, with options volume soaring over 306%
- Top trader long/short ratios hit 2.03 on Binance positions and 1.97 on accounts — extremely bullish
- Funding rate remains positive at +0.0091%, reflecting long dominance
Shorts worth over $11M were liquidated in 24 hours as price climbed past $2.40, forcing additional upward pressure.
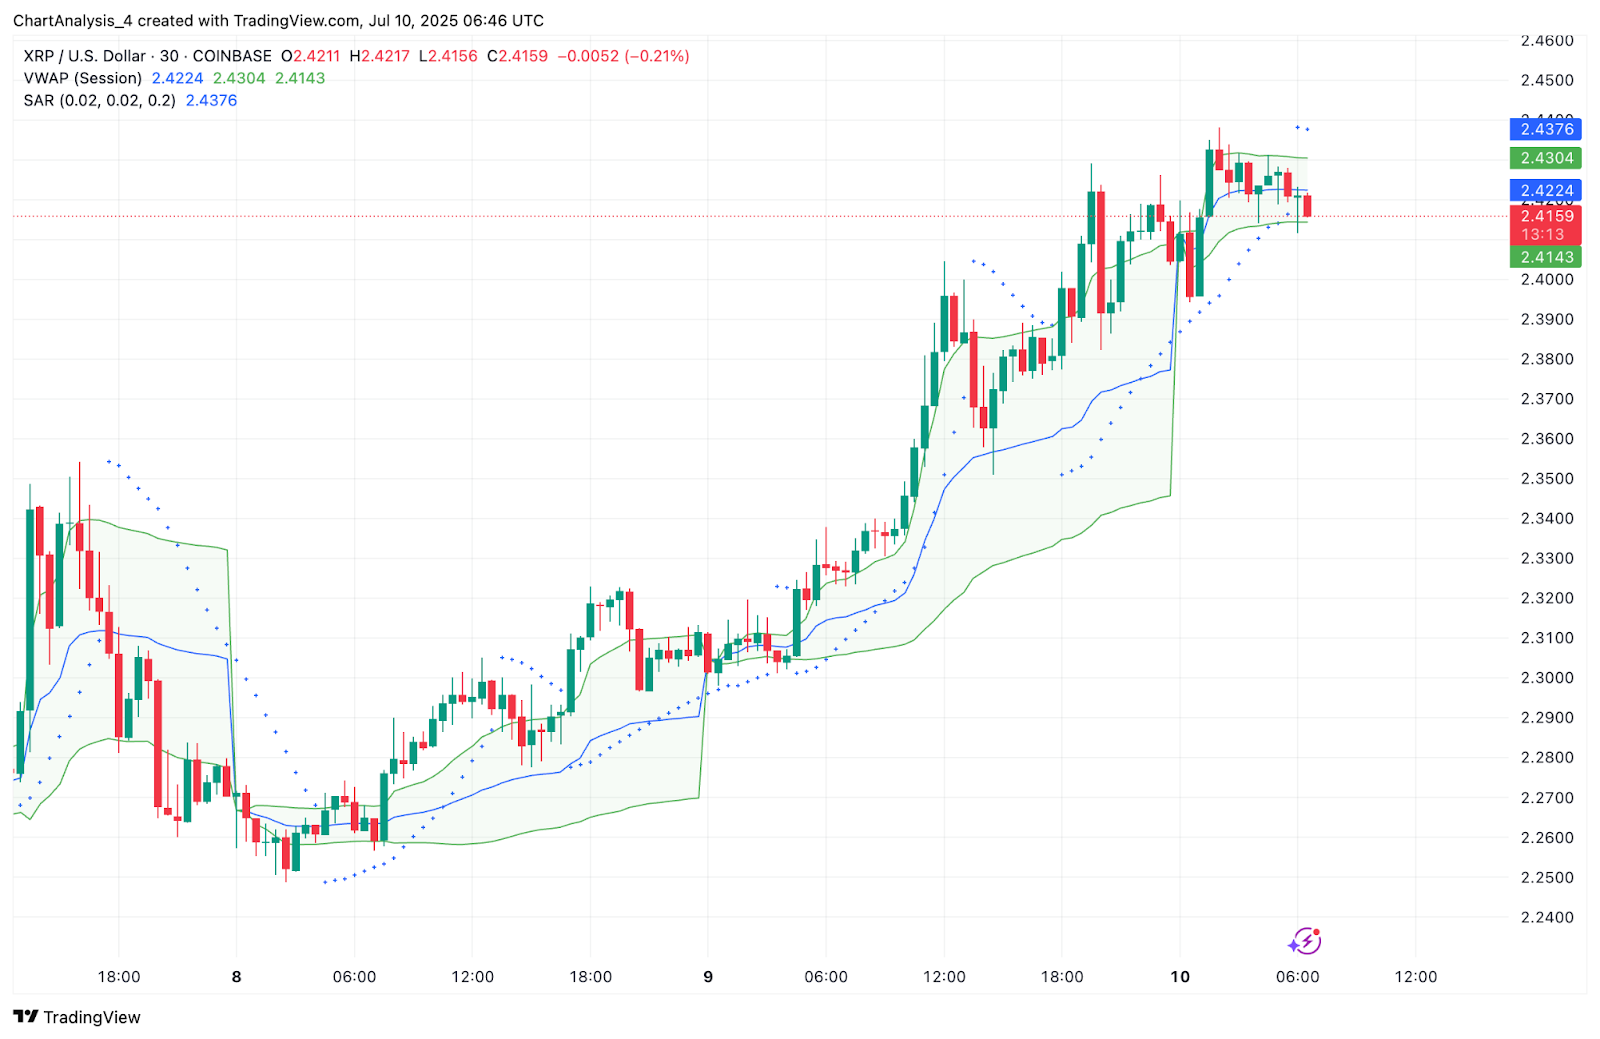
On the 30-minute chart, XRP price action is stalling below a red resistance band at $2.44, while VWAP sits just beneath the market at $2.4222, suggesting bulls are attempting to hold session control.
RSI, Supertrend, and DMI Show Overextension Risks
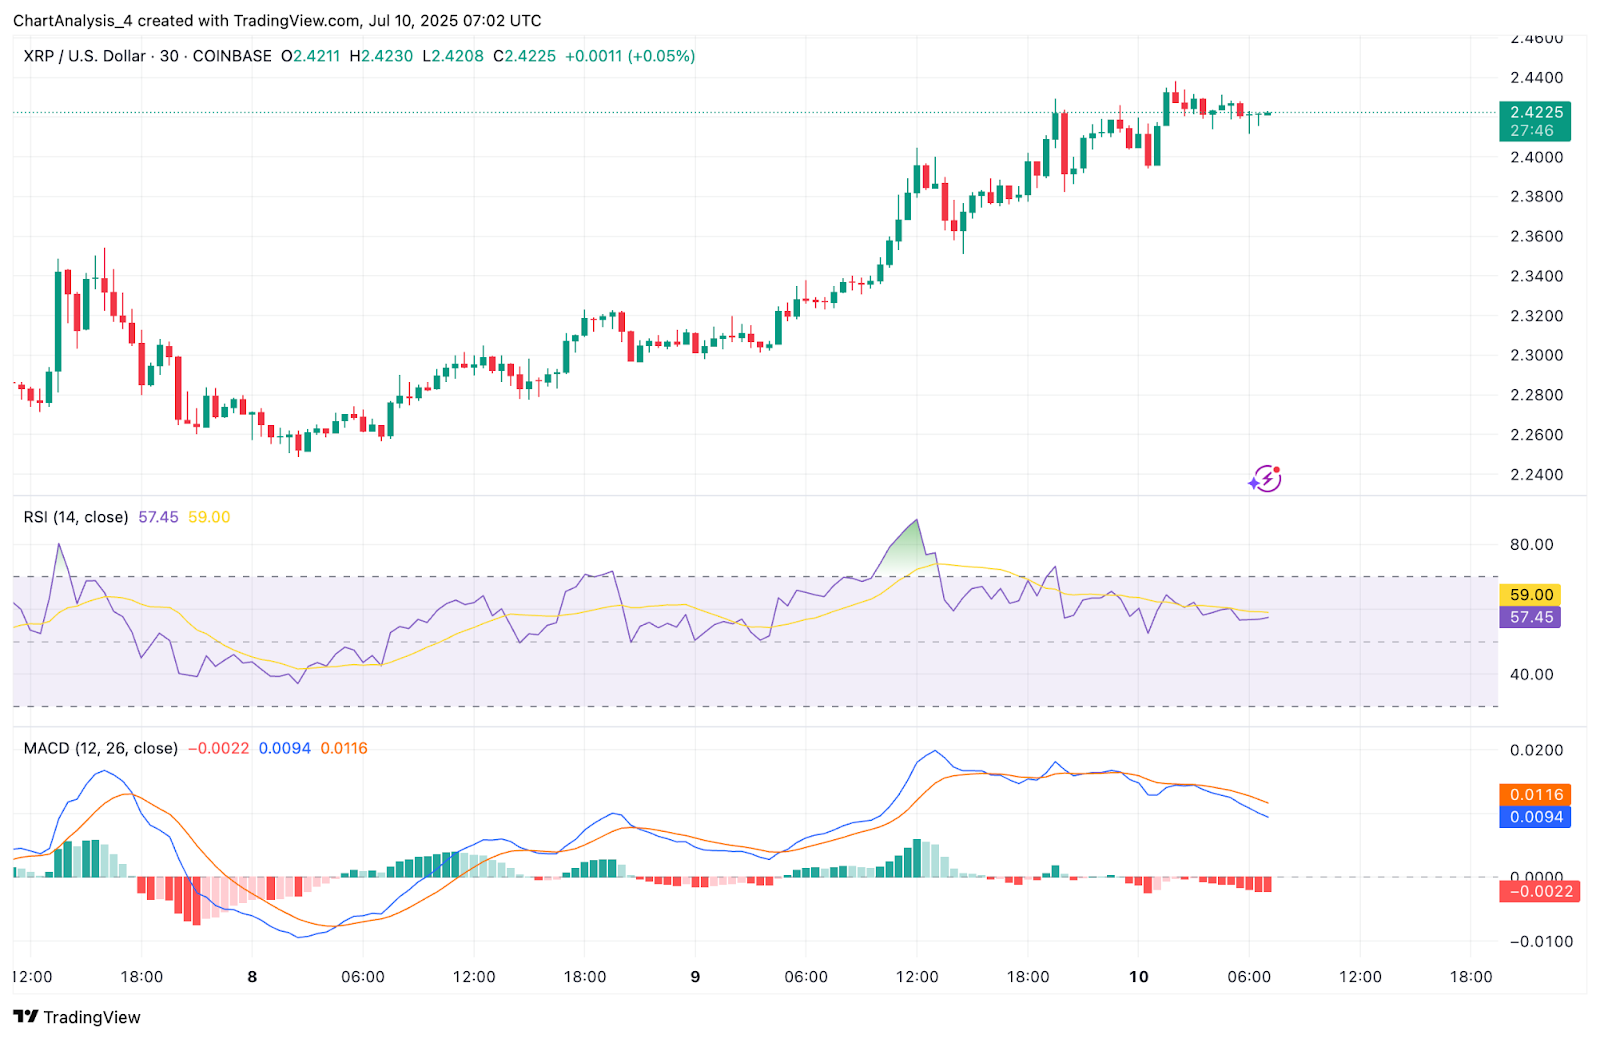
While the broader trend on higher timeframes continues to favor the bulls, several indicators are starting to reflect early signs of fatigue. On the 30-minute chart, the Relative Strength Index (RSI) has eased to 57.45 after previously spiking above 70. This shift suggests a reduction in upward momentum and signals that price could be entering a cooling phase.
Momentum weakness is further confirmed by the MACD. The moving averages have completed a bearish crossover, and the histogram has turned negative. This shift in structure indicates that buying pressure may be waning, at least in the short term.
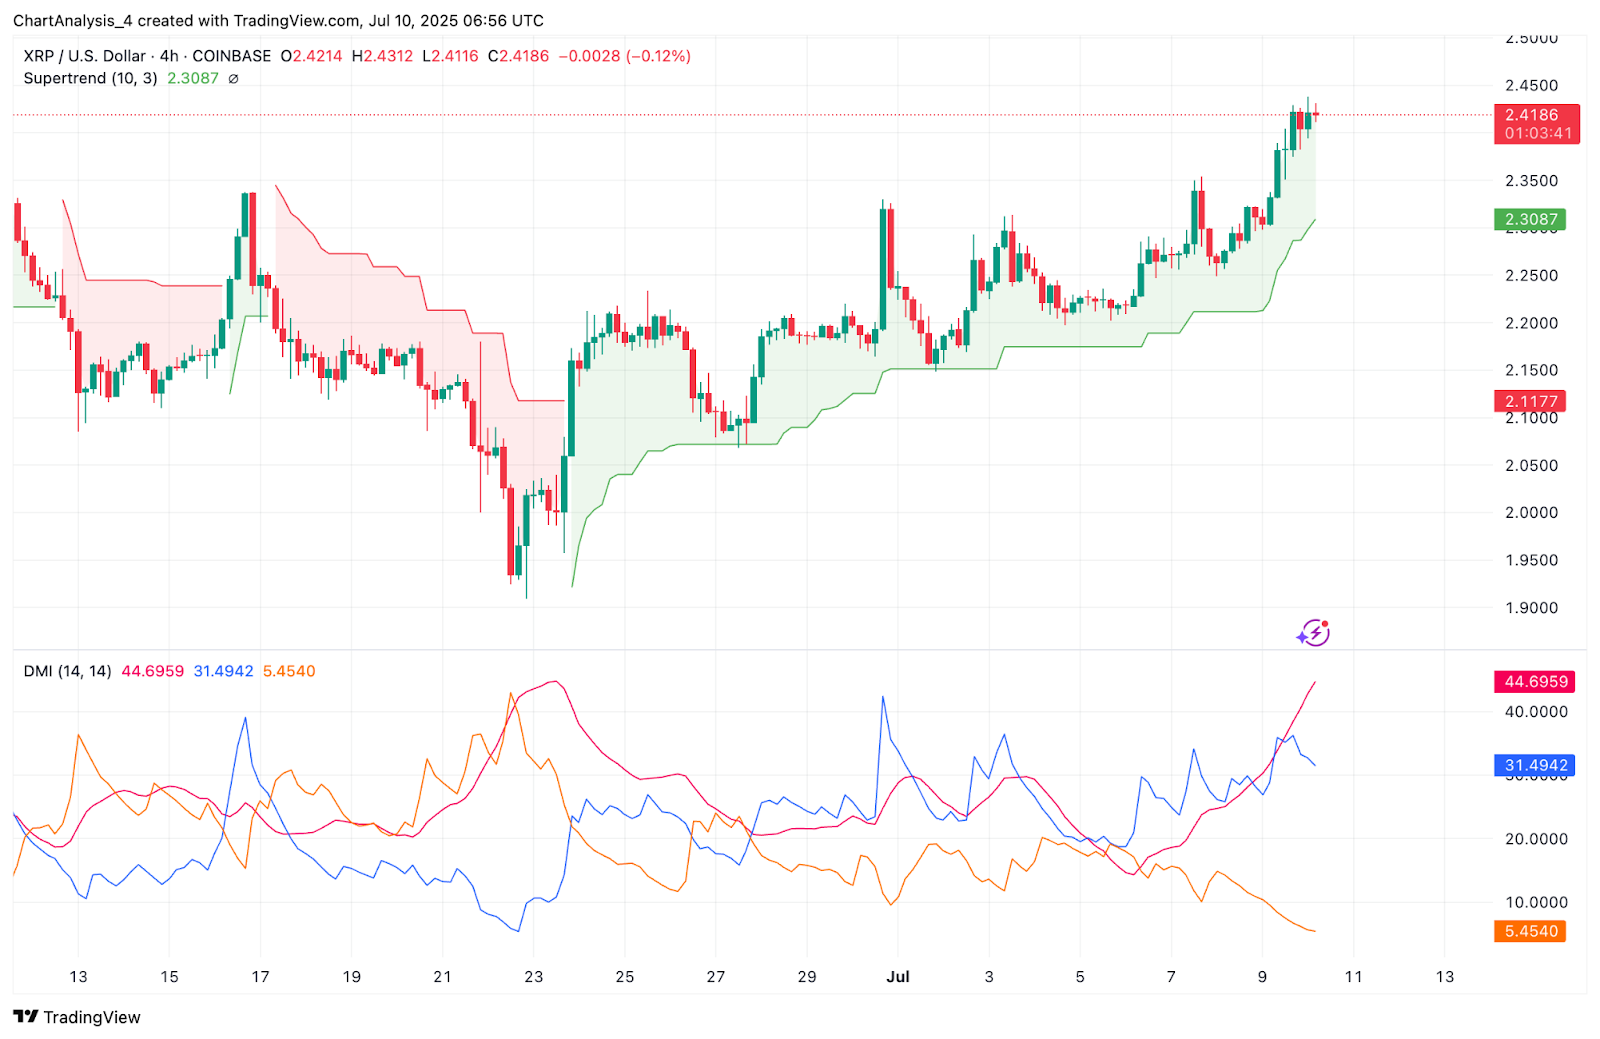
Looking at the 4-hour chart, the Directional Movement Index (DMI) highlights a wide separation between the positive directional index (DI+) at 44.7 and the negative DI- at 5.4. While this configuration confirms strong trend direction, the rising Average Directional Index (ADX) at 31.5 also points toward a potential exhaustion point where further upside may begin to slow unless new volume emerges.
The Supertrend indicator remains in bullish territory after flipping positive near $2.31 earlier this week. It now aligns with the EMA20 at $2.34 as key dynamic support. However, unless XRP price can establish a sustained breakout above $2.44, the current move risks transitioning into a sideways consolidation rather than an extended rally.
XRP Price Prediction: Short-Term Outlook (24H)
In the next 24 hours, XRP price must break and close above $2.44 to open the door toward the next major resistance zone near $2.52–$2.58. Failure to do so could result in a pullback toward $2.34, where both VWAP and EMA20 converge with minor liquidity support.
If price slips below $2.32, deeper correction toward $2.28 or even $2.22 becomes more likely as both are former breakout levels.
Ripple’s broader narrative remains bullish, especially with CEO Brad Garlinghouse set to testify before the U.S. Senate later this week. However, intraday caution is warranted until price confirms a sustained move above $2.44 with volume.
XRP Price Forecast Table: July 11, 2025
| Indicator/Zone | Level / Signal |
| XRP price today | $2.42 |
| Resistance 1 | $2.44 |
| Resistance 2 | $2.52–$2.58 |
| Support 1 | $2.34 |
| Support 2 | $2.28 |
| EMA Cluster (4H) | Bullish stack, lowest at $2.22 |
| Bollinger Bands (4H) | Upper Band at $2.4374 (testing) |
| RSI (30-min) | 57.45 (cooling) |
| MACD (30-min) | Bearish crossover, weakening histogram |
| Supertrend (4H) | Bullish above $2.3087 |
| DMI (14, 4H) | +DI 44.7 / -DI 5.4 / ADX 31.5 (strong) |
| VWAP (30-min) | $2.4222 (neutral bias) |
| Funding Rate (OI-weighted) | +0.0091% (bullish sentiment) |
| Derivatives Long Bias | Binance Top Trader Ratio: 2.03 (strong) |
Disclaimer: The information presented in this article is for informational and educational purposes only. The article does not constitute financial advice or advice of any kind. Coin Edition is not responsible for any losses incurred as a result of the utilization of content, products, or services mentioned. Readers are advised to exercise caution before taking any action related to the company.


