- Scott Melker recently uploaded a video to YouTube where he shared his altcoin picks.
- According to Melker, BTC flipping the $28,600 mark into support will trigger an altcoin rally.
- ETH, BNB, VET, ADA, and XRP are some of the altcoins highlighted in Melker’s video.
Scott Melker from the “Wolf of All Streets” account recently uploaded a video to Youtube where he listed some altcoins to watch in the next altcoin bull run. According to the video, altcoins will begin to rally once Bitcoin (BTC) flips the $28,600 mark into support.
Ethereum (ETH)
The leading altcoin, ETH, was the first altcoin mentioned in Melker’s video. At press time, ETH’s price is down 0.93% to trade at $1,870.46 according to CoinMarketCap. Despite the 24-hour loss, ETH’s weekly price performance remains in the green at +4.15%.
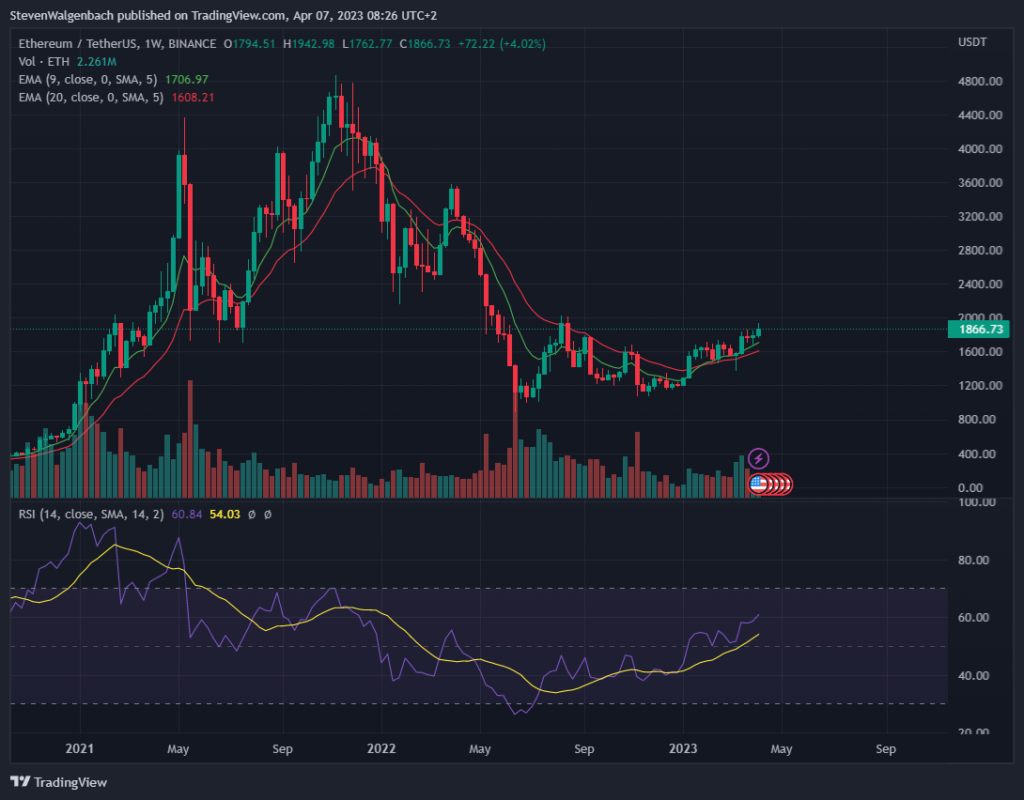
The weekly chart for ETH/USDT shows that the 9-week EMA has bullishly crossed above the 20-week EMA in the last 2 months. This suggests that ETH has entered into a medium-term bull cycle. In addition to this bullish cross between the two EMA lines, the weekly RSI for ETH is also flagging bullish with the weekly RSI line sloped positively toward the overbought territory.
Binance Coin (BNB)
Binance’s native token, BNB, was the next altcoin mentioned in the video. Binance has received its fair share of FUD in this bear cycle but was able to overcome all of the bearish sentiment and fear surrounding not only the exchange platform itself but also BNB. At press time, BNB is also down 0.55% over the last 24 hours, taking its price to $311.76.
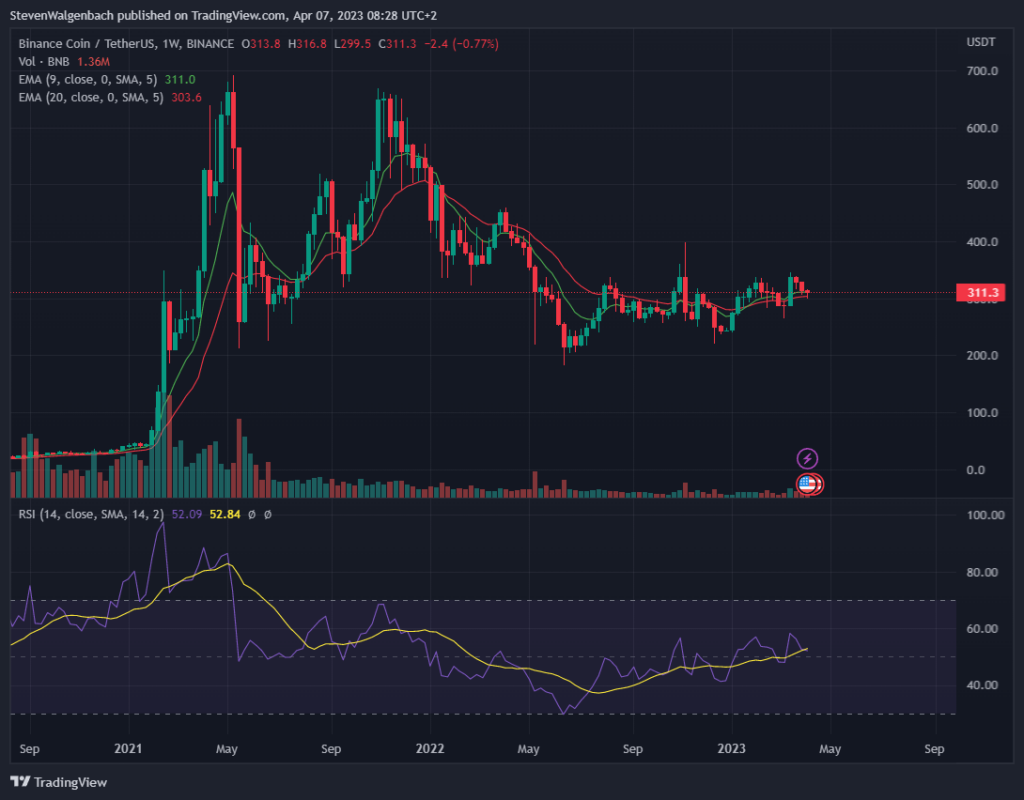
Similar to ETH’s weekly chart, the 9 and 20 EMA lines have also recently crossed on BNB’s weekly chart. However, the FUD around the Binance ecosystem seems to be impacting BNB’s price currently as bears are attempting to force BNB’s price back down. This could result in a bearish cross between the two aforementioned EMA lines in the near future.
Cardano (ADA)
ADA was also able to make its way onto the list. Similar to BNB and ETH, ADA’s price also printed a 24-hour loss according to CoinMarketCap. At press time, the price of ADA is down 1.95% and is trading at $0.3816. Fortunately, the altcoin’s weekly price performance remains in the green at +0.82%.
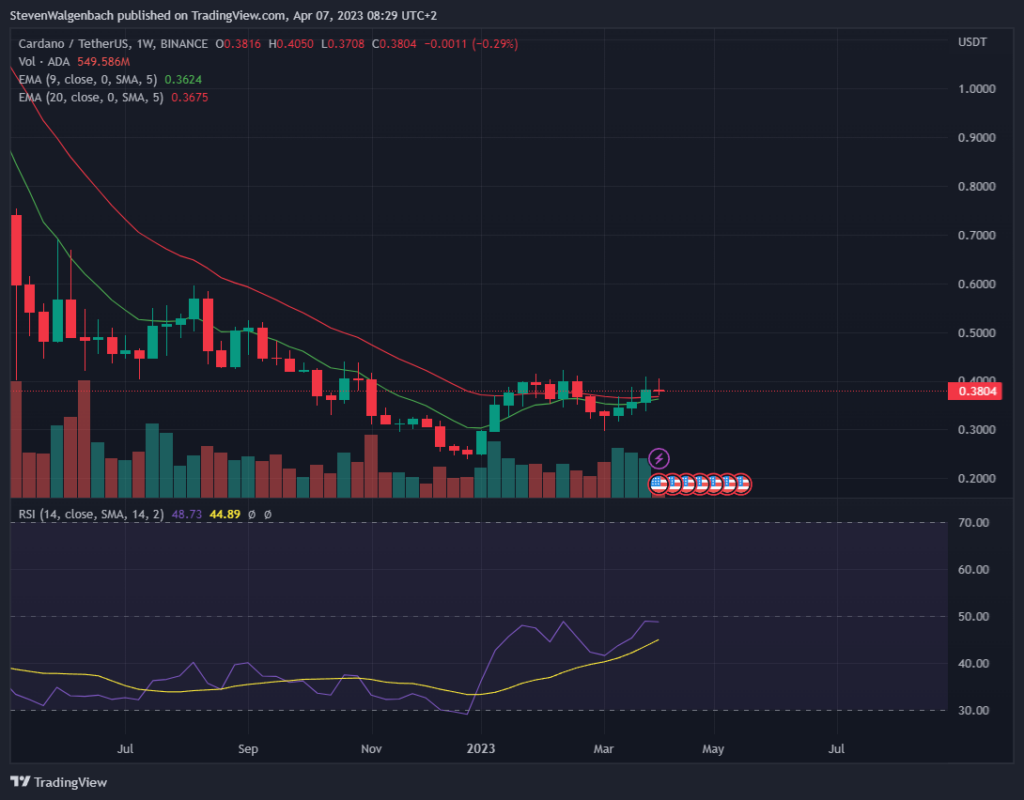
There is some positive news for ADA investors and traders as ADA’s weekly chart is on the verge of triggering a bullish flag. At press time, the 9-week EMA line is looking to cross bullishly above the longer 20-week EMA line. However, ADA traders and investors may want to wait for this cross to happen before entering into a medium-term long position for ADA.
Polkadot (DOT)
DOT’s price was unable to overcome the sell pressure in the crypto market over the last 24 hours, and saw its price slip as well. Currently, The price of DOT is down 2.45% to trade at $6.21. This has brought down the altcoin’s weekly performance to +0.48%.
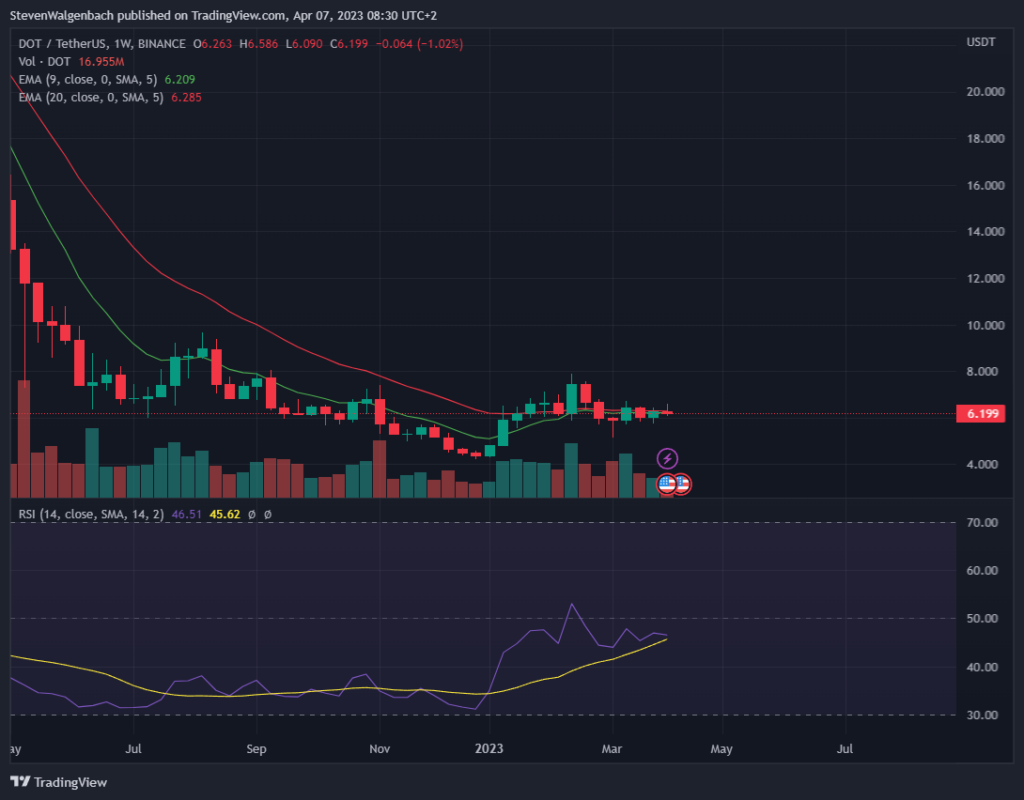
Similar to ADA’s weekly chart, DOT’s weekly chart is also on the cusp of triggering a bullish flag with the 9 EMA line looking to cross the 20 EMA line. A cross between these two lines may not result in significant medium-term gains, however, given the flat movement of the two lines at press time.
Chainlink (LINK)
The oracle data platform Chainlink (LINK) was also mentioned in Melker’s video. LINK is currently ranked as the 19th biggest project in terms of market cap and experienced a 1.18% price drop over the last 24 hours. As a result, LINK’s price stands at $7.19 at press time.
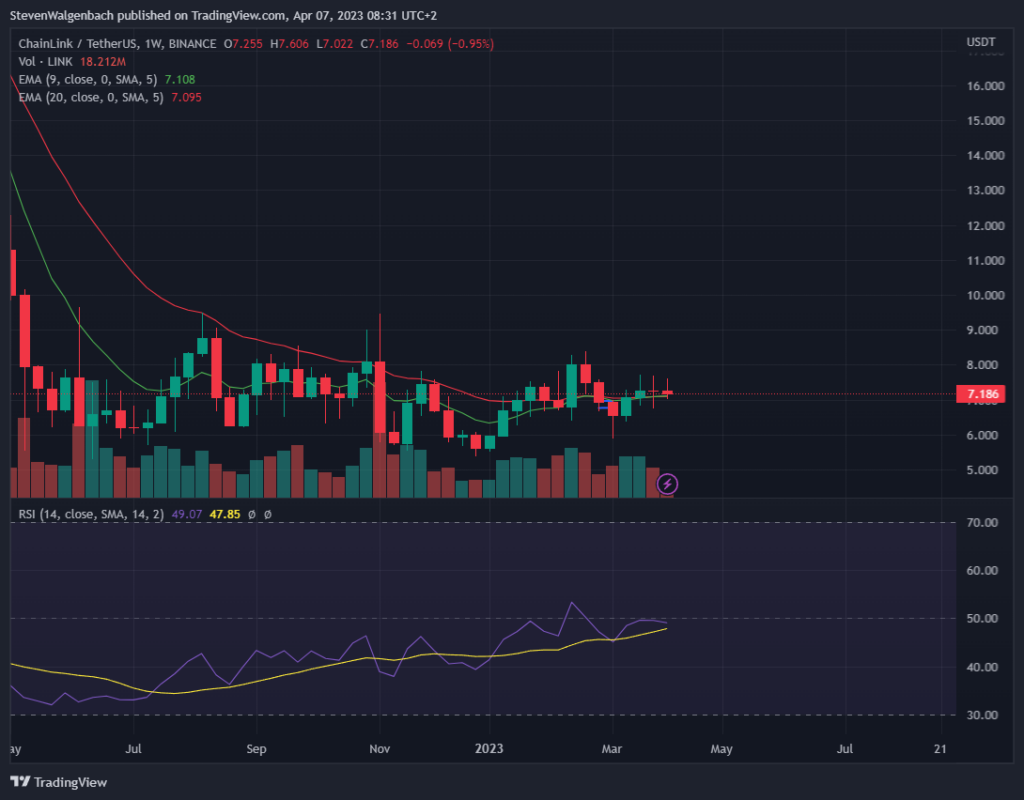
LINK’s weekly chart is also on the verge of a bullish breakout after its price recently broke above the 9 and 20 EMA lines on its weekly chart.
XRP (XRP)
Investors and traders have been bullish on XRP in the last few weeks with all of the recent developments in the ongoing lawsuit between Ripple Labs and the Securities and Exchange Commission (SEC). XRP’s price is up 1.22% over the last 24 hours to trade at $0.5097 at press time.
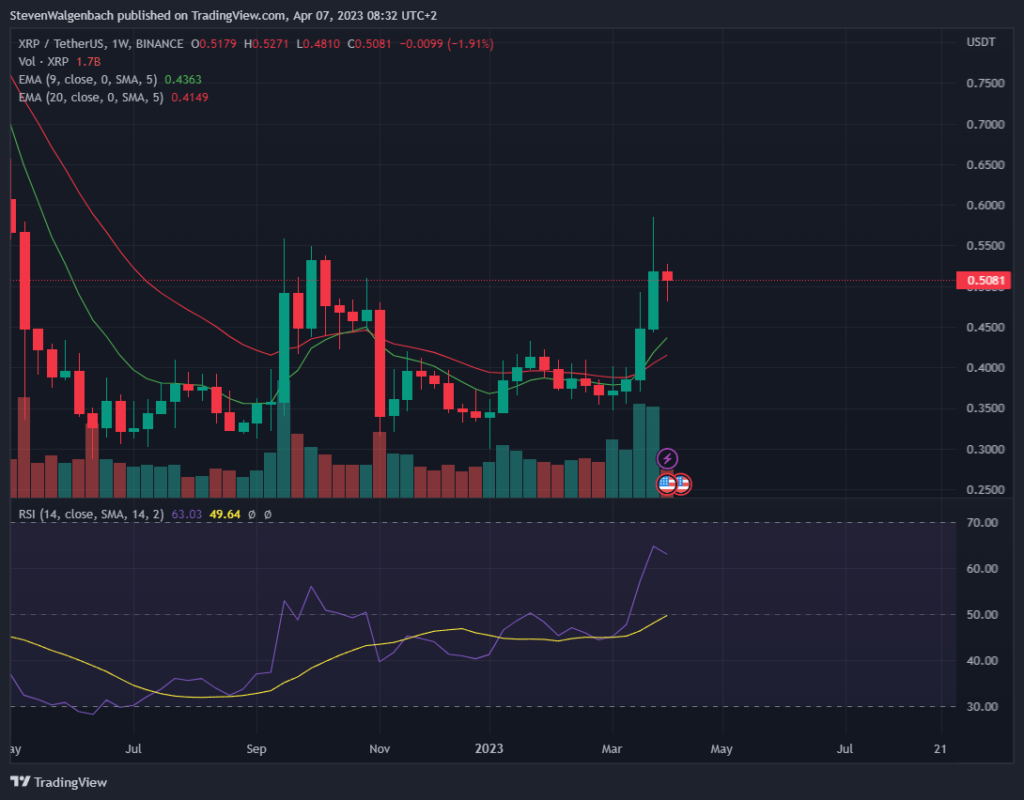
XRP’s break above its 9 and 20 EMA lines may be nothing more than an artificial pump. Nevertheless, the remittance token’s weekly chart is currently flagging bullish. There may be a slight retracement in XRP’s price given the peak that has formed in the weekly RSI indicator.
Stellar (XLM)
Ranked number 25 on CoinMarketCap’s list of the biggest crypto projects in terms of market cap, XLM is currently changing hands at $0.1053 after it printed a 0.20% 24-hour loss. This has pushed its weekly price performance further into the red. As a result, XLM’s price is down more than 5% over the last 7 days.
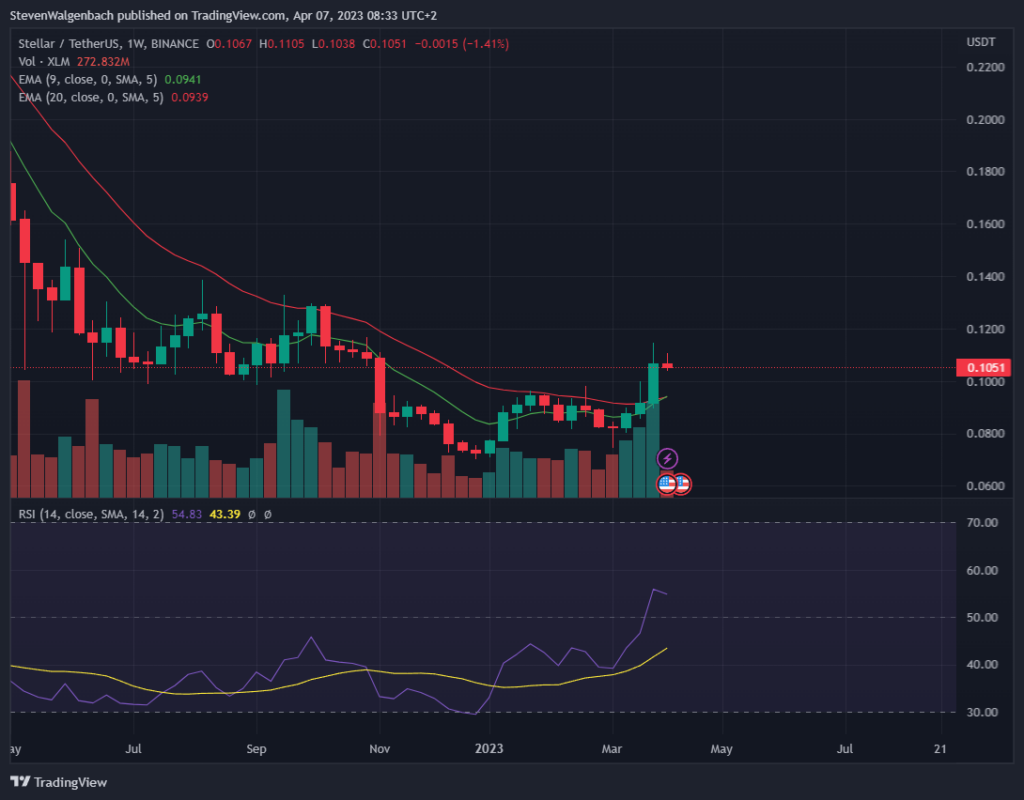
XLM’s chart has also flagged bullish recently after the altcoin’s price was able to break past the 9 and 20 EMA lines on its weekly chart. Similar to XRP, however, a peak has formed in XLM’s weekly RSI indicator which suggests that there may be a mini retracement in the next 2 weeks before another leg up.
Dogecoin (DOGE)
DOGE was also mentioned in the video as an altcoin to watch in the next altcoin market. DOGE’s price recently soared around 30% after Twitter changed its logo to DOGE’s icon. However, Twitter changed its logo back to its original Bluebird – causing DOGE’s price to drop 9.85% in the last 24 hours. As a result, DOGE’s price stands at $0.0829 at press time.
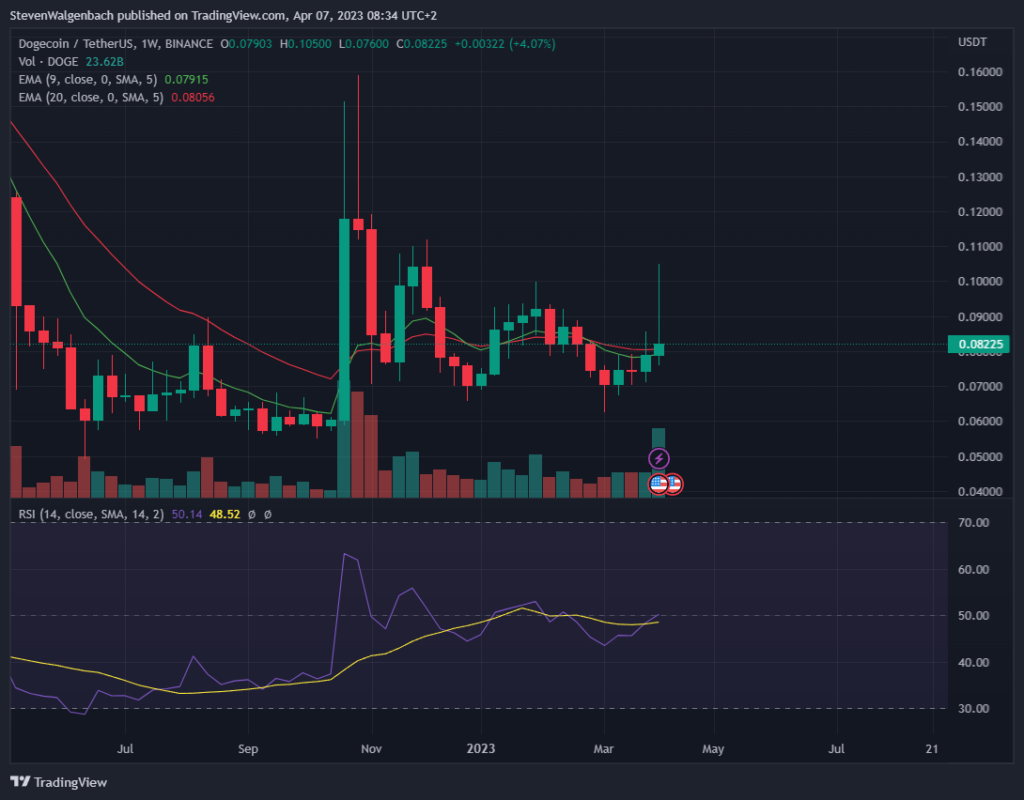
DOGE’s price was able to blow past the 9 and 20-week EMA lines but then experienced a retracement shortly thereafter. Nevertheless, the meme coin’s weekly chart is still flagging bullish as the weekly RSI line has recently crossed the weekly RSI SMA line.
VeChain (VET)
VET is one of the altcoins that has separated itself from the rest of the crypto market by printing a 24-hour gain of 2.05% according to CoinMarketCap. This has added to its already-positive weekly performance, taking the total weekly gain for VET to +6.68% at press time. VET’s price is now trading at $0.02445.
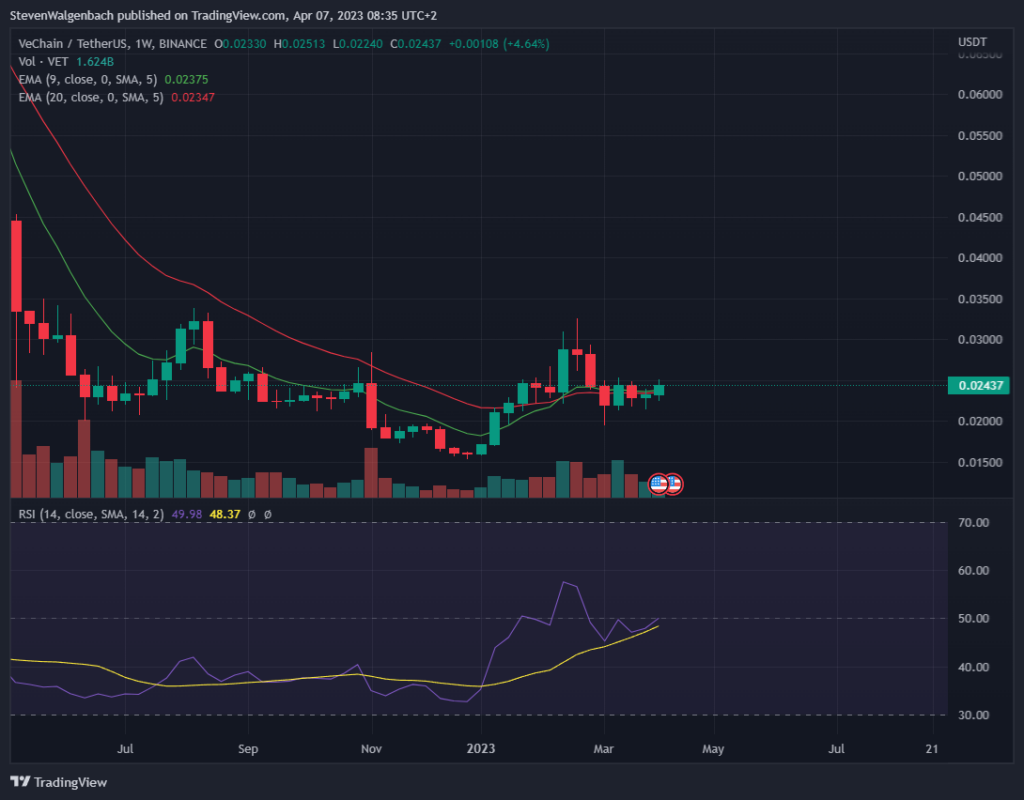
VET’s chart has also recently flagged bullish with the weekly RSI line positioned above the weekly RSI SMA line. Furthermore, the altcoin’s price has broken above the 9 and 20-week EMA lines in the latest weekly candle. Traders may want to wait for VET’s price to break the resistance level at $0.03 before entering into a medium-term long position for VET.
Theta Network (THETA)
Last on the list is THETA, which printed a 24-hour loss of 1.52%. This has brought its price down to $1.07 at press time. Much like many of the other altcoins on this list, THETA’s weekly performance remains in the green despite the 24-hour loss. THETA’s total weekly gain is around 5.60% presently.
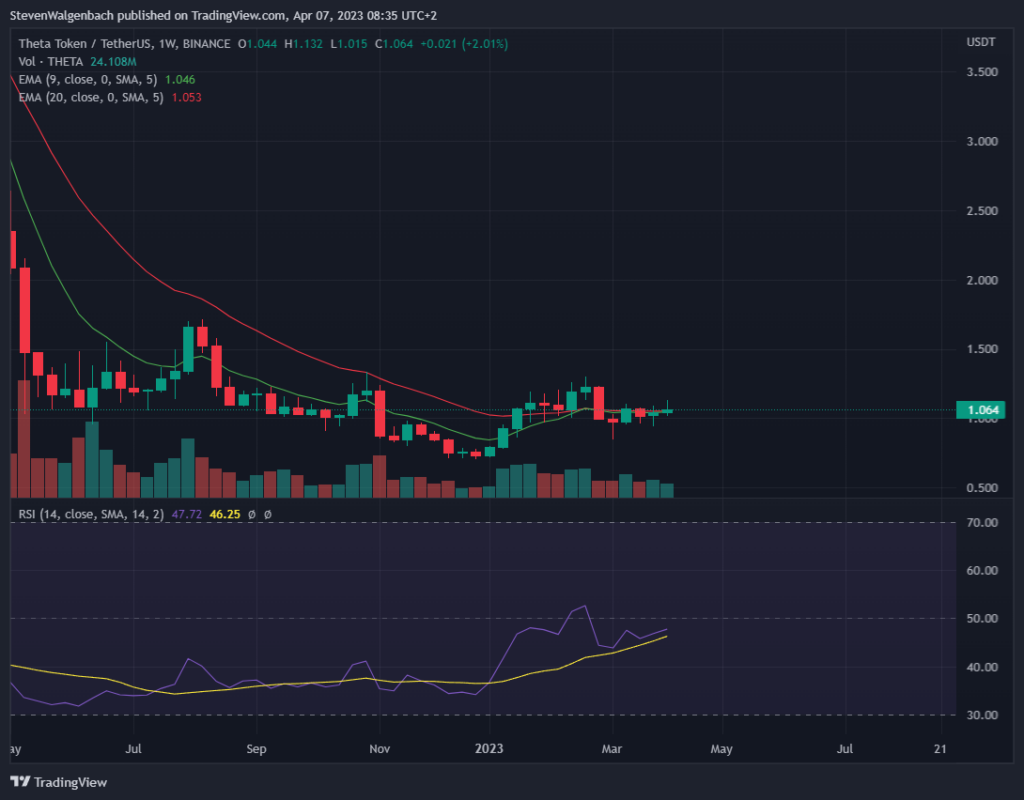
Although THETA’s chart has flagged bullish recently with the 9-week EMA line crossing above the longer 20-week EMA line, there is still doubt from a technical perspective as to whether or not THETA has entered into a medium-term bullish cycle.
The reason for this is that there is a slim margin between the weekly RSI and weekly RSI SMA lines. Furthermore, there is a very narrow margin that exists between THETA’s 9-week EMA line and THETA’s 20-week EMA line.
A potential confirmation that THETA has entered into a bullish cycle will be when its price breaks above the weekly resistance level at around $1.303.
Disclaimer: The views and opinions, as well as all the information shared in this price analysis, are published in good faith. Readers must do their own research and due diligence. Any action taken by the reader is strictly at their own risk. Coin Edition and its affiliates will not be held liable for any direct or indirect damage or loss.
Disclaimer: The information presented in this article is for informational and educational purposes only. The article does not constitute financial advice or advice of any kind. Coin Edition is not responsible for any losses incurred as a result of the utilization of content, products, or services mentioned. Readers are advised to exercise caution before taking any action related to the company.


