


 Price Prediction 2024-2030: Will DOT Price Hit $15 Soon?")
- Polkadot’s DOT rebounded to $4.70, signaling a potential bullish reversal towards $11.
- Coin Edition predicts DOT could exceed its all-time high of $55 by 2029.
- DOT’s price predictions for 2024-2030 range from $3.50 to $70, reflecting market optimism.
As the global crypto market hovers around the $2.01 trillion mark, altcoins are experiencing a sudden surge in supply. Despite Monday’s epic crash, market optimism remains strong, with Polkadot (DOT) rebounding to the $4.70 support level, presenting a promising buy-the-dip scenario.
As DOT edges closer to the $5.3 threshold, signals of a bullish reversal emerge, suggesting a potential rally toward the psychological $11 mark. This prompts a critical consideration: Is Polkadot a worthwhile investment?
Coin Edition’s Polkadot price prediction for 2024–2030 explores DOT’s prospects, analyzing recent price movements and overall network growth.
Table of contents
- Polkadot (DOT) Real-Time Market Status
- What is Polkadot (DOT)?
- Polkadot (DOT) Current Market Status
- Polkadot (DOT) Price Analysis 2024
- Polkadot (DOT) Price Prediction 2024–2030 Overview
- Polkadot (DOT) Price Prediction 2024
- Polkadot (DOT) Price Prediction 2025
- Polkadot (DOT) Price Prediction 2026
- Polkadot (DOT) Price Prediction 2027
- Polkadot (DOT) Price Prediction 2028
- Polkadot (DOT) Price Prediction 2029
- Polkadot (DOT) Price Prediction 2030
- Polkadot (DOT) Price Prediction 2040
- FAQs
Polkadot (DOT) Real-Time Market Status
HTTP Request Failed... Error: file_get_contents(https://pro-api.coinmarketcap.com/v2/cryptocurrency/quotes/latest?slug=polkadot-new): Failed to open stream: HTTP request failed! HTTP/1.1 429 Too Many Requests
What is Polkadot (DOT)?
Polkadot (DOT) is a decentralized protocol that links diverse networks like Bitcoin and Ethereum, enabling seamless transfer of value and data. This advanced protocol emphasizes speed and scalability through its unique “parachains,” which offload much of the main chain’s processing, enhancing efficiency.
At the heart of Polkadot lies the DOT token, which is vital for governance and staking. DOT holders influence future protocol developments while staking secures the network and facilitates the issuance of new tokens. Moreover, DOT is available on major exchanges like Coinbase, offering significant opportunities for investors.
In essence, Polkadot envisions a future where blockchain networks are interconnected, paving the way for a more efficient and integrated digital ecosystem. The promise of such interconnectedness keeps the crypto world buzzing with anticipation.
Polkadot (DOT) Current Market Status
After Monday’s historic plunge, the DOT token’s price plummeted to a weekly low of $3.65, down from its opening price of $5.30. This level, however, acted as a strong support, propelling DOT upward and stabilizing above the $4.70 mark, representing a significant 33% recovery.
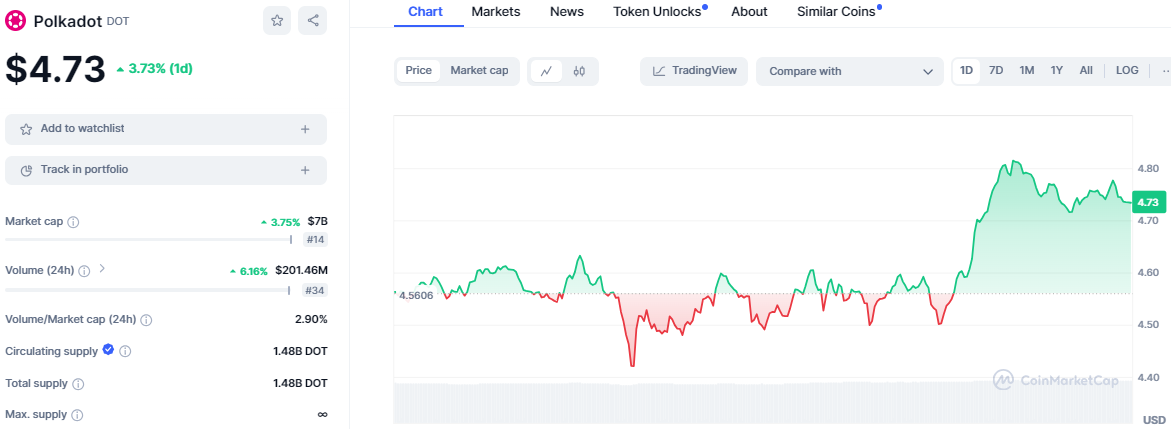
Currently, DOT is trading at $4.73, reflecting a 3.73% increase over the past 24 hours. With a circulating supply of 1.48 billion tokens, DOT’s market capitalization has soared to $7 billion, securing its position as the 14th largest cryptocurrency by market cap.
Additionally, the 24-hour trading volume has shown encouraging signs, climbing by 6.16% to reach $201.46 million, indicating heightened investor interest and trading activity in the token.
Polkadot (DOT) Price Analysis 2024
Following a recent rebound, Polkadot’s DOT is emerging as a formidable player in the crypto arena as investor confidence rises, suggesting a potential for continued growth. This prompts the question: can DOT maintain its upward trajectory and climb higher in the market rankings? Let’s find out in Coin Edition’s technical analysis section.
Polkadot (DOT) Price Analysis – Bollinger Bands
Polkadot (DOT) is witnessing an expansion in its Bollinger Bands on the daily chart, signaling heightened volatility in its value. The current trading price of DOT, situated at $4.193, is notably distant from the lower band, hinting at a brewing short-term reversal.
Should this bullish sentiment gain momentum, we could see DOT’s price climb towards the middle band, which lies around the $5.423 mark, and potentially aim for the upper band at $6.654.
Polkadot (DOT) Price Analysis – Relative Strength Index
The RSI index presents a similar outlook. On the one-day chart, the RSI is rebounding from oversold conditions, indicating a potential shift in momentum, favoring a bullish trend in DOT’s price.
Currently, at 35.23 and above the signal line, the RSI suggests ample space for an upward movement, creating an ideal buy-the-dip opportunity. If this momentum continues, DOT’s price could approach the $6 mark.
Polkadot (DOT) Price Analysis – Moving Average Convergence Divergence
The MACD indicator hints at a potential momentum shift, though it remains somewhat subdued. Moreover, the histogram aligns with this outlook, with its bars slowly approaching the zero line, signaling an upcoming crossover.
Despite this, the MACD currently sits at 0.406 below the zero and signal lines, indicating a prevailing bearish sentiment for the DOT token.
Polkadot (DOT) Price Prediction 2024–2030 Overview
| Price Prediction | Potential Low ($) | Potential High ($) |
| 2024 | $3.50 | $11.89 |
| 2025 | $8.00 | $23.86 |
| 2026 | $6.73 | $13.55 |
| 2027 | $18.00 | $31.00 |
| 2028 | $23.86 | $48.90 |
| 2029 | $30.00 | $55.00 |
| 2030 | $49.99 | $70.00 |
| 2040 | $78.90 | $100.90 |
Polkadot (DOT) Price Prediction 2024
Technically, the DMI indicator paints an intriguing picture of the DOT token. With an ADX reading of 23.2344, the market exhibits moderate trend strength. Nevertheless, a closer look reveals a stark contrast between the +DI at 11.2811 and the -DI at 30.4222, highlighting a strong bearish momentum and indicating that sellers currently dominate the market.
If this bearish trend continues, DOT might retest its recent low near the $3.5 level, seeking support. Conversely, should the bulls regain control, the market could drive DOT’s price upwards, potentially surpassing this year’s high of $11.89, a level last seen on March 11.
Polkadot (DOT) Price Prediction 2025
According to Coin Edition’s Polkadot price prediction, DOT might hit a March 2022 high of around $23.86 due to increased adoption and post-2024 BTC halving effects. However, market corrections could bring it down to $8. Overall, bullish trends are expected.
Polkadot (DOT) Price Prediction 2026
In 2026, market corrections from diminished BTC halving hype and consolidation might cause DOT to dip to $6.73. However, Coin Edition predicts it could also reach a high of $13.55, driven by market optimism.
Polkadot (DOT) Price Prediction 2027
Coin Edition predicts DOT could reach a high of $31, driven by market rebound and anticipation of the 2028 BTC halving. The potential low is estimated at $18, reflecting investor caution and market volatility.
Polkadot (DOT) Price Prediction 2028
According to Coin Edition, DOT may rise to $48.90 by 2028, boosted by the BTC halving and heightened market activity. Alternatively, it could fall to around $23.86, influenced by fluctuating market conditions and trading volumes.
Polkadot (DOT) Price Prediction 2029
Our Polkadot’s price predictions anticipate DOT could surpass its all-time high of $55, supported by strong community backing. A potential low of $30 is also forecasted, reflecting sustained bullish trends from the 2028 BTC halving effects.
Polkadot (DOT) Price Prediction 2030
In 2030, continued growth and maturation of the crypto market could drive the price to a new all-time high around the $70 threshold. Nonetheless, potential market corrections might see it dip to $49.99.
Polkadot (DOT) Price Prediction 2040
In 2040, DOT could reach a high of $100.90, reflecting long-term growth and mainstream adoption. Considering market stability and technological advancements, potential lows might be around $78.90.
FAQs
Polkadot (DOT) is a decentralized protocol connecting multiple blockchain networks, enhancing interoperability and scalability through parachains.
You can buy DOT on major cryptocurrency exchanges like Coinbase by creating an account, depositing funds, and purchasing DOT.
Polkadot is considered a strong investment due to its innovative technology, potential for growth, and market optimism.
DOT’s all-time high was $55.
Yes, DOT is expected to surpass the $5 mark by this August should market optimism persist in the near term.
The circulating supply of DOT is 1.48 billion tokens.
Predictions indicate DOT could surpass its all-time high of $55 by 2029.
The recent low for DOT was $2.69.
Dr. Gavin Wood founded Polkadot.
The Polkadot project was launched in 2016 and its native token, DOT, was introduced in the market in August 2020.
DOT can be stored in digital wallets like Ledger and Trezor or exchange wallets like Coinbase.
DOT is predicted to range between $3.50 and $11.89 in 2024.
In 2025, DOT’s price is expected to be between $8.00 and $23.86.
For 2026, DOT’s price prediction ranges from $6.73 to $13.55.
2027 DOT is predicted to be between $18.00 and $31.00.
By 2028, DOT’s price could range from $23.86 to $48.90.
DOT is expected to be between $30.00 and $55.00 in 2029.
In 2030, DOT’s price is predicted to range from $49.99 to $70.00.
By 2040, DOT could reach between $78.90 and $100.90.
Disclaimer: The information presented in this article is for informational and educational purposes only. The article does not constitute financial advice or advice of any kind. Coin Edition is not responsible for any losses incurred as a result of the utilization of content, products, or services mentioned. Readers are advised to exercise caution before taking any action related to the company.


