


- The immediate support at $7.05 was a buy signal for NEAR as the price might retest $9.
- ROSE sellers were exhausted while GLM’s price might decline to $0.51.
- ORAI might rally by 18.33% but OCEAN’s upswing depends on buying pressure.
In the last 30 days, tokens with Artificial Intelligence (AI) and Big Data fundamentals have been on the radar of traders. But not many market participants are keeping an eye on the developments within each ecosystem.
According to crypto on-chain tool ‘Santiment’, five of the top AI-themed projects with high development activity include NEAR Protocol (NEAR), Oasis Protocol (ROSE), Golem (GLM), Oraichain (ORAI), and Ocean Protocol (OCEAN).
For those unfamiliar, development activity tracks public GitHub activity that a project has. When the metric decreases, it implies that developers are not shipping out a lot of features on the network.
However, the surge in the development activity of the projects above implies that there is more brain power concentrated on them as developers believe that they would be successful. Typically, this is a bullish signal. However, it is also important to address how their prices have performance and what potential they have.
NEAR Protocol (NEAR)
NEAR recently tapped a $9 high on March 14. But the 4-hour chart showed that traders began taking profits at that level. As a result, bulls were unable to defend the support at $7.77. At press time, NEAR’s price was $7.57, indicating that selling pressure had reduced.
However, bulls need to watch out for the $7.05 immediate support. If NEAR closes below this area, the price might slide to $6.65. On the other hand, a break above this point could send the token back in the $9 direction.
Interestingly, the Supertrend indicator revealed that a buy signal was at the immediate support. Therefore, if the price of NEAR drops to $7.05, entries around the region could be profitable as the token might rebound to the $9 region.

Furthermore, the Relative Strength Index (RSI) had dropped below the midpoint, suggesting a bearish momentum. Should the RSI reading climb above 50.000, NEAR’s price might bounce before it hits $7.05. But a declining momentum might send the value downwards before a rally returns.
Oasis Protocol (ROSE)
The Tom DeMark (TD) Sequential on the ROSE/USD 4-hour chart indicated a buy signal. This technical analysis indicator identifies the exact time of trend exhaustion and potential price reversals.
Between March 12 and 15, there were about nine red candlesticks which indicated sellers’ dominance. However, press time data revealed that bulls capitalized on the fatigue and built support at $0.154.
As it stands, ROSE looked set to break through the $0.167 overhead resistance. At press time, the Awesome Oscillator (AO) was negative, suggesting increasing downward momentum. But the AO flashed green histogram bars, indicating that a bullish trend reversal was on the cards.
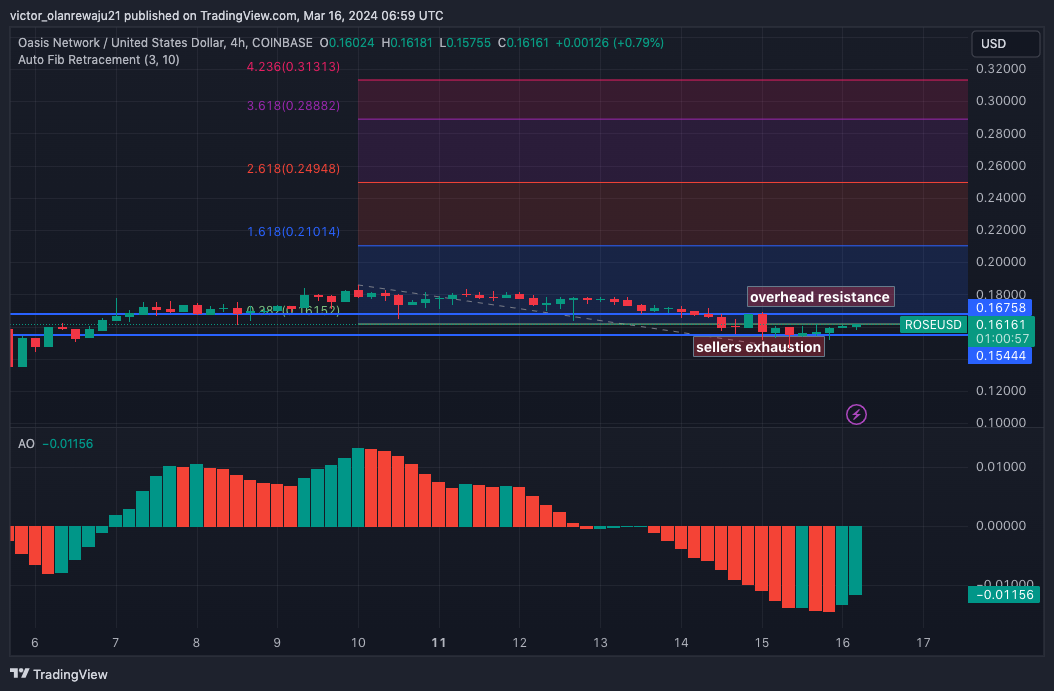
If the bullish momentum continues, the Fibonacci extension revealed that ROSE’s price could increase exponentially. In a highly bullish scenario, ROSE might get close to $0.32
Golem (GLM)
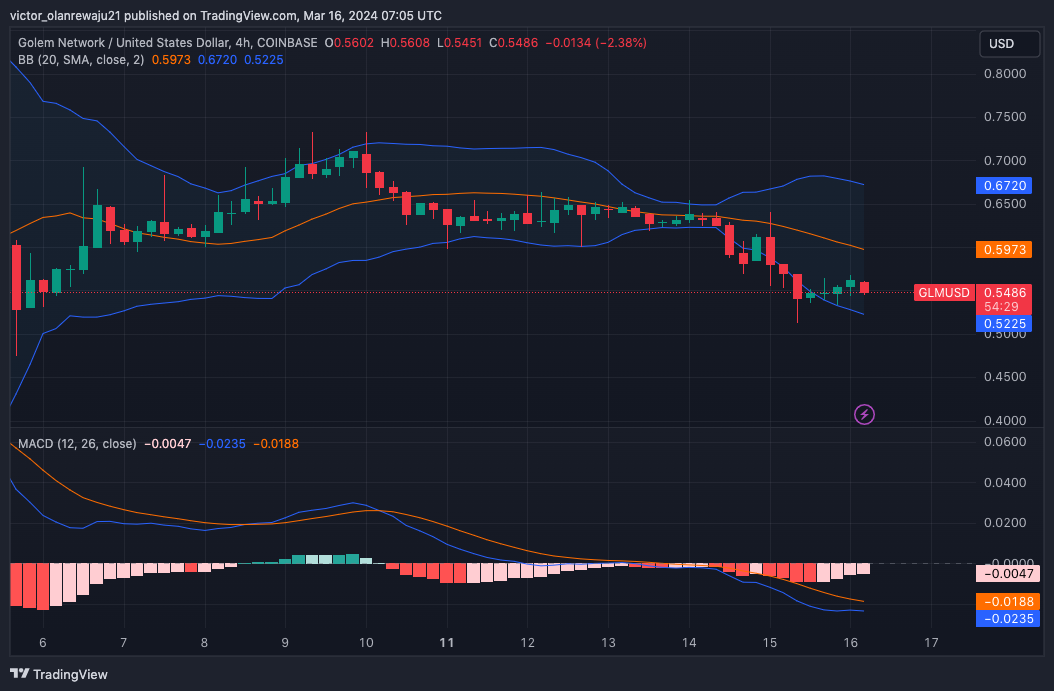
From a technical perspective, the Bollinger Bands (BB) on the 4-hour GLM/USD showed that the token was oversold. This was because the lower band of the BB taped GLM at $0.54.
Being oversold means that the price of the cryptocurrency can bounce northward as the BB supported this. As of this writing, the BB indicated high volatility, and showed that the token could extend toward $0.67 in the short term.
But the potential upswing might take a while as the Moving Average Convergence Divergence (MACD) was negative. A negative MACD implies that sellers had overpowered buyers. Therefore the price could trend downwards.
In a highly bearish case, GLM’s price might drop to $0.51. Should this happen, buying pressure might fuel the hike that could send the token as high as $0.80.
Oraichain (ORAI)
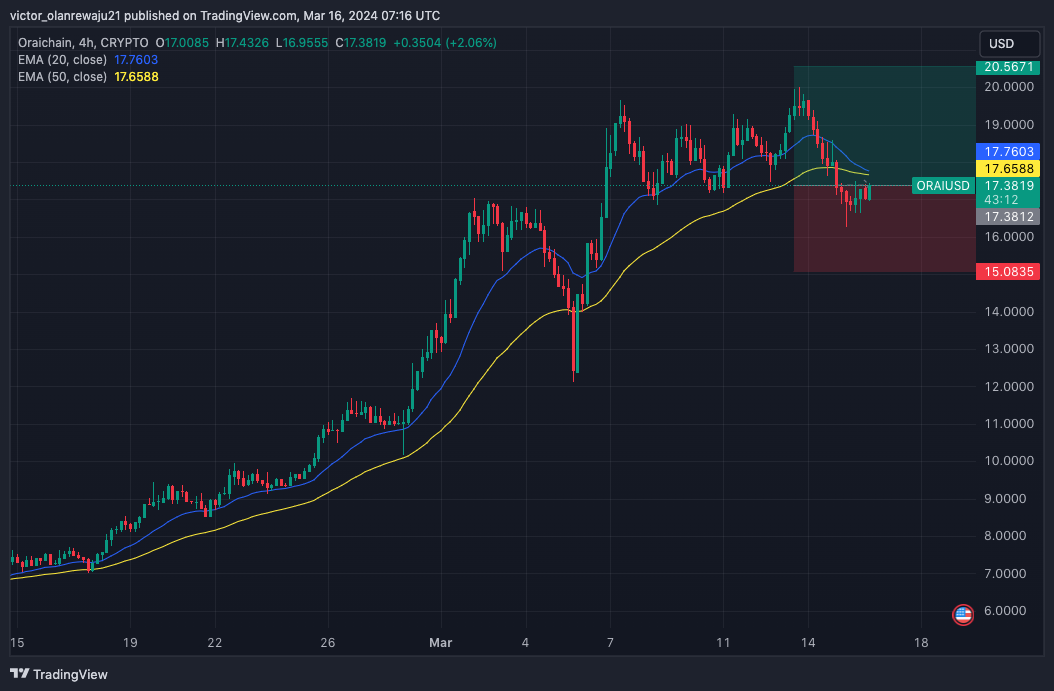
ORAI’s price has increased by 143.57% in the last 30 days. However, that upward momentum has been stopped by profit-taking. At press time, the token changed hands at $17.40.
Coin Edition then looked at the Exponential Moving Average (EMA). As of this writing, there was almost no divergence between the 20 EMA (blue) and 50 EMA (yellow). This indicates that ORAI might consolidate in the short term.
At that same time, bulls seemed ready to drive the token above the EMAs. If this is successful, a bullish thesis might be confirmed and ORAI might ride on an 18.33% increase which could take it to $20.56.
Ocean Protocol (OCEAN)
As of this writing, bears had tugged back OCEAN’s price to $1.11. The 4-hour analysis also showed evidence of intense selling pressure as red candlesticks dominated that chart.
However, OCEAN could be on the verge of an upside return, according to indications from the Money Flow Index (MFI). At press time, the MFI reading was 23.56, meaning that the token had experienced a large outflow of capital.
If the MFI drops to 20.00, then OCEAN could be tagged oversold. Should buying pressure also come in at this time, the value of the token might retest $1.40.
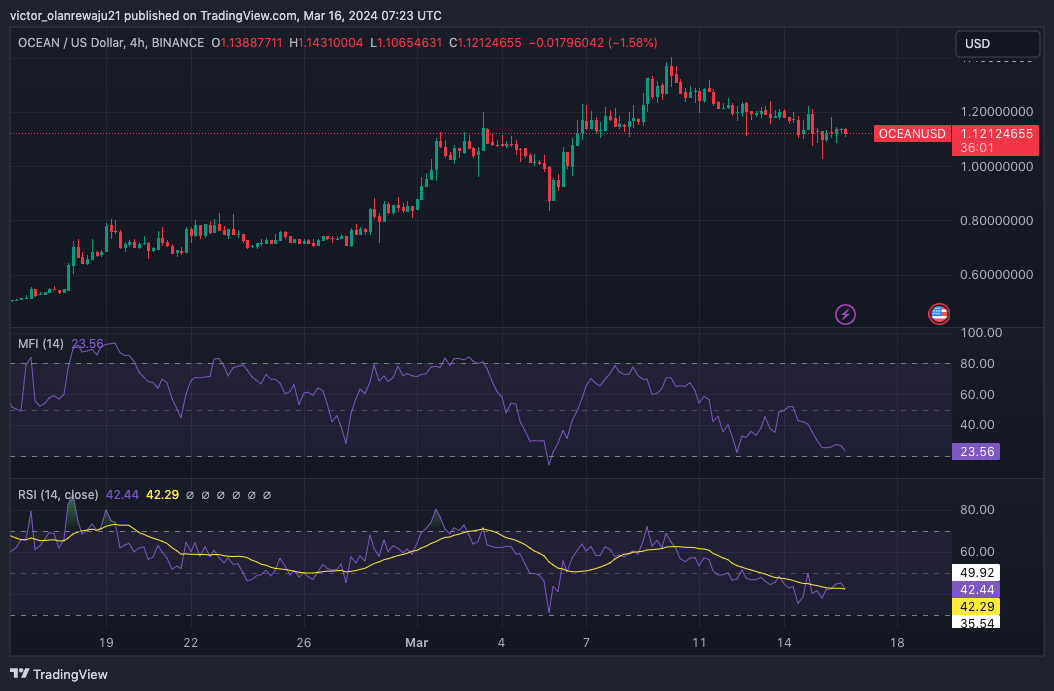
Like the MFI, the RSI also showed a weak buying momentum, suggesting that OCEAN might drop below $1 before the upswing.
Disclaimer: The information presented in this article is for informational and educational purposes only. The article does not constitute financial advice or advice of any kind. Coin Edition is not responsible for any losses incurred as a result of the utilization of content, products, or services mentioned. Readers are advised to exercise caution before taking any action related to the company.


 at its $25 Infancy, Say Analysts")

