


- The KDA market’s recent bull rise has been forecast to continue, according to recent research.
- The price of KDA might surge if it breaks over the $1.06 barrier mark.
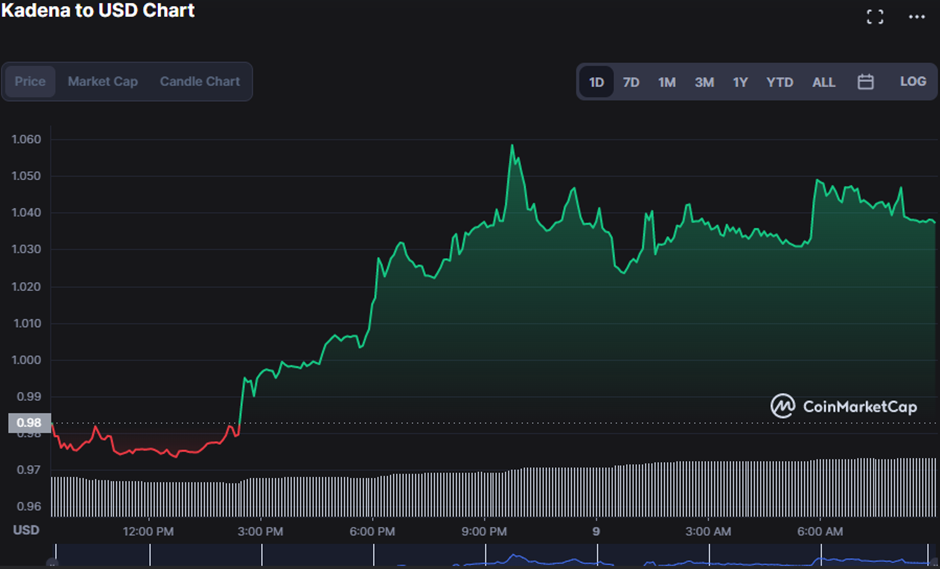
- Within the recent day, the $0.9734 level has provided support for the KDA market.
The Kadena (KDA) market started the day at $0.9828, with the bears exerting pressure on the price. Throughout this rising trend, the price of KDA was constrained to a range of $0.9734 to $1.06. As of press time, bulls had succeeded in getting prices up by 7.28% to $1.05
This positive momentum on the KDA market was further supported by a 6.62% rise in market capitalization and a 49.50% spike in the 24-hour price chart, indicating greater market volatility and raising the likelihood of a break-out.
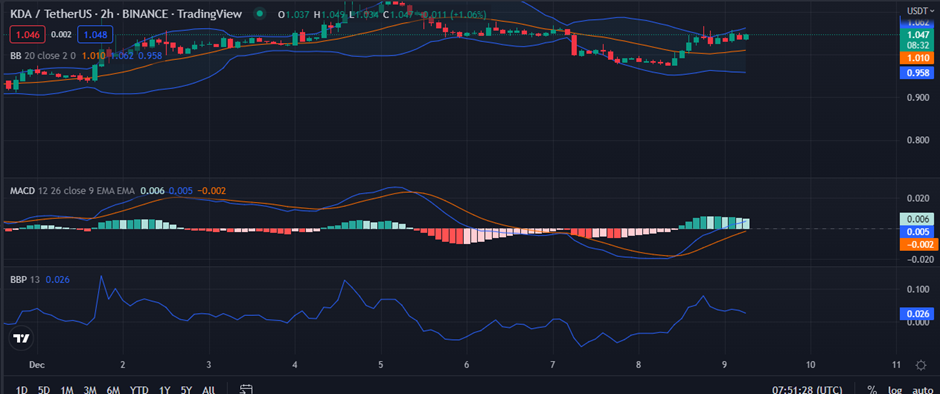
This upward trend in the KDA market is supported by the fact that the Bollinger Bands are widening, with the upper band recently approaching 1.061 and the lower band recently touching 0.939. As the price moves closer to the top band, it adds fuel to the fire for the uptrend.
The MACD blue line on the 2-hour price chart also projects a bullish momentum as it trends in the positive zone and above the signal line with a value of 0.004. This positive trend in the KDA market is further supported by the histogram trend in the positive region.
With a score of 0.027, the Bull Bear Power (BBP) is positively trending, reinforcing the assumption that bull power is growing and giving traders hope for significant growth.
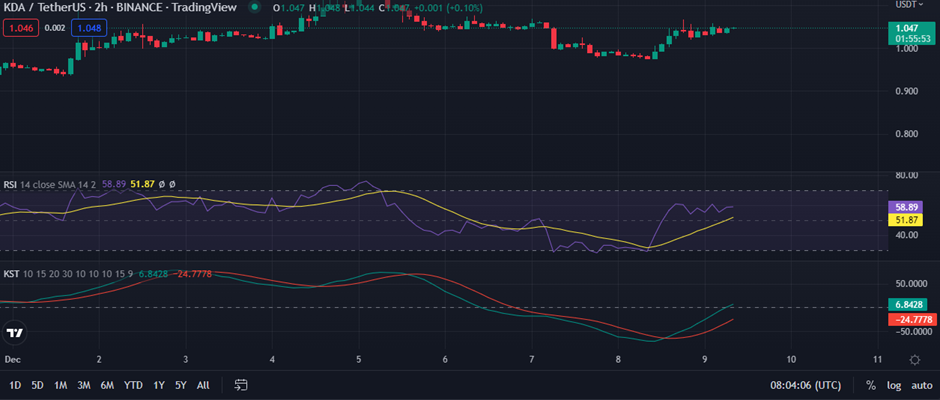
The Relative Strength Index (RSI) value of 59.17 indicates that this market trend has yet to reach its peak since it has not yet reached the overbought region. Its rising inclination suggests that bull domination will continue in the Kadena (KDA) market.
With the Know Sure Thing (KSI) trending above its SMA line at 6.67, this bullish control is expected to continue as bull vigor intensifies.
The bulls in the Kadena (KDA) market need to fight to maintain the resistance level and the current price levels if the existing positive trend is to continue.
Disclaimer: The views and opinions, as well as all the information shared in this price analysis, are published in good faith. Readers must do their own research and due diligence. Any action taken by the reader is strictly at their own risk, Coin Edition and its affiliates will not be held liable for any direct or indirect damage or loss
Disclaimer: The information presented in this article is for informational and educational purposes only. The article does not constitute financial advice or advice of any kind. Coin Edition is not responsible for any losses incurred as a result of the utilization of content, products, or services mentioned. Readers are advised to exercise caution before taking any action related to the company.
 Price Prediction: Can BTW Sustain Its Breakout Above $0.1032?")


