
- XRP has plunged 80% from its all-time high.
- Recent court ruling sparks hope for a potential recovery.
- Technical indicators suggest XRP may be oversold.
XRP has faced numerous challenges since its all-time high in January 2018. At the moment, XRP is trading below 80% of its historical value and remains in a rather volatile environment. But there are still hopeful signs indicating what could be a pathway to future recovery.
New events, such as the recent court ruling, might be the trigger to help XRP break out of the long-term downward trend. As of press time, XRP is trading at $0.5743, reflecting a 2.92% decline over the past 24 hours.
In the last 24 hours, it has become evident that the price of Ripple or XRP has been on a decline. It dropped to as low as about $0.56 before slightly rising to its current position. This decline further emphasizes the current situation in the market today as XRP has remained relatively stagnant and unable to hold a price above the $0.59 mark.
Nevertheless, the key resistance level that can be traced for XRP is approximately $0. 56. This point has been key because the price has bounced from this level during the trading day. If XRP goes below $0.56, it may continue to go lower, with the next support level likely to be at $0.54. This psychological barrier and previous price action support suggest that a sustained fall below $0.56 could result in deeper slumps.
Conversely, resistance levels are equally important in determining XRP’s potential recovery. The $0.59 mark represents a recent high and a key resistance point. For a bullish reversal to occur, XRP would need to break through this level with strong momentum.
Additionally, the $0.60 level represents a significant psychological barrier that could challenge any upward movement. Should XRP surpass both of these resistance points, the next notable resistance lies at $0.62, where previous selling pressure has been observed.
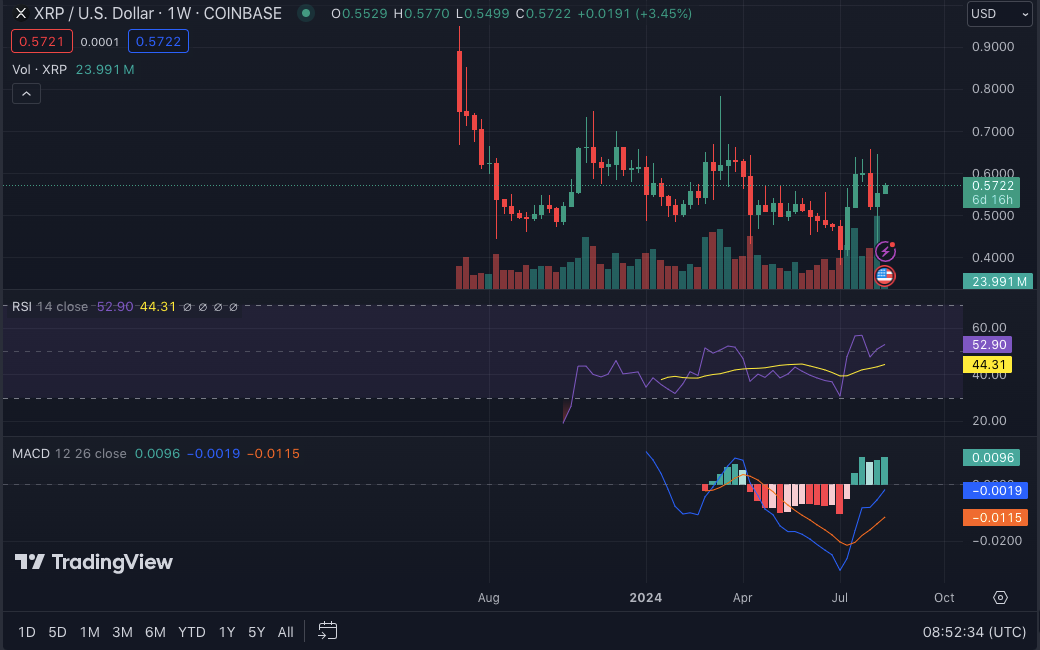
XRP/USD 1-week price chart, Source: Trading view
In terms of technical indicators, the 1-week RSI reads 52.99, positioning XRP in a neutral zone regarding overbought or oversold conditions. Meanwhile, the 1-week MACD trading above the signal line hints at emerging bullish momentum, although it is not yet decisive.
Disclaimer: The information presented in this article is for informational and educational purposes only. The article does not constitute financial advice or advice of any kind. Coin Edition is not responsible for any losses incurred as a result of the utilization of content, products, or services mentioned. Readers are advised to exercise caution before taking any action related to the company.


