
 Price Prediction 2025-2030: Key Levels, Market Trends, and Future Growth Analysis")

- Test (TST) surged over 2,000% following its unexpected rise from a BNB Chain tutorial, making it a unique meme coin in the BSC ecosystem.
- Price projections indicate a potential high of $0.2142 in 2025, with resistance at $0.1886 being a key breakout level for future gains.
- TST remains a community-driven token with no official roadmap, relying on market sentiment and speculative trading for price movements.
Test (TST) is a meme coin created by the BNB Chain team to demonstrate how users can launch their own tokens on the BNB Smart Chain (BSC). Originally intended as an educational tool, TST unexpectedly gained widespread attention after its details were revealed in a tutorial video, which led to a sudden increase in trading activity. The token follows the BEP-20 standard, ensuring fast transactions and minimal fees within the BSC ecosystem.
TST was introduced as a simple demonstration token, showing how new tokens can be deployed quickly using the Four.meme platform. The token’s details were showcased in an official BNB Chain tutorial, and despite no official promotion, it caught the interest of traders, leading to high demand and market speculation. After the sudden price surge, the tutorial video was deleted, and the wallet’s private key was removed, ensuring no centralized control over the token.
Following its exposure, TST experienced an extraordinary price increase, reportedly surging over 2,000% within a weekend. This rapid rise was mainly fueled by community hype and speculative trading, a trend commonly seen in meme coins. Unlike major cryptocurrencies, TST does not have a structured roadmap or a dedicated development team, making it a purely community-driven token.
Despite its unexpected growth, TST is not an official Binance or BNB Chain product. The token remains freely tradable, primarily on decentralized exchanges like PancakeSwap, where users can buy, sell, and provide liquidity for it.
Table of contents
- Test (TST) Price Prediction 2025-2030 Overview
- Key Features and Utility
- Bollinger Bands Analysis for Test (TST)
- MACD Analysis for Test (TST)
- Relative Strength Index (RSI) Analysis for Test (TST)
- Support and resistance levels for Test (TST)
- Test (TST) 2025 Price Prediction Analysis
- Test (TST) Price Prediction for 2026
- Test (TST) Price Prediction for 2027
- Test (TST) Price Prediction for 2028
- Test (TST) Price Prediction for 2029
- Test (TST) Price Prediction for 2030
- FAQs
Test (TST) Price Prediction 2025-2030 Overview
| Year | Minimum Price (USD) | Average Price (USD) | Maximum Price (USD) |
| 2025 | $0.1395 | $0.1766 | $0.2056 |
| 2026 | $0.1245 | $0.1572 | $0.1924 |
| 2027 | $0.1190 | $0.1555 | $0.1923 |
| 2028 | $0.1175 | $0.1535 | $0.1932 |
| 2029 | $0.1227 | $0.1625 | $0.2023 |
| 2030 | $0.1256 | $0.1676 | $0.2240 |
Key Features and Utility
- BEP-20 Token Standard: Ensures compatibility with wallets, decentralized exchanges, and DeFi applications within the BNB Chain ecosystem.
- No Transaction Taxes: Unlike other meme coins, TST has zero buy/sell tax, making it attractive for frequent traders.
- Community-Driven: There is no central authority, and its market movement depends entirely on trading interest and speculation.
- Limited Supply: TST has a maximum supply of 1 billion tokens, with 951 million currently in circulation.
Bollinger Bands Analysis for Test (TST)
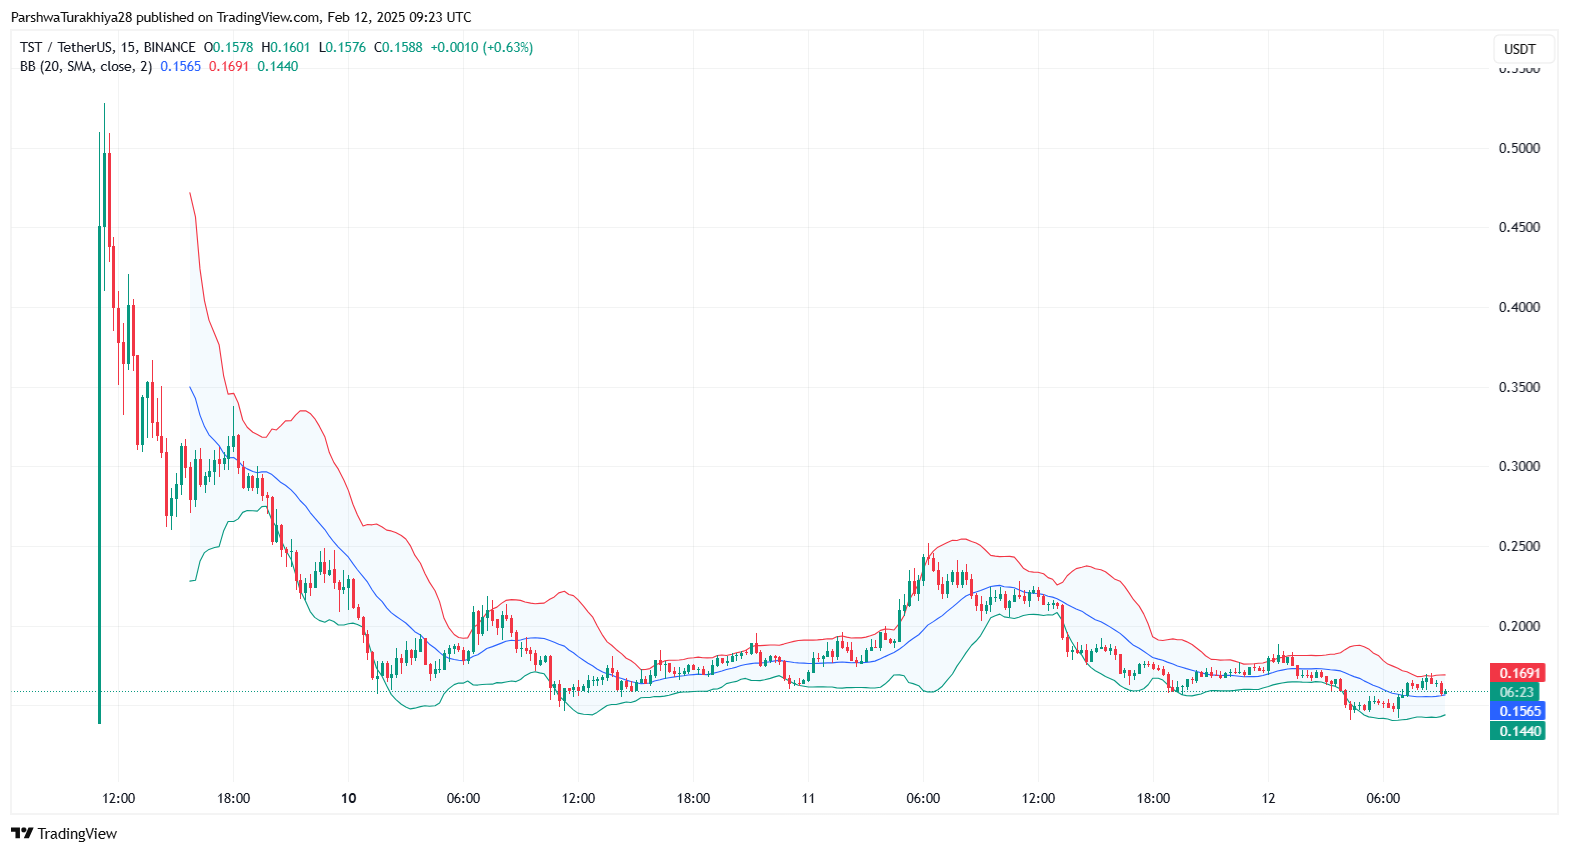
The Bollinger Bands analysis for TST/USDT on the 15-minute chart suggests a period of low volatility and consolidation after a sharp decline. The upper band is positioned at $0.1691, the lower band at $0.1440, and the middle band (20-period SMA) at $0.1565. The price is currently hovering around the middle band, indicating a phase of market indecision where buyers and sellers are finding equilibrium.
A breakout above the upper band could indicate a bullish trend continuation, suggesting increased buying momentum. However, if the price remains below the middle band and approaches the lower Bollinger Band, it may signal further downside pressure with a possible retest of lower support levels. The bands are currently contracting, which typically precedes a strong price movement in either direction. Traders should watch for a band expansion with volume confirmation to determine the next major price move.
MACD Analysis for Test (TST)

The MACD (Moving Average Convergence Divergence) indicator for TST/USDT on the 15-minute chart suggests a potential shift in momentum. The MACD line (blue) is at 0.0010, slightly above the signal line (orange) at -0.0002, indicating an early-stage bullish crossover. This suggests that buying pressure is increasing, which could lead to an upward price movement if the trend continues.
The MACD histogram has begun showing small green bars, signaling a possible recovery from previous bearish momentum. However, the histogram bars remain short, implying that the bullish momentum is still weak and requires further confirmation. If the MACD line continues to rise above the signal line and the histogram expands with stronger green bars, it could indicate further upside potential.
On the other hand, if the MACD line fails to sustain above the signal line and begins to curl downward, it could signify a false breakout, leading to renewed selling pressure. Traders should watch for confirmation from volume and resistance levels to validate any breakout.
Relative Strength Index (RSI) Analysis for Test (TST)
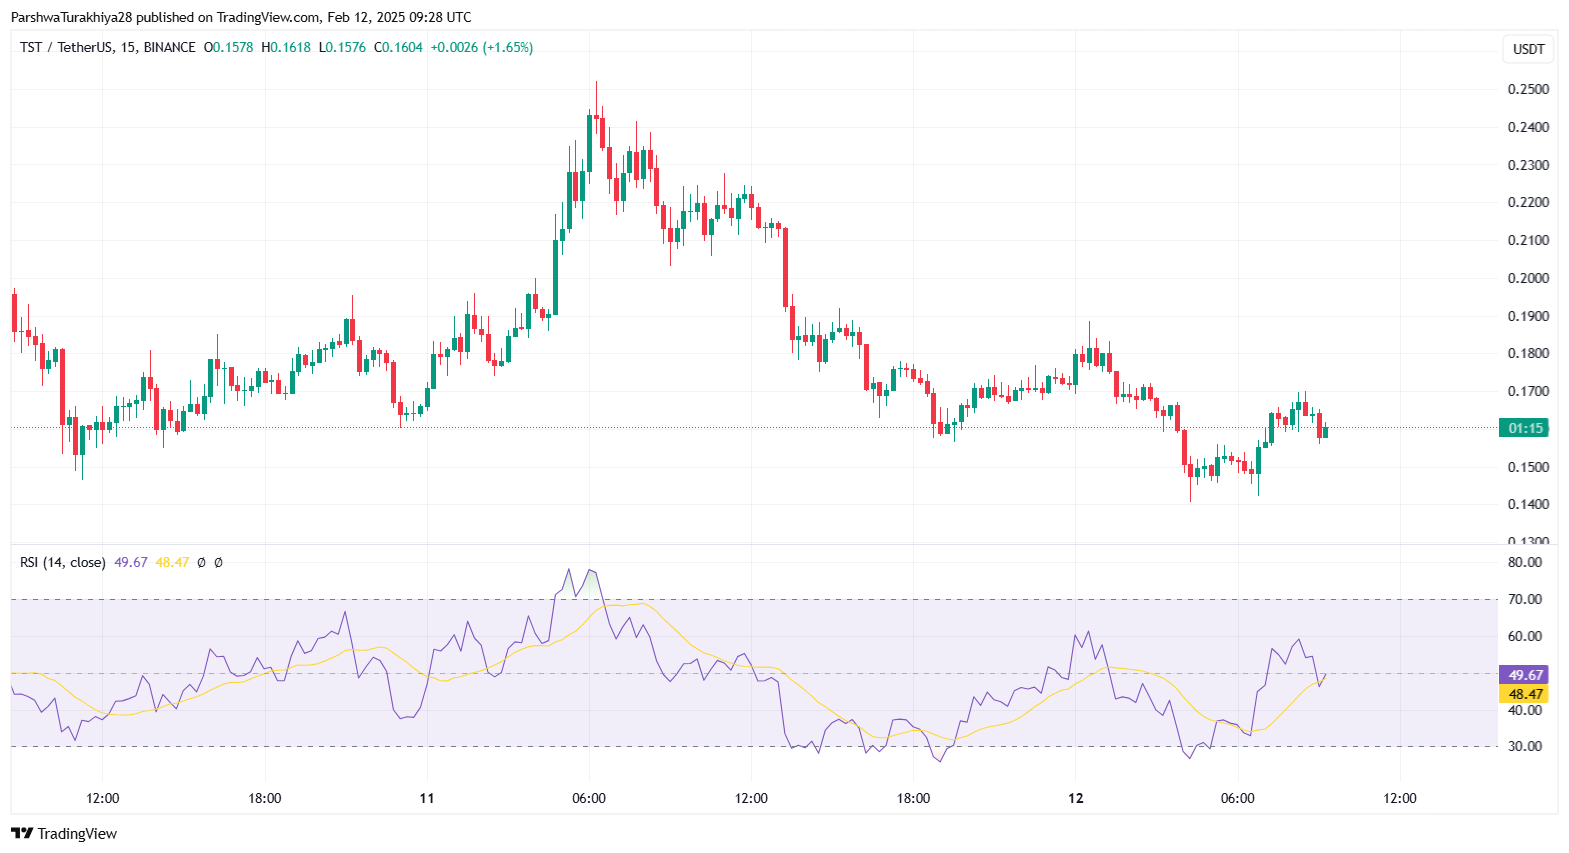
The Relative Strength Index (RSI) for TST/USDT on the 15-minute chart currently stands at 49.91, indicating a neutral momentum with no clear dominance from buyers or sellers. The RSI has recently rebounded from lower levels, suggesting that buying pressure is increasing. However, it remains below the 50 mark, meaning that bullish momentum is not yet strong enough to confirm an upward trend.
If the RSI continues to rise and crosses above 50, it could signal strengthening bullish sentiment, potentially leading to further price appreciation. A sustained move toward the 60-70 range would indicate stronger buying pressure, increasing the likelihood of testing resistance levels. Conversely, if the RSI starts declining and moves toward 40 or lower, it may suggest a shift back to bearish momentum, with sellers regaining control.
Support and resistance levels for Test (TST)
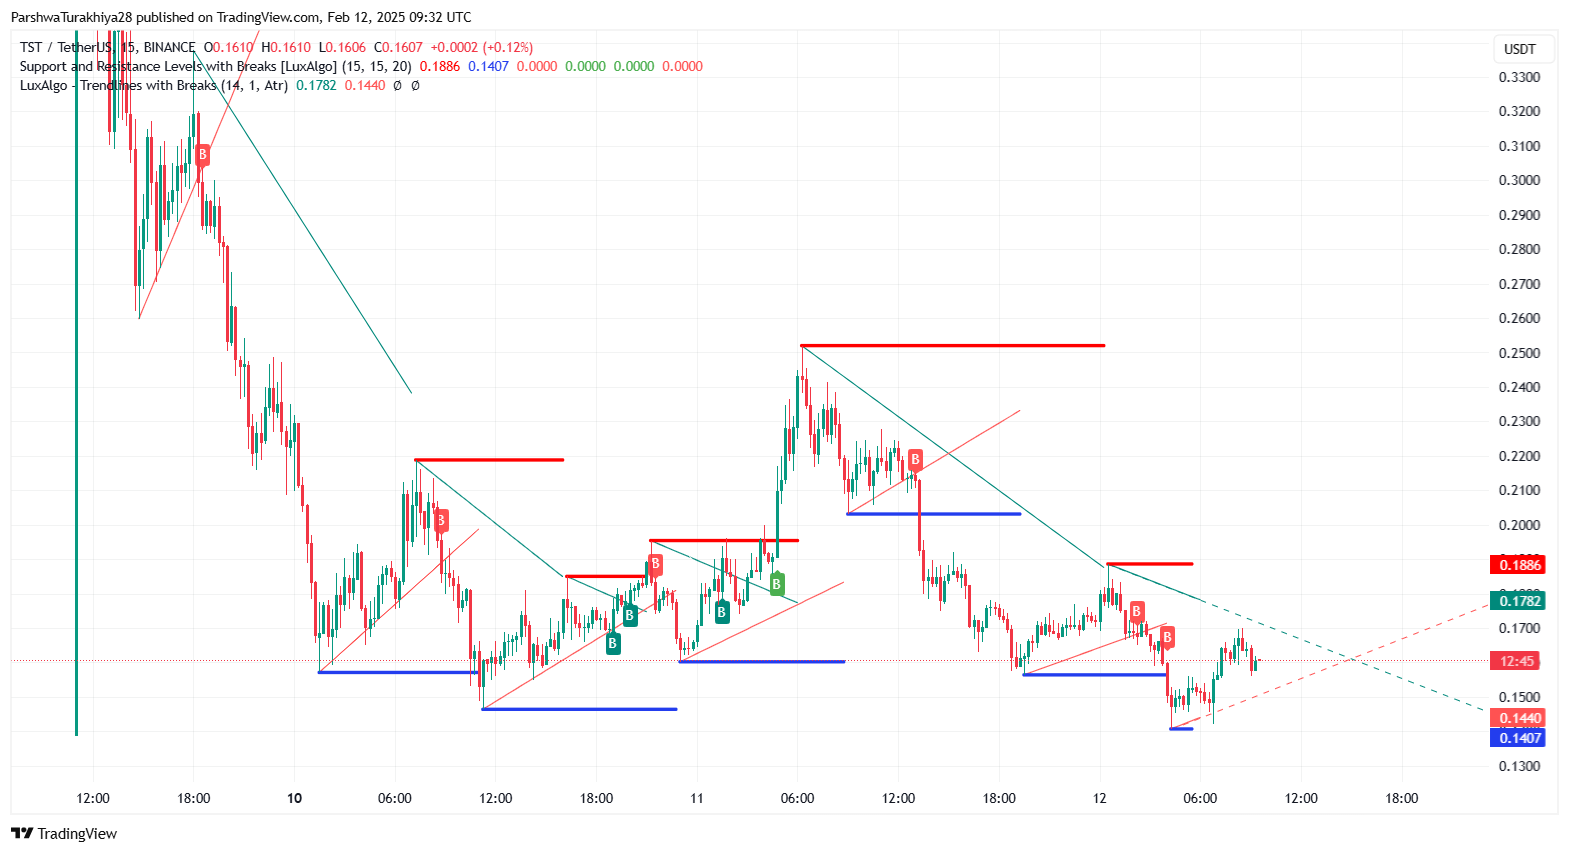
The support and resistance analysis for TST/USDT on Binance highlights key price levels that influence trading activity. The primary support level is established at $0.1407, where the price has previously found buyers and bounced back. If TST remains above this level, it could serve as a base for a potential upward move. A breakdown below this support could trigger further declines toward $0.1300, where additional demand might emerge.
On the resistance side, the immediate hurdle is around $0.1436, which has acted as a barrier in previous attempts to move higher. A breakout above this resistance could push the price toward $0.1787, where significant selling pressure is likely. The major resistance at $0.1886 represents a historically strong rejection point. A successful breach above this level would confirm bullish momentum and open the door for a rally toward $0.20 or higher.
The trendline analysis shows a pattern of lower highs, indicating a gradual decline, but the narrowing range suggests a potential breakout soon. Traders should closely monitor price action at support and resistance zones, watching for breakout confirmation or rejection signals before making trade decisions. If TST manages to sustain above $0.1605, it could indicate the beginning of a recovery phase, while failure to hold above support levels could extend the downtrend.
Test (TST) 2025 Price Prediction Analysis
In 2025, TST is projected to trade within a price range of $0.1395 (minimum), $0.1766 (average), and $0.2056 (maximum). Key support and resistance levels will play a crucial role in determining the price movement throughout the year. The immediate support zone is around $0.1407, which has previously held as a strong accumulation area. If TST sustains above this level, a steady recovery toward the $0.1605–$0.1787 range is likely. However, a breakdown below $0.1407 could push prices lower, possibly testing $0.1300, which would serve as the last strong support before further downside risks emerge.
On the upside, $0.1436 and $0.1787 are significant resistance points that TST must overcome for a bullish breakout. If the price manages to breach $0.1886, it could signal strong buying momentum, driving TST toward the $0.2142 maximum price projection. This level represents a key barrier, and a successful breakout above it would indicate a continuation of the upward trend, possibly setting the stage for new highs beyond the estimated range.
Market participants should closely monitor $0.1886 as a breakout zone and $0.1407 as a critical support level.
Test (TST) Price Prediction for 2026
TST is expected to trade between $0.1245 and $0.1924, with an average price of $0.1572. A steady market and increasing adoption could push the price towards resistance at $0.1924, while weak momentum could test support around $0.1220. Holding above $0.1400 would indicate potential for long-term growth.
Test (TST) Price Prediction for 2027
Projected levels suggest a minimum of $0.1190, an average of $0.1555, and a peak of $0.1923. If bullish sentiment strengthens, TST could test higher resistance, but failure to maintain above $0.1400 might result in sideways trading. Market trends and investor sentiment will play a key role in defining the price action.
Test (TST) Price Prediction for 2028
TST could fluctuate between $0.1175 and $0.1932, averaging around $0.1535. Breaking above $0.1800 would indicate strong accumulation, while failure to hold $0.1200 might lead to a bearish phase. Long-term holders could see opportunities in market dips.
Test (TST) Price Prediction for 2029
Expected to trade between $0.1227 and $0.2023, TST could establish a stronger position if it sustains above $0.1600. If bullish pressure builds, it may push toward the $0.2000+ range, though market volatility may cause periodic corrections.
Test (TST) Price Prediction for 2030
With projections ranging from $0.1256 to $0.2240, TST could aim for new highs if key resistance levels are broken. Sustained interest and market expansion could support an average price of $0.1676, while long-term investors may look at $0.1400 as a strong support zone for accumulation.
FAQs
TST is a meme coin created for an educational purpose by the BNB Chain team. It gained traction after being featured in a tutorial, sparking unexpected trading interest.
No, TST is not an official Binance token. It was introduced as a demo but is now freely traded on decentralized platforms.
Analysts estimate TST could trade between $0.1395 and $0.2056, with $0.1766 as the expected average price.
Major resistance points are $0.1436, $0.1787, and $0.1886. A breakout above these levels could push prices higher.
Market sentiment, speculative trading, and overall crypto trends will be major factors, as TST lacks a structured development roadmap.
TST is currently consolidating, with bands contracting, suggesting an imminent breakout either upward or downward.
A slight bullish crossover on MACD indicates early buying interest, but confirmation from volume and resistance breakouts is needed.
The RSI is near 50, indicating neutral momentum. A push above 60 could confirm bullish strength, while a drop below 40 might signal a downturn.
TST is mainly traded on PancakeSwap and other decentralized exchanges, with a circulating supply of 951 million tokens.
Since TST is primarily a meme coin with no fundamental utility, it is best suited for short-term speculative trading rather than long-term investment.
Disclaimer: The information presented in this article is for informational and educational purposes only. The article does not constitute financial advice or advice of any kind. Coin Edition is not responsible for any losses incurred as a result of the utilization of content, products, or services mentioned. Readers are advised to exercise caution before taking any action related to the company.


 price prediction.)