


- AAVE sees positive momentum and potential for upward movement.
- Traders should monitor the resistance levels and consider risk management measures.
- RSI and MACD indicators suggest a possible buying opportunity for AAVE.
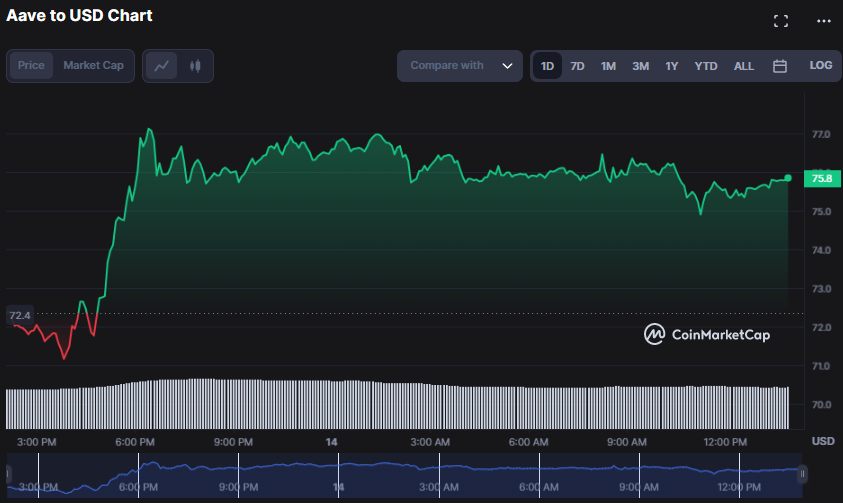
Aave (AAVE) prices have surged to a 7-day high of $77.21 after sustained advances over the previous 24 hours. The bears’ attempt to sink the market was thwarted as the AAVE market found support at the day’s low of $71.17. The AAVE price rose by 4.70% to $75.77 over the last 24 hours, at the time of writing.
Due to strong market demand for AAVE tokens and favorable investor sentiment regarding the project’s future development potential, market capitalization grew to $1,068,096,481, and 24-hour trading volume increased to $86,704,702.
If the bullish trend continues, AAVE might soon break beyond the $77.21 barrier, with the next resistance levels likely between $80 and $85. But, if bearish pressure continues, the crucial support levels to watch are $70 and $65.
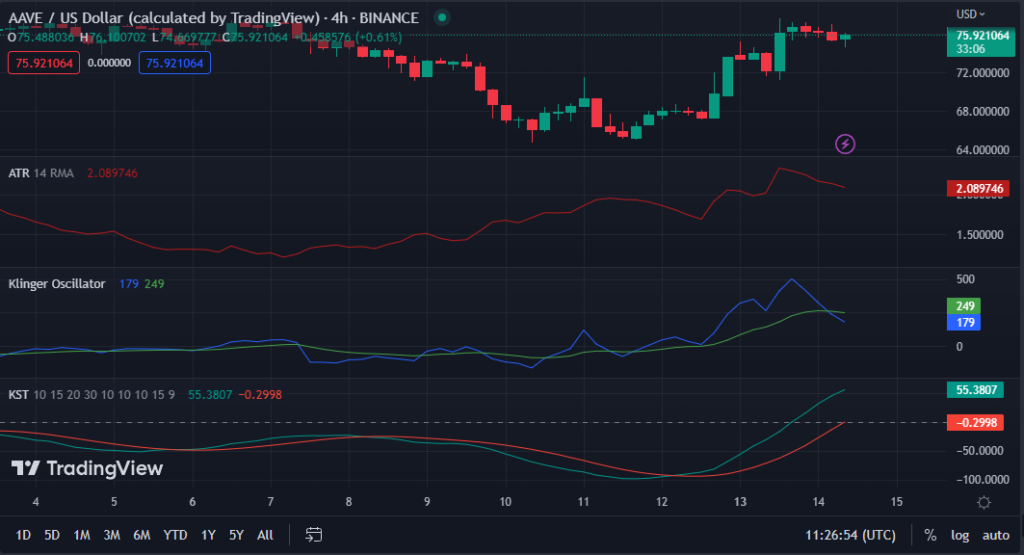
In the AAVE price chart, the ATR value of 2.087816 suggests that the AAVE price has lately been volatile. This movement may imply potential opportunities for traders willing to take additional risks.
Nevertheless, because the Klinger Oscillator generated a bearish crossover and fell below its signal line with a value of 181, the bullishness in AAVE may be waning. This motion cautions traders to closely monitor the trend and adopt risk management measures to protect their holdings.
While the Know Sure Thing (KST) indicator is reading 55.2231 and advancing northward, its bullish momentum partially counters the Klinger oscillator’s negative sentiment. This notion is apparent since this motion suggests that AAVE may still have some upward potential in the short term.
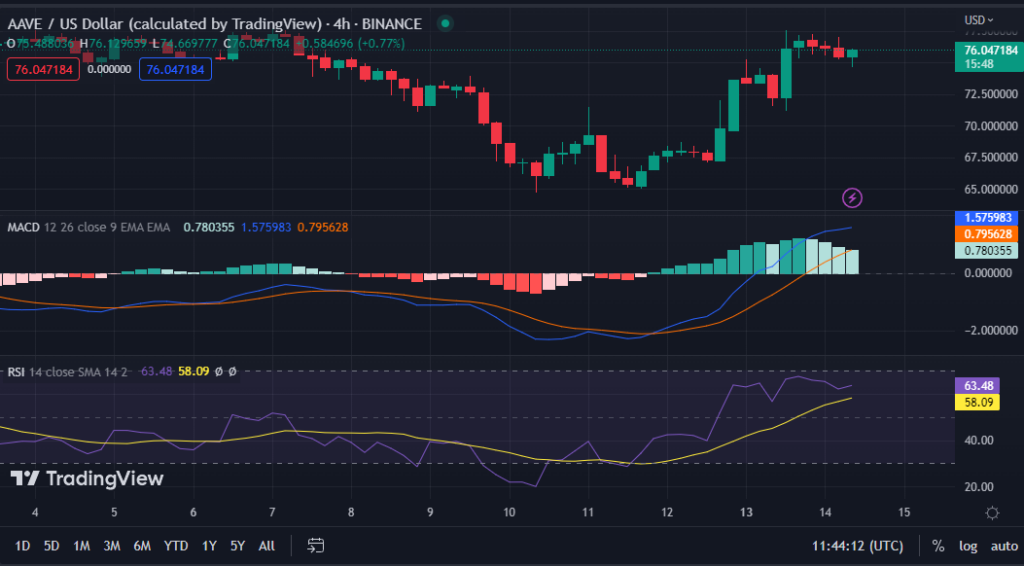
When the MACD blue line on the AAVE price chart climbs above its signal line, the positive momentum may continue soon, signaling a possible buying opportunity for traders. With a MACD value of 1.546571, this bullish picture in the AAVE market is apparent.
Also, the histogram is trending in the positive zone, supporting the bullish momentum and providing a possible buying opportunity for traders wishing to join the market.
The Relative Strength Index (RSI) reading of 62.51 and rising higher further shows that buying pressure is building. The uptrend may continue soon, making it an excellent opportunity to join the market for possible rewards. If the price hits the overbought level of over 70, it may suggest a likely trend correction or reversal, and traders should be careful and consider taking gains.
AAVE breaks through resistance as bullish momentum surges, signaling a potential buying opportunity for traders.
Disclaimer: The views, opinions, and information shared in this price prediction are published in good faith. Readers must do their research and due diligence. Any action taken by the reader is strictly at their own risk. Coin Edition and its affiliates will not be liable for direct or indirect damage or loss.
Disclaimer: The information presented in this article is for informational and educational purposes only. The article does not constitute financial advice or advice of any kind. Coin Edition is not responsible for any losses incurred as a result of the utilization of content, products, or services mentioned. Readers are advised to exercise caution before taking any action related to the company.


 Price Prediction 2026-2030: Will LTC Hit $80 Soon?")
