


- Santiment revealed in a tweet yesterday that ADA and XRP are seeing high levels of sell volume at low prices.
- ADA was able to print a 24-hour gain while XRP saw its price drop over the past day of trading.
- Technical indicators on XRP’s daily chart suggested that the altcoin’s price may drop to $0.4436.
The blockchain analytics firm Santiment tweeted yesterday that many top cap crypto assets are being traded at a loss following the high level of profit taking last week. According to the post, Cardano (ADA) and XRP (XRP) are seeing notably high amounts of sell volume at lower prices, which increases the chances of positive rebounds for both altcoins, predicted the firm.
At press time, CoinMarketCap indicated that ADA printed a 24-hour gain while XRP’s price dropped slightly during the same period. ADA was trading at $0.2833 after its price rose 0.61% over the past day of trading. In addition to strengthening against the Dollar, ADA also outperformed the two market leaders Bitcoin (BTC) and Ethereum (ETH) as well.
XRP, on the other hand, saw its price drop 0.60% over the past 24 hours. As a result, the remittance token’s price stood at $0.4673 at press time. Furthermore, the altcoin weakened against BTC and ETH and was down 0.73% against BTC and 0.89% against the largest altcoin by market cap.
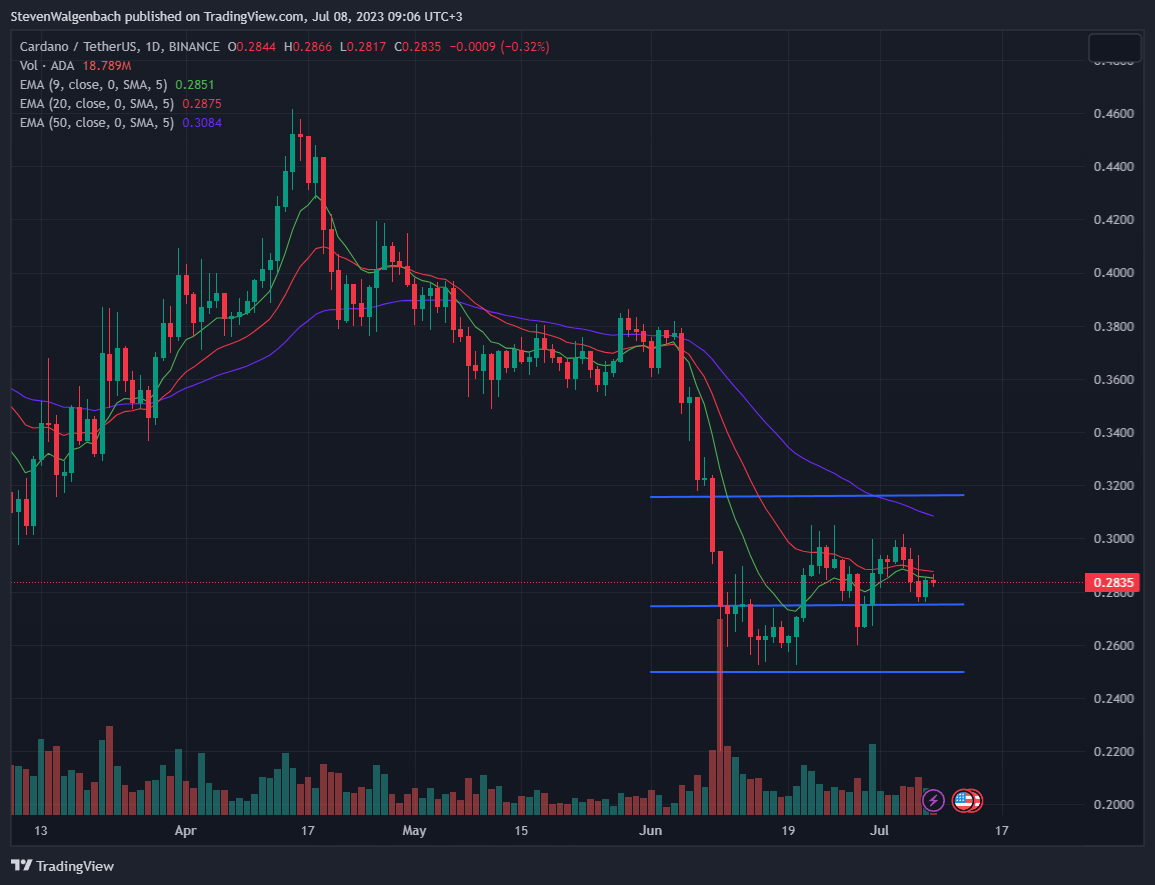
ADA was trading below the 9-day EMA line after it was able to break above the technical indicator earlier in today’s trading session. Should ADA close today’s daily candle above the 9-day and 20-day EMA lines, it may rise to $0.3079 in the following few days. Conversely, a daily close below the 9-day EMA line today will put ADA at risk of falling to $0.2748.
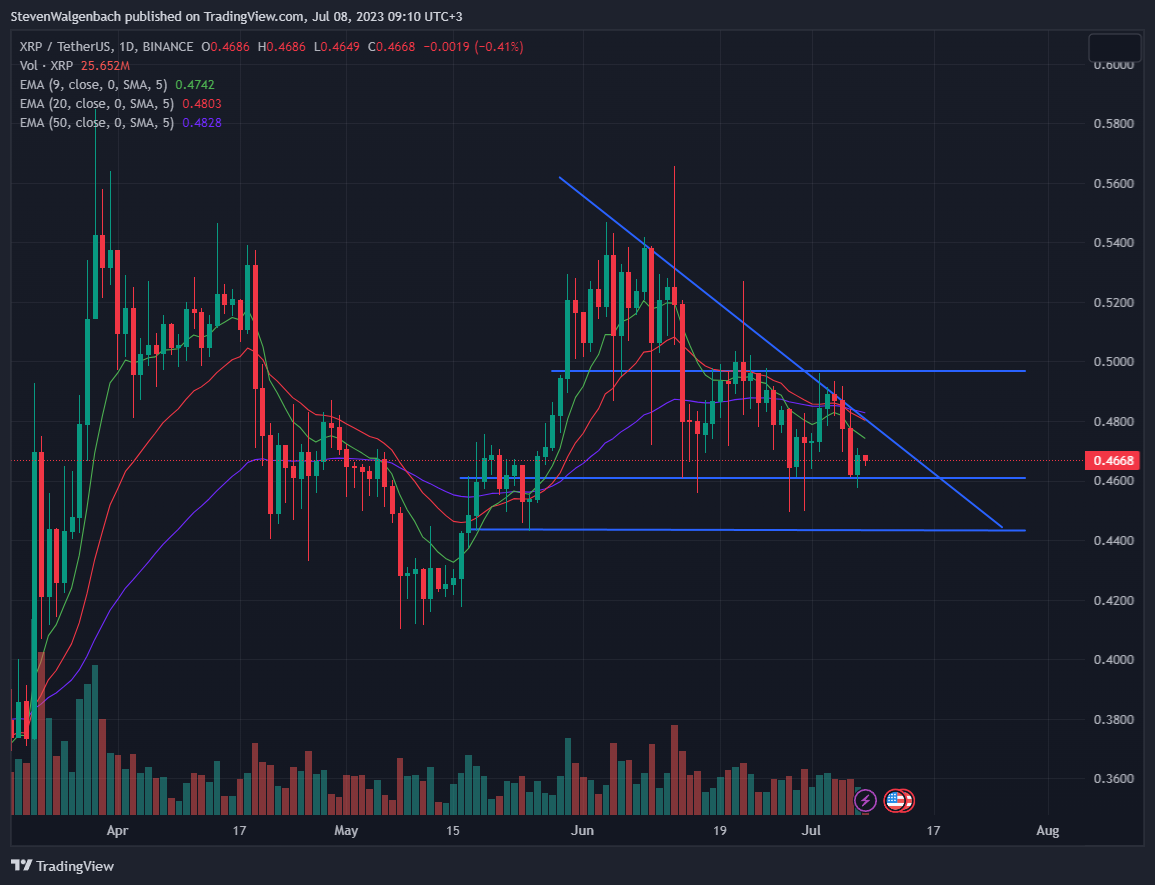
Technical indicators on XRP’s daily chart suggested that the crypto’s price may drop to the support level at $0.4436 in the next 24-48 hours. Firstly, a bearish descending triangle pattern had formed on XRP’s daily chart after the altcoin printed lower highs over the past month.
Secondly, the 20-day EMA line had crossed bearishly below the 50-day EMA line on Wednesday, which signaled that XRP had entered into a medium-term bearish trend. However, if XRP’s price is able to remain above the crucial support level at $0.4610 for the next week, then the bearish thesis will be invalidated and XRP may rise to $0.4972 in the following days.
Disclaimer: The views and opinions, as well as all the information shared in this price analysis, are published in good faith. Readers must do their own research and due diligence. Any action taken by the reader is strictly at their own risk. Coin Edition and its affiliates will not be held liable for any direct or indirect damage or loss.
Disclaimer: The information presented in this article is for informational and educational purposes only. The article does not constitute financial advice or advice of any kind. Coin Edition is not responsible for any losses incurred as a result of the utilization of content, products, or services mentioned. Readers are advised to exercise caution before taking any action related to the company.
 Price Prediction 2026, 2027, 2028, 2029, 2030-2050")
 Price Prediction 2026, 2027, 2028, 2029, 2030-2050")


