


 Price Prediction 2024-2030: Will ALGO Price Hit $1 Soon?")
- Bullish Algorand (ALGO) price prediction ranges from $0.6 to $1.6.
- Analysis suggests that the ALGO price might reach above $0.76.
- The Algorand bearish market price prediction for 2024 is $0.10.
Aside from Bitcoin (BTC) and Ethereum (ETH), there are other digital currencies worth considering for people looking to diversify their portfolios and get experience with new cryptocurrencies. Algorand (ALGO) is one of them.
Algorand is one of several new initiatives aiming to increase the number of use cases for cryptocurrencies by increasing transaction speeds and decreasing the amount of time it takes for transactions to be pronounced final on its network.
If you are interested in the future of ALGO and want to know its predicted value for, 2024, 2025, and 2030, keep reading!
Table of contents
- Algorand (ALGO) Price Prediction 2024-2050 Overview
- What is Algorand (ALGO)?
- Algorand (ALGO) Price Analysis 2024
- Algorand (ALGO) Price Prediction 2024
- Algorand (ALGO) Price Prediction 2025
- Algorand (ALGO) Price Prediction 2026
- Algorand (ALGO) Price Prediction 2027
- Algorand (ALGO) Price Prediction 2028
- Algorand (ALGO) Price Prediction 2029
- Algorand (ALGO) Price Prediction 2030
- Algorand (ALGO) Price Prediction 2040
- Algorand (ALGO) Price Prediction 2050
- Conclusion
- FAQ
Algorand (ALGO) Price Prediction 2024-2050 Overview
| Year | Minimum Price | Average Price | Maximum Price |
| 2024 | $0.5 | $0.76 | $1 |
| 2025 | $0.8 | $1.6 | $2.5 |
| 2026 | $1.5 | $2.4 | $3 |
| 2027 | $0.1 | $0.16 | $0.25 |
| 2028 | $0.3 | $0.6 | $1 |
| 2029 | $1.5 | $3.5 | $6 |
| 2030 | $2.5 | $6 | $9 |
| 2040 | $10 | $20 | $25 |
| 2050 | $20 | $35 | $50 |
What is Algorand (ALGO)?
The Algorand token, known as ALGO, is the native cryptocurrency of the Algorand blockchain, a decentralized, permissionless blockchain designed to address issues of scalability, security, and decentralization. Algorand is a self-sustaining, decentralized, blockchain-based network that enables a variety of applications.
Envisioning a world where everyone creates and exchanges value efficiently, transparently, and securely, ALGO seeks to build global trust through decentralization. Furthermore, it eliminates the barrier that stands in the way of prosperity.
Algorand was invented to speed up transactions and improve efficiency, in response to the slow transaction times of Bitcoin and other blockchains. Further, Algorand is streamlined so that the transaction fees are lower, as well as no mining (like Bitcoin’s energy-intensive process), as it is based on a permissionless pure proof-of-stake (PoS) blockchain protocol.
These systems are secure, scalable, and efficient. Furthermore, Algorand will support computations that require reliable performance guarantees to create new forms of trust.
Algorand (ALGO) Price Analysis 2024
Will Algorand ’s most recent improvements, additions, and modifications to its blockchain help its native token ALGO’s price rise? Read more to find out about ALGO’s 2024 price analysis.
Algorand (ALGO) Price Analysis – Bollinger Bands
The Bollinger bands are primarily three bands– the upper band, middle band and lower band. These bands expand and contract based on the market dynamics. The middle band is the average, while the upper band and lower band are the extreme ends that the price rises or falls to. Based on how the traders interact, the bands expand and contract. When the band expands, there could be a rise or fall of price by a huge margin. However, on the contrary when the band shrinks, there is not going to be much fluctuation in prices.
Since the beginning of November ALGO has been on an uptrend and most of its activity has been in the upper half of the Bollinger band. This behavior in the upper half of the Bollinger band shows that ALGO is performing well above the average. As ALGO has been consistently testing the upper band, there is a high chance that it may rebound off of it and land on the SMA. Moreover, the gaping bands may contract once the buying spree for ALGO fades away.
Algorand(ALGO) Price Analysis – Relative Strength Index
The Relative Strength Index (RSI) indicator used to measure whether the price of a cryptocurrency is over or undervalued. For this purpose, it has two extreme regions known as the overbought and oversold regions.
When the RSI reads a value (>70) then the crypto is overbought, which means that due to more buying the demand has increased as such the price has also increased. On the other hand, when it is oversold (<30), many are selling, as such, its price is undervalued.
Moreover, it has a signal line which is a Simple Moving Average (SMA) that acts as a yardstick or reference to the RSI line. Hence, whenever the RSI line is above the SMA it is considered bullish and if it’s below the SMA then it is bearish.
Currently the RSI is valued at 76, which is the overbought region. As such, there could be a correction coming soon. However, as the RSI is still facing deep into the overbought region, there might be still more buyers for ALGO. So the best way to adjudicate, when the uptrend is over would be to watch the RSI fall below the SMA. However, the RSI also gives fake signals, hence, traders may need to be wary.
Algorand (ALGO) Price Analysis – Moving Average Convergence and Divergence (MACD)
The Moving Average Convergence and Divergence indicators use two exponential moving averages (EMA) to find how the cryptocurrency is doing. Usually, the longer EMA is the 26-Day EMA and the shorter is the 12-Day EMA. The MACD is found by reducing the 12-day EMA from the 26-day EMA. If the MACD is positive that means the crypto is performing but if it’s negative, then it is losing value.The histogram in the indicator turns green when the MACD is above the SMA and becomes red when the MACD falls below the SMA.
Currently, the MACD for ALGO is in the positive region and reads a value of 0.0474. This shows the token is doing well on average during the last 12-days compared to the last 26-day. The circles on the chart show the points where the MACD crosses the SMA. When the MACD crosses the SMA from above, the prices start to fall, when it crosses the SMA from below, ALGO gains value. As ALGO is currently gaining value, sellers waiting to making profit may need to wait for the crossover before taking a short position.
Algorand (ALGO) Price Prediction 2024
After taking the Adam and Eve trading pattern ALGO has rebounded off of the support and is trading at $0.335. The yellow rectangle highlights how ALGO behaved when it was in this price range. If we see a reciprocation of that same behavior for ALGO, then there is a high chance that ALGO could reach Resistance 1 at $0.49. Thereafter, it may get rejected at $0.49 and reach the support. However, once it starts going up, then resistance 1 might not have the power to stop, as ALGO could crash resistance 1 and reach resistance 2 at $0.76.
Algorand (ALGO) Price Prediction – Resistance and Support Levels
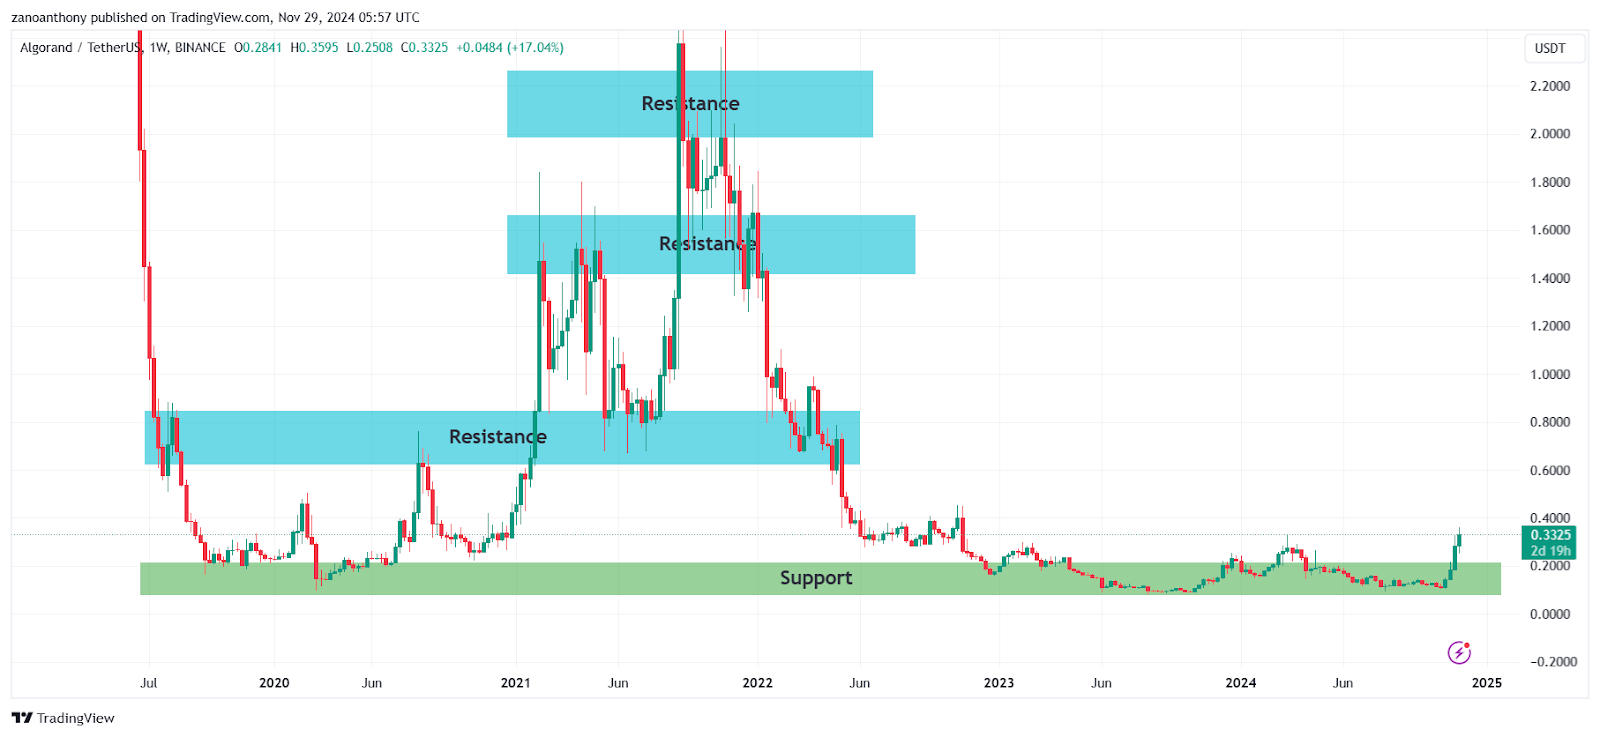
Currently, ALGO is resting at the support level and it is gaining value and heading towards the resistance level. This could be the start of its journey moving towards the resistance level at $1.6. 2021 which the very next year to BTC halving in 2020 brought about this great increase in price. Hence, 2025 which is also the very next year to BTC halving in 2024 might produce such an uptrend for ALGO.
Algorand (ALGO) Price Prediction 2025
ALGO may experience the after-effects of the Bitcoin halving and there is a high chance that it could trade much higher than its 2024 price. Many trade analysts speculate that BTC halving could create a huge impact on the crypto market. Moreover, similar to many altcoins, Algorand will continue to rise in 2025 forming new resistance levels. It is expected that Algorand (ALGO) will trade beyond the $1.6 level.
Algorand (ALGO) Price Prediction 2026
As per the market cycle, it is expected that after a long period of bull run, the bears will come into power and start negatively impacting the cryptocurrencies. However, in ALGO’s case it does seem to be the case, as the bear had no control over the bulls. Hence, ALGO could reach around $2.4 by 2026.
Algorand (ALGO) Price Prediction 2027
During this period, ALGO will start to shed value as the traders start to sell ALGO and reap the benefits. Therefore Algorand’s price might reach as low as $0.16 by the end of 2027.
Algorand (ALGO) Price Prediction 2028
As the crypto community’s hope will be re-ignited looking forward to Bitcoin halving like many altcoins, Algorand may reciprocate its past behavior during the BTC halving. Hence, Algorand (ALGO) would be trading at $0.6 after experiencing a considerable surge by the end of 2028.
Algorand (ALGO) Price Prediction 2029
2029 is expected to be another bull run due to the aftermath of the BTC halving. However, traders speculate that the crypto market will gradually become stable by this year. In tandem with the stable market sentiment, Algorand (ALGO) could be trading at $3.5 by the end of 2029.
Algorand (ALGO) Price Prediction 2030
After witnessing a bullish run in the market, Algorand and many altcoins would show signs of consolidation and might trade sideways and move downwards for some time while experiencing minor spikes. Therefore, by the end of 2030, Algorand (ALGO) could be trading at $6.
Algorand (ALGO) Price Prediction 2040
The long-term forecast for Algorand indicates that this altcoin could reach a new all-time high (ATH). This would be one of the key moments as HODLERS may expect to sell some of their Coins at the ATH point.
If they start selling then Algorand could fall in value. It is expected that the average price of Algorand (ALGO) could reach $20 by 2040.
Algorand (ALGO) Price Prediction 2050
Since Cryptocurrency will be revered and widely accepted by most people during the 2050s, we will see the masses believe more in it. As such Algorand (ALGO) could reach $35.
Conclusion
Algorand is currently rising from the ashes and currently it is at the floor price. With the bull run coming in 2025 ALGO could reach above $0.76 very soon.
FAQ
Algorand is a self-sustaining, decentralized, blockchain-based network that supports a wide range of applications.
Algorand is available on many exchanges like Binance, Huobi Global.
With much potential in the market for Algorand , there is a high probability that Algorand could reach the All Time High.
Since ALGO is currently on an uptrend, it could reach $0.76 in no time.
ALGO is at its floor price with the bull run around the corner, therefore Algorand could be a good investment .
The lowest price of Algorand is $44.02
The maximum supply of Algorand is 21M Algorand.
Algorand could be stored in a hot or cold wallet, or exchange wallet.
Algorand is expected to reach $0.76 by 2024.
Algorand is expected to reach $1.6 by 2025.
Algorand is expected to reach $2.4 by 2026.
Algorand is expected to reach $0.16 by 2027.
Algorand is expected to reach $0.6 by 2028.
Algorand is expected to reach $3.5 by 2029.
Algorand is expected to reach $6 by 2030.
Algorand is expected to reach $20 by 2040.
Algorand is expected to reach $35 by 2050.
Disclaimer: The information presented in this article is for informational and educational purposes only. The article does not constitute financial advice or advice of any kind. Coin Edition is not responsible for any losses incurred as a result of the utilization of content, products, or services mentioned. Readers are advised to exercise caution before taking any action related to the company.


