
- Bitcoin holds strong at $107K as it enters the final stretch to test its all-time high
- Analysts predict a new ATH is imminent, with all eyes on the final $108,900 resistance
- A massive short squeeze is adding fuel to the upward momentum as bulls take full control
Bitcoin’s recent price action signals that a major move may be on the horizon. After clearing crucial liquidity levels, Bitcoin appears ready to challenge its final resistance before setting a new all-time high.
This momentum comes amid increased market activity, significant liquidations, and cautious technical indicators. With bulls eyeing the $108,900 mark, the coming days may prove pivotal.
What Is the Final Hurdle for a New All-Time High?
Bitcoin surged past the $105,797 resistance level, confirming strong bullish sentiment in the market. As of press time priced at $107,538, the asset reflects a 1.72% gain in the past 24 hours and a 2.70% increase over the last week.
This upward movement aligns with van de Poppe’s analysis, who emphasizes the importance of the $108,900 region as a critical resistance. Breaking this zone could trigger a rally towards new all-time highs.
However, traders must remain cautious. Bitcoin has absorbed significant liquidity, suggesting a minor pullback could occur. A drop toward $105,800 is possible, and this level now serves as short-term support.
If buyers defend this area, the stage is set for consolidation followed by a sharp rally. Conversely, if Bitcoin fails to hold above $105,500, lower levels at $103,000 or even $100,000 could be tested.
Related: Whale Loses $3.5M in BTC Liquidation, Rebounds With 40x Long for $1.06M Profit
Technicals Show Mixed Signals
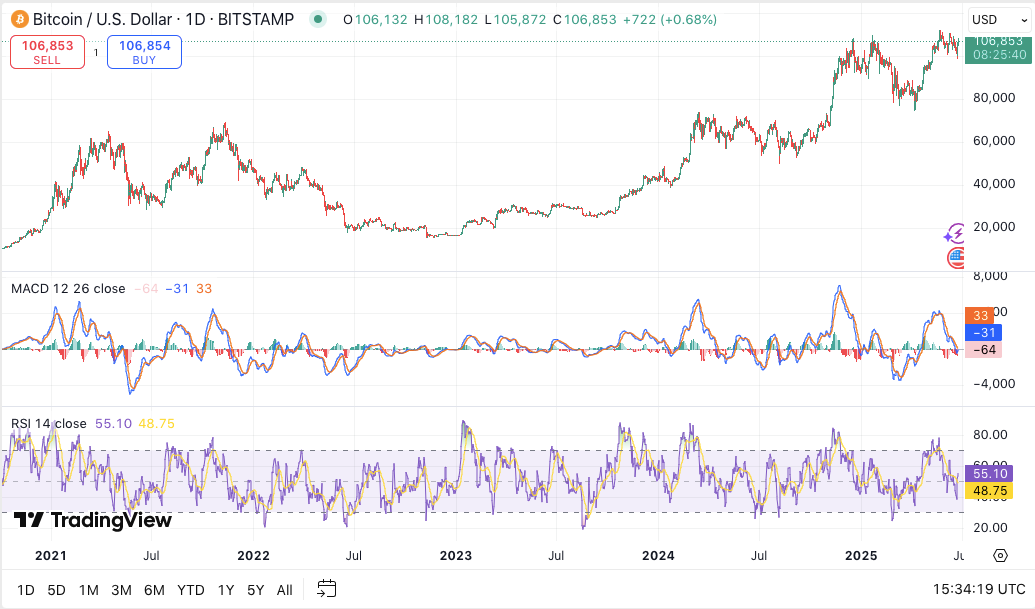
While price action remains bullish, momentum indicators paint a more nuanced picture. The MACD line is slightly below the signal line, hinting at waning bullish strength. Additionally, the histogram is slightly negative, suggesting a pause in upward momentum.
Meanwhile, the RSI stands at 55.93 indicating a neutral market. It’s not yet overbought or oversold, leaving room for movement in either direction.
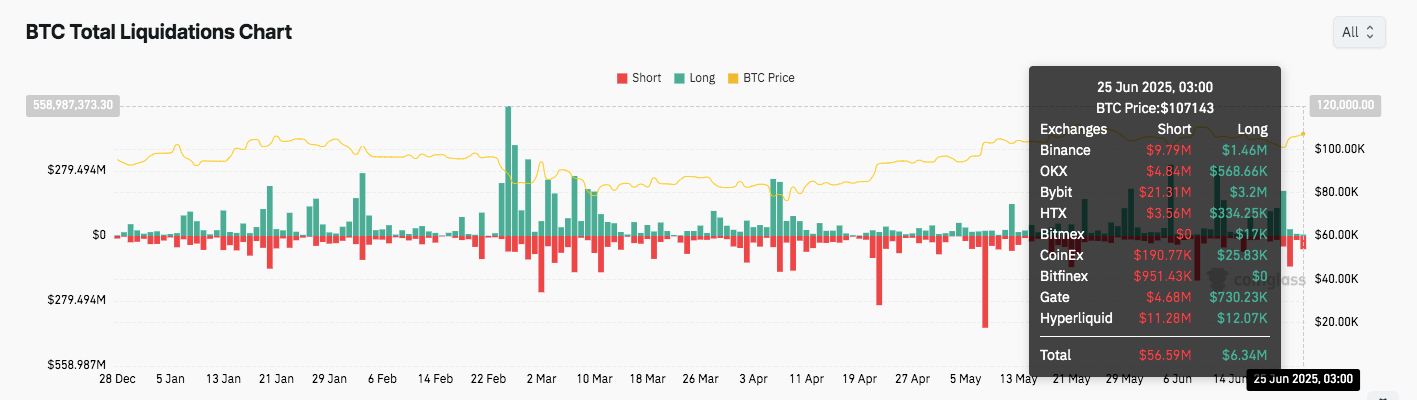
Significantly, liquidation data reflects aggressive market reactions. As of June 25, over $56 million in short positions were liquidated, compared to only $6.34 million in longs.
Related: Bitcoin Price Prediction: Can BTC Reclaim the $103K Level After Sharp Rebound?
Notable exchanges like Bybit and Bitfinex saw the largest activity. This imbalance indicates bearish traders being forced out during minor rebounds, which may further fuel upward pressure.
Disclaimer: The information presented in this article is for informational and educational purposes only. The article does not constitute financial advice or advice of any kind. Coin Edition is not responsible for any losses incurred as a result of the utilization of content, products, or services mentioned. Readers are advised to exercise caution before taking any action related to the company.


