- Michel van de Poppe predicted that the altcoin market cap could reach $1+ trillion if it breaks above $675 billion.
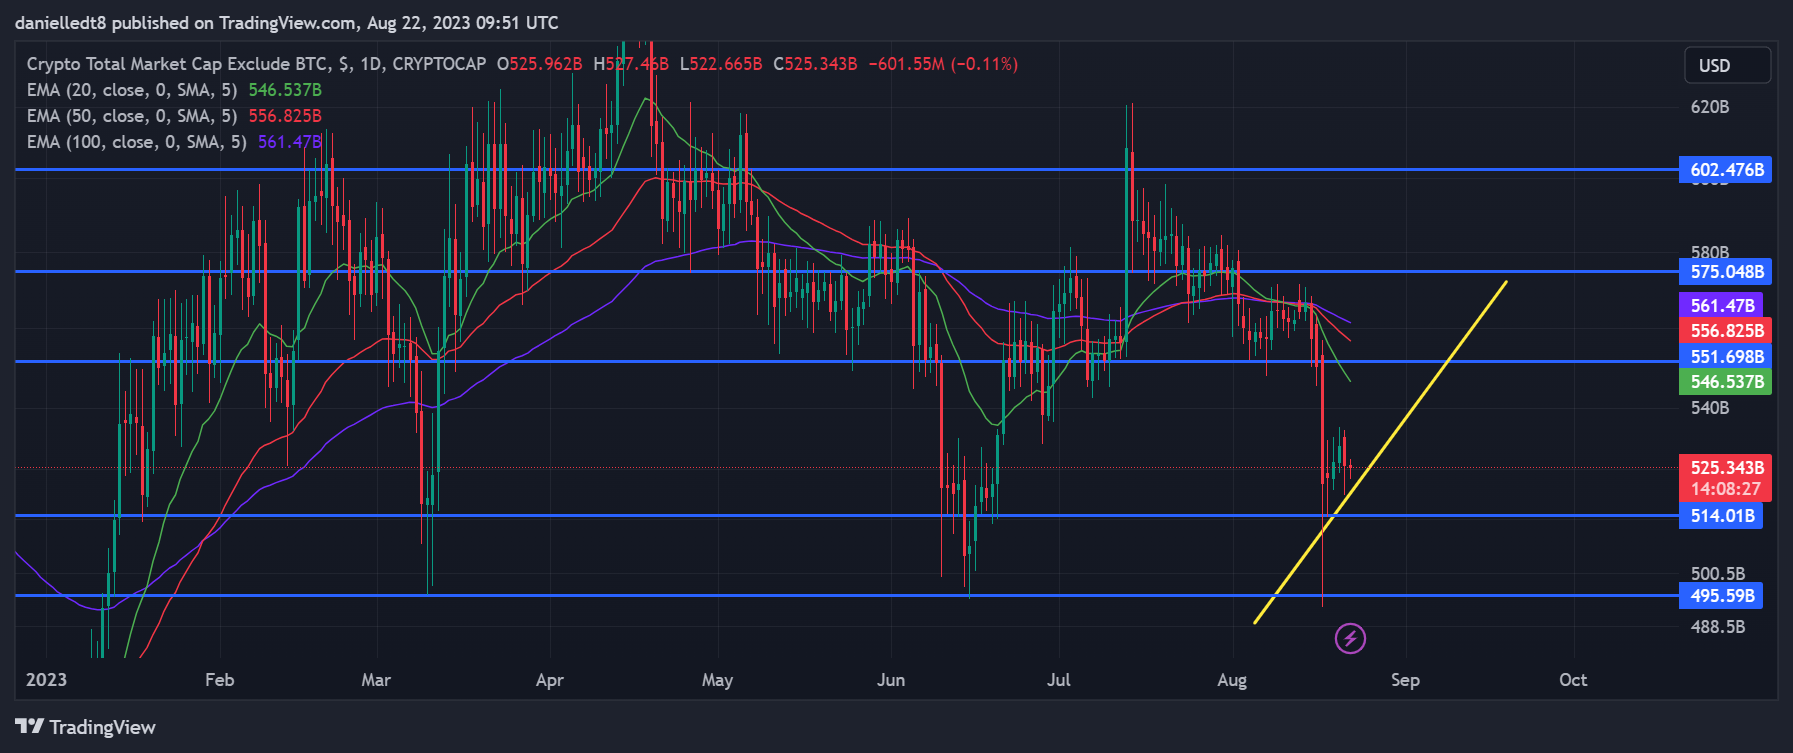
- During the past week, the collective altcoin market cap (TOTAL2) printed two higher lows.
- However, investors will want to take note of the fact that medium-term and long-term momentum was in favor of sellers.
The global altcoin market cap is currently still consolidating between the range of $425-675 billion, according to a post shared by renowned trader and analyst Michael van de Poppe earlier today. However, if the market cap can break above the $675 billion resistance, van de Poppe believes it could target $1+ trillion soon.
During the past week, the collective altcoin market cap (TOTAL2) printed 2 higher lows. This resulted in the formation of a positive trend line, which may suggest that altcoins will continue to strengthen throughout the coming week.

If this bullish thesis is validated, TOTAL2 may attempt to flip the $551.698 resistance level into support. This will then open up the possibility of the collective altcoin market cap rising to the next significant mark at around $575.048 billion.
Traders and investors may then begin to buy into altcoins as a result of the fear of missing out on potential gains, which could then elevate TOTAL2 to $602.476 billion. This will be the last resistance level standing in the way of the altcoin market’s valuation soaring to above the $1 trillion mark highlighted in van de Poppe’s tweet.
This bullish thesis will be invalidated, however, if TOTAL2 breaks below the positive trendline that had formed on its daily chart at around $522.234 billion. In this scenario, the altcoin market’s valuation could lose the support of the $514.01 billion mark. A break below this level will then put TOTAL2 at risk of falling to $495.59 billion.
Investors and traders will want to take note of the fact that medium-term and long-term momentum was in favor of sellers. This was evident by the fact that the 20-day EMA line was positioned below the 50-day EMA line at press time. Furthermore, both of these technical indicators were positioned below the 100 EMA line on TOTAL2’s daily chart.
Disclaimer: The views and opinions, as well as all the information shared in this price analysis, are published in good faith. Readers must do their own research and due diligence. Any action taken by the reader is strictly at their own risk. Coin Edition and its affiliates will not be held liable for any direct or indirect damage or loss.
Disclaimer: The information presented in this article is for informational and educational purposes only. The article does not constitute financial advice or advice of any kind. Coin Edition is not responsible for any losses incurred as a result of the utilization of content, products, or services mentioned. Readers are advised to exercise caution before taking any action related to the company.


