- AMP bulls retreat after failing to breach the resistance at $0.002565.
- Indicators point to a potential turnaround if bulls continue to battle for control and support holds.
- Bearish strength tests the support level at $0.002443 in the last 24 hours.
The Amp (AMP) market has been taken by a bearish grip in the recent 24 hours, with bears dropping prices from a 24-hour high of $0.002565 to a support level of $0.002443. AMP was trading at $0.002444 at the time of publishing, reflecting a 4,16% drop from its 24-hour high.
The gloomy mood is driven by a lack of purchase demand and increased selling activity, as investors remain concerned about AMP’s market prospects. As a result, AMP’s market capitalization and 24-hour trading volume fell by 2.73% and 46.13%, respectively, to $103,203,203 and $11,081,777.
A break below the 24-hour support level of $0.002443 might pave the way for the next support level to monitor, $0.002200. This pattern might lead to more selling pressure and a continuation of AMP’s downturn. Holding above $0.002443, though, would indicate a possible reversal in the downtrend and likely pique the curiosity of investors once again.

The AMPUSD negative sentiment is relatively mild, with a Chaikin Money Flow (CMF) value of 0.09. This level suggests that there is still some purchasing pressure for AMPUSD in the market, but it is not significant enough to imply a positive trend.
If the CMF rating rises over 0.20, it indicates increased purchasing pressure and may imply a change toward a more optimistic mood. However, if the CMF rating falls below 0.05, a decline in purchasing pressure and a probable increase in bearish sentiment for AMPUSD may be on the way.
With a score of 51.15, the Relative Strength Index is trending upward, attempting to breach its signal line, indicating that the bearish momentum may wane. If the RSI continues to climb and passes its signal line, it might imply a move toward bullish momentum and increasing AMPUSD purchasing activity.
However, RSI failing to pass its signal line and beginning to fall may point to a prolonged negative trend will continue, and buying pressure for AMPUSD may reduce.

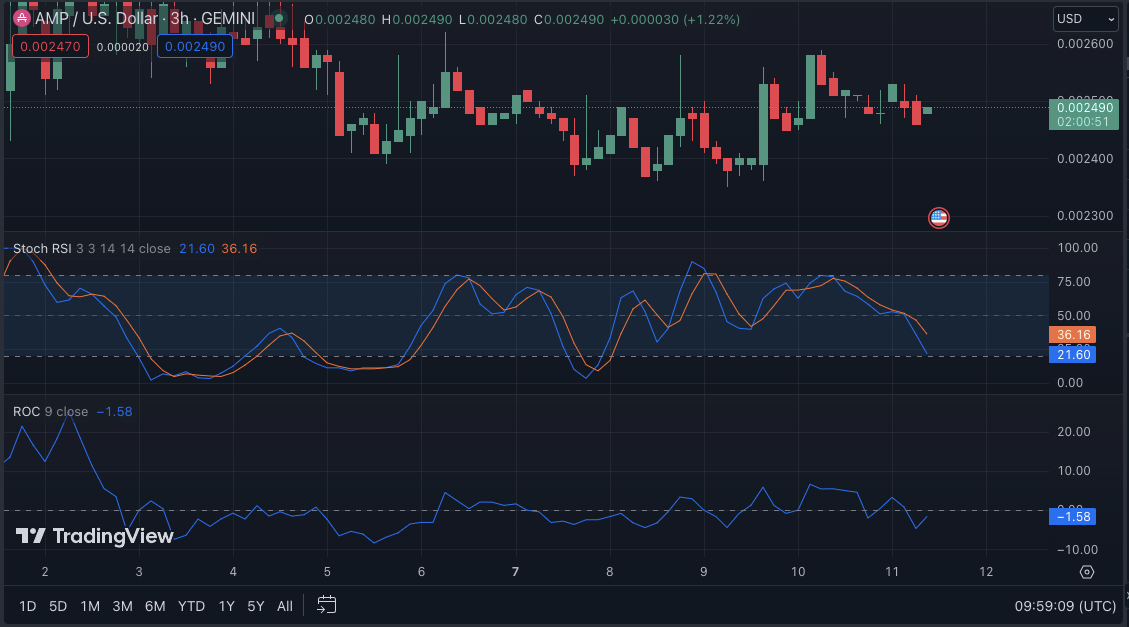
The stochastic RSI rating of 21.60 on the AMP price chart lends weight to the prospect of a change toward positive momentum. A score of less than 20 indicates oversold conditions, suggesting a likely comeback in the price of AMPUSD.
The Rate of Change (ROC) is heading higher at -1.58, indicating that bullish price momentum is growing for AMPUSD. A move in the ROC above zero indicates a positive trend, leading to additional buying pressure. However, if the ROC remains negative and continues to fall, it may indicate that the price will fall further and the bearish momentum for AMPUSD will continue.

In summary, AMP’s recent bearish trend after failing to breach resistance at $0.002443 could be nearing its end, as indicators suggest a potential turnaround.
Disclaimer: The views, opinions, and information shared in this price prediction are published in good faith. Readers must do their research and due diligence. Any action taken by the reader is strictly at their own risk. Coin Edition and its affiliates will not be liable for direct or indirect damage or loss.
Disclaimer: The information presented in this article is for informational and educational purposes only. The article does not constitute financial advice or advice of any kind. Coin Edition is not responsible for any losses incurred as a result of the utilization of content, products, or services mentioned. Readers are advised to exercise caution before taking any action related to the company.


