


- Captain Faibik, a crypto analyst, noted that a cup and handle pattern has formed on a BTC weekly chart.
- The analyst believes that the market leader’s price could climb to $42K in the coming weeks.
- Meanwhile, the 9-day EMA was on the verge of crossing bullishly above the 20-day EMA line on BTC’s chart.
A crypto analyst and Bitcoin (BTC) enthusiast, Captain Faibik, took to Twitter earlier today to share his observations about the market leader’s price movements. In his post, the analyst pointed out a cup and handle formation on BTC’s weekly Perpetual Inverse Swap Contract chart, and shared his belief that the crypto could soon see a breakout.
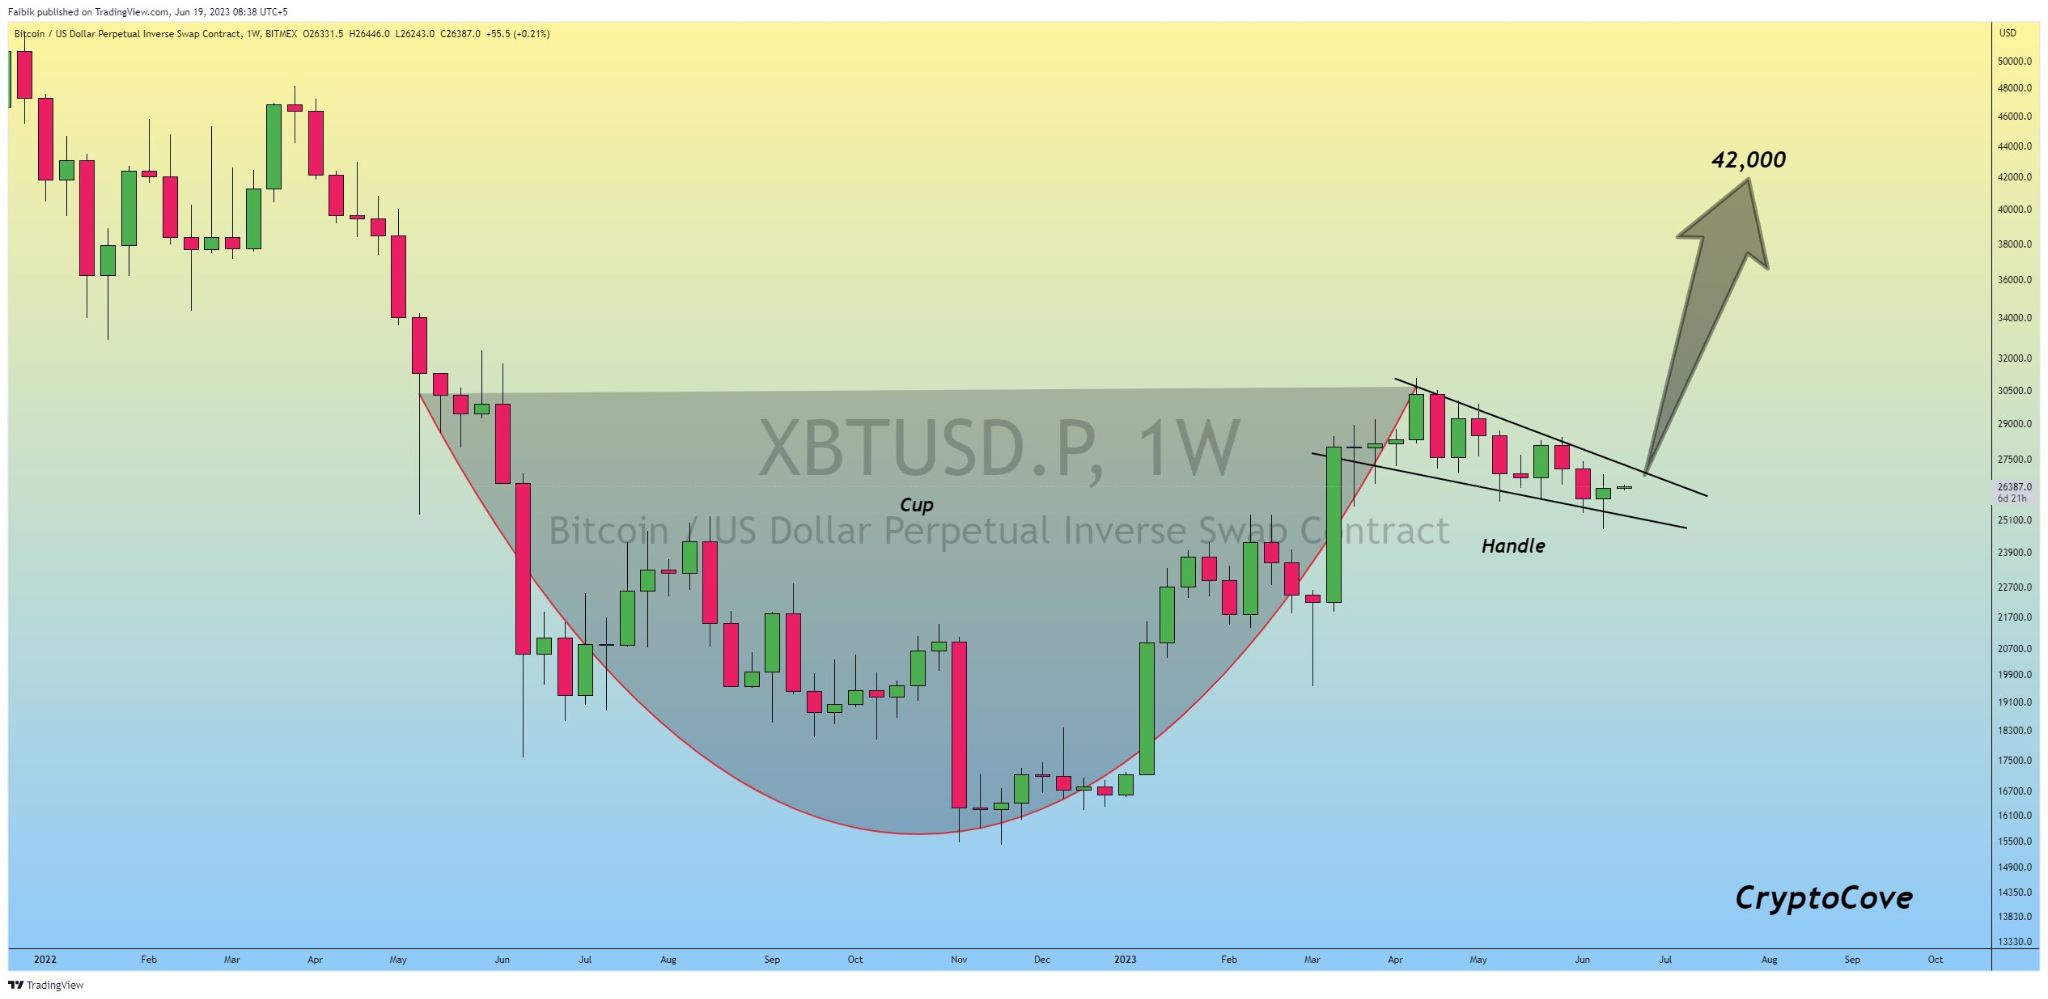
A cup and handle formation is formed when the price initially declines, reaches a low point, and then gradually recovers, forming the left side, bottom, and right side of the cup. Following the formation of the cup, there is typically a smaller downward movement or consolidation, forming a handle.
Once the handle is formed, the pattern suggests that the price is likely to break out in an upward direction. In this case, the analyst believed BTC’s price could rise as high as $42,000.
Meanwhile, CoinMarketCap indicated that BTC saw a slight price drop of 0.45% over the past 24 hours. As a result, the crypto was worth about $26,428.31 at press time. Despite its price drop, BTC’s weekly performance was still up by more than 2%. In addition, BTC’s 24-hour trading volume declined by about 1.63%, which left it standing at $9,390,658,134.
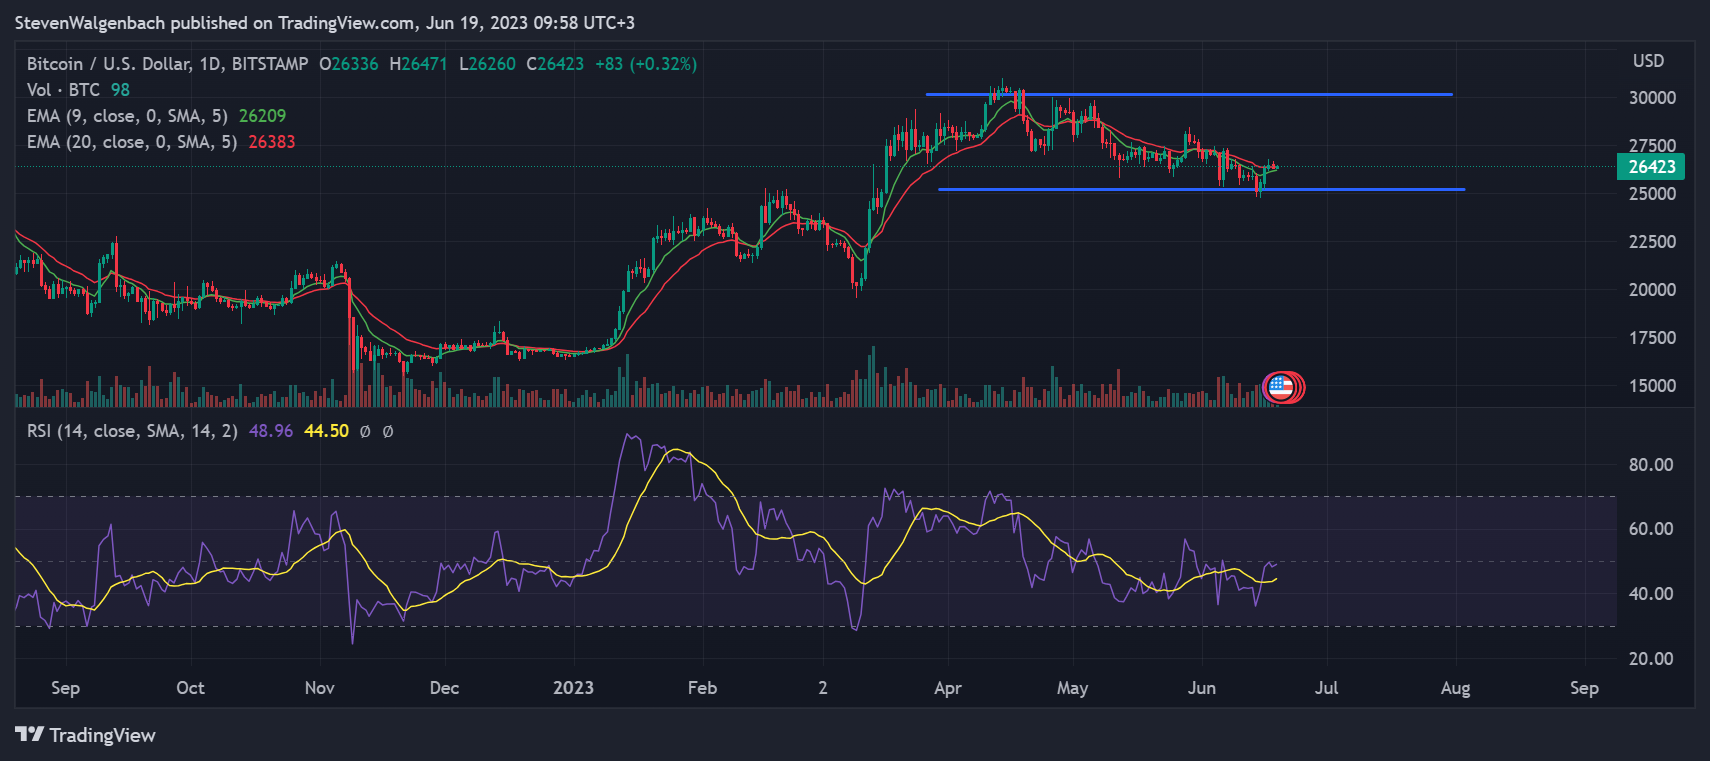
From a technical perspective, BTC’s price had dropped below the major support level at $25,275 on 13 June 2023. It continued to trade below the mark for the 24-hour period that followed before bulls stepped in to give it a much-needed boost — pushing it back above the key level.
Since then, the market leader’s price has climbed to above the 9-day EMA line, where it continued to trade at press time. Should it close the next 48 hours above the technical indicator, BTC’s price may look to climb to the next major resistance level at $30K.
On the other hand, BTC’s price closing a daily candle below the 9-day EMA line in the next 48 hours will put the crypto’s price at risk of falling back down to the aforementioned support level at $25,275. The bullish thesis will most likely play out, however, given that the 9-day EMA line was on the cusp of crossing bullishly above the 20-day EMA line.
Disclaimer: The views and opinions, as well as all the information shared in this price analysis, are published in good faith. Readers must do their own research and due diligence. Any action taken by the reader is strictly at their own risk. Coin Edition and its affiliates will not be held liable for any direct or indirect damage or loss.
Disclaimer: The information presented in this article is for informational and educational purposes only. The article does not constitute financial advice or advice of any kind. Coin Edition is not responsible for any losses incurred as a result of the utilization of content, products, or services mentioned. Readers are advised to exercise caution before taking any action related to the company.
 Price Prediction: Can BTW Sustain Its Breakout Above $0.1032?")


